

Recomendados
Más contenido relacionado
Similar a Digital marketing in Belgium 2012: infographic
Similar a Digital marketing in Belgium 2012: infographic (20)
Más de i-SCOOP
Más de i-SCOOP (20)
Último
Último (20)
Digital marketing in Belgium 2012: infographic
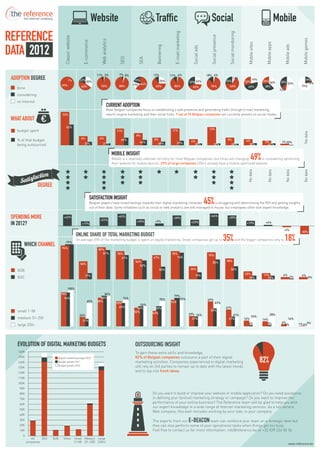
- 1. the reference the internet company Website Traffic Social Mobile REFERENCE E-mail marketing Social monitoring Social presence Classic website Mobile games Web analytics E-commerce Mobile apps DATA 2012 Mobile sites Mobile ads Bannering Social ads SEO SEA 11% 3% 7% 5% 12% 11% 4% 18% 6% ADOPTION DEGREE 1% 22% 19% 25% 25% 11% 19% 26% 36% 19% 35% 32% 26% 32% 35% 53% 4% 99% 93% 88% 17% 64% 62% 86% 76% 64% 77% 43% 42% 49% 38% done 12% considering no interest CURRENT ADOPTION Most Belgian companies focus on establishing a web presence and generating traffic through e-mail marketing, 22% search engine marketing and their social hubs. 7 out of 10 Belgian companies are currently present on social media. WHAT ABOUT 62% 12% budget spent 11% 11% No data 8% 6% 6% 5% % of that budget 45% 44% 4% 5% 4% 3% 1% 30% 37% 21% 48% 27% 30% being outsourced 10% 20% 35% 41% MOBILE INSIGHT Mobile is a relatively unknown territory for most Belgian companies, but times are changing: is considering optimizing their website for mobile devices. 23% of large companies (250+) already have a mobile optimized website. 49% No data No data No data No data DEGREE SATISFACTION INSIGHT Belgian players have mixed feelings towards their digital marketing initiatives. 45% is struggling with determining the ROI and getting insights out of their data. Some initiatives such as social or web analytics are still managed in-house, but employees often lack expert knowledge. SPENDING MORE +42% +31% +45% +39% +46% +39% +25% +9% IN 2012? +17% +23% +19% +4% -4% -30% ONLINE SHARE OF TOTAL MARKETING BUDGET 97% On average 20% of the marketing budget is spent on digital marketing. Small companies get up to 35% and the bigger companies only to 18% WHICH CHANNEL 94% 89% 81% 78% 78% 75% 67% 67% 74% 56% 58% 55% 50% 52% 35% 36% 36% B2B 22% 17% 6% 17% 19% 6% B2C 10% 10% 2% 0% 100% 95% 84% 79% 94% 85% 74% 72% 70% 69% 65% 80% 74% 70% 61% 56% 65% 56% 56% 47% small 1-50 50% 52% 43% 26% 29% 26% 61% 28% 23% medium 51-250 27% 27% 16% 14% 16% 21% 6% large 250+ 3% 3% 0% 1% 0%5% EVOLUTION OF DIGITAL MARKETING BUDGETS OUTSOURCING INSIGHT 160K To gain these extra skills and knowledge, 82% of Belgian companies outsource a part of their digital 82% 150K Digital marketing budget 2010 140K Budget growth 2011 marketing activities. Companies experienced in digital marketing Budget growth 2012 still rely on 3rd parties to remain up to date with the latest trends 130K 120K and to tap into fresh ideas. 110K 100K 90K 80K Do you want to build or improve your website or mobile application? Do you need assistance 70K in defining your (online) marketing strategy or campaign? Do you want to improve the 60K performance of your online business? The Reference-team will be glad to help you with our expert knowledge in a wide range of internet marketing services. As a full service 50K Web company, this even includes working by your side, in your company. 40K 30K The experts from our E-BEACON team can reinforce your team on a strategic level but 20K they can also perform some of your operational tasks when things get too busy. 10K Feel free to contact us for more information: info@reference.be or +32 (0)9 234 05 36. 0 All B2C B2B Other Small Medium Large companies (1-50) (51-250) (250+) www.reference.be