SlideShare una empresa de Scribd logo
1 de 3
Descargar para leer sin conexión
STAFF DRAFT PROPOSAL 1: SUMMARY TABLES
DISTRICT          Total Population                Target                 Raw Deviation         % Deviation
   1                  291,569                    305,569                    (14,000)            -4.5817%
   2                  290,418                    305,569                    (15,151)            -4.9583%
   3                  299,435                    305,569                     (6,134)            -2.0074%
   4                  291,962                    305,569                    (13,607)            -4.4530%
   5                  291,509                    305,569                    (14,060)            -4.6013%
   6                  309,010                    305,569                     3,441              1.1261%
   7                  290,322                    305,569                    (15,247)            -4.9897%
   8                  320,766                    305,569                    15,197              4.9733%
   9                  316,630                    305,569                    11,061              3.6198%
   10                 319,209                    305,569                    13,640              4.4638%
   11                 313,139                    305,569                     7,570              2.4773%
   12                 297,300                    305,569                     (8,269)            -2.7061%
   13                 320,736                    305,569                    15,167              4.9635%
   14                 307,253                    305,569                     1,684              0.5511%
   15                 319,914                    305,569                    14,345              4.6945%
   16                 296,230                    305,569                     (9,339)            -3.0563%
   17                 319,273                    305,569                    13,704              4.4847%


           PERCENT VOTING AGE POPULATION:
DISTRICT      Non-Hispanic White Alone   Non-Hispanic Black Combo   Non-Hispanic Asian Combo    Hispanic     Non-White
   1                  24.22%                     59.93%                      2.22%               12.83%       75.78%
   2                  25.03%                     58.95%                      7.99%               7.11%        74.97%
   3                  28.95%                     60.00%                      6.32%               3.63%        71.05%
   4                  13.70%                     70.53%                      0.34%               14.52%       86.30%
   5                  15.71%                     71.73%                      0.62%               11.08%       84.29%
   6                  57.26%                     30.80%                      2.09%               9.04%        42.74%
   7                  10.70%                      8.62%                      2.94%               77.33%       89.30%
   8                  28.46%                      5.22%                      3.97%               61.53%       71.54%
   9                  78.29%                      1.64%                      8.52%               10.90%       21.71%
   10                 66.48%                      9.02%                     11.54%               11.79%       33.52%
   11                 55.01%                     11.83%                      6.54%               26.03%       44.99%
   12                 67.89%                      3.38%                      8.95%               18.80%       32.11%
   13                 62.33%                     11.22%                     15.80%               9.42%        37.67%
   14                 75.96%                      1.67%                     10.63%               11.21%       24.04%
   15                 64.29%                      3.37%                     15.15%               16.31%       35.71%
   16                 36.40%                      5.11%                      2.03%               55.90%       63.60%
   17                 82.35%                      2.69%                      5.69%               8.68%        17.65%
STAFF DRAFT PROPOSAL 1: POPULATION BY NON-HISPANIC RACE - OFFICE OF MANAGEMENT AND BUDGET 3A
           Total Population Non-Hispanic   Non-Hispanic    Non-Hispanic     Non-Hispanic   Non-Hispanic     Non-Hispanic
DISTRICT                     White Alone   Black Combo    Native American   Asian Combo    Pacific Islander Some Other Race   Hispanic   Non-White
   1           291,569         63,318        177,484           567             6,261             74              498           42,009     228,251
   2           290,418         59,743        186,705           631             20,100            72              453           21,207     230,675
   3           299,435         75,199        192,240           641             17,016            75              580           11,500     224,236
   4           291,962         34,108        206,204           631              949              55              344           47,998     257,854
   5           291,509         37,856        211,609           642             1,658             78              333           37,726     253,653
   6           309,010         162,802       103,625           805             6,669            171              596           33,112     146,208
   7           290,322         23,348         21,243           381             7,281             33              385          237,351     266,974
   8           320,766         75,234         17,803           830             11,142           147              862          213,974     245,532
   9           316,630         239,804        5,753            756             27,718           129              557           41,018     76,826
   10          319,209         202,313        30,883           1,223           38,609           211              872           43,356     116,896
   11          313,139         158,134        38,412           802             19,403            86              437           95,320     155,005
   12          297,300         191,929        10,453           1,011           26,926           201              814           64,841     105,371
   13          320,736         192,870        37,894           840             50,794           190             1,109          34,802     127,866
   14          307,253         223,814        5,679            555             34,185           125              449           41,756     83,439
   15          319,914         191,806        12,583           750             50,168           126              532           62,295     128,108
   16          296,230         90,478         15,306           612             5,517             93              456          183,322     205,752
   17          319,273         255,602        9,379            702             19,068           127              496           33,175     63,671


                            PERCENT OF POPULATION:
                            Non-Hispanic   Non-Hispanic    Non-Hispanic     Non-Hispanic   Non-Hispanic     Non-Hispanic
DISTRICT    Percent Total    White Alone   Black Combo    Native American   Asian Combo    Pacific Islander Some Other Race   Hispanic   Non-White
   1           99.53%          21.72%        60.87%           0.19%            2.15%           0.03%            0.17%         14.41%      78.28%
   2           99.48%          20.57%        64.29%           0.22%            6.92%           0.02%            0.16%          7.30%      79.43%
   3           99.27%          25.11%        64.20%           0.21%            5.68%           0.03%            0.19%          3.84%      74.89%
   4           99.43%          11.68%        70.63%           0.22%            0.33%           0.02%            0.12%         16.44%      88.32%
   5           99.45%          12.99%        72.59%           0.22%            0.57%           0.03%            0.11%         12.94%      87.01%
   6           99.60%          52.69%        33.53%           0.26%            2.16%           0.06%            0.19%         10.72%      47.31%
   7           99.90%          8.04%          7.32%           0.13%            2.51%           0.01%            0.13%         81.75%      91.96%
   8           99.76%          23.45%         5.55%           0.26%            3.47%           0.05%            0.27%         66.71%      76.55%
   9           99.72%          75.74%         1.82%           0.24%            8.75%           0.04%            0.18%         12.95%      24.26%
   10          99.45%          63.38%         9.67%           0.38%           12.10%           0.07%            0.27%         13.58%      36.62%
   11          99.83%          50.50%        12.27%           0.26%            6.20%           0.03%            0.14%         30.44%      49.50%
   12          99.62%          64.56%         3.52%           0.34%            9.06%           0.07%            0.27%         21.81%      35.44%
   13          99.30%          60.13%        11.81%           0.26%           15.84%           0.06%            0.35%         10.85%      39.87%
   14          99.78%          72.84%         1.85%           0.18%           11.13%           0.04%            0.15%         13.59%      27.16%
   15          99.48%          59.96%         3.93%           0.23%           15.68%           0.04%            0.17%         19.47%      40.04%
   16          99.85%          30.54%         5.17%           0.21%            1.86%           0.03%            0.15%         61.89%      69.46%
   17          99.77%          80.06%         2.94%           0.22%            5.97%           0.04%            0.16%         10.39%      19.94%
STAFF DRAFT PROPOSAL 1: VOTING AGE POPULATION BY RACE - OFFICE OF MANAGEMENT AND BUDGET 6A
               Total Voting         Non-Hispanic   Non-Hispanic    Non-Hispanic     Non-Hispanic   Non-Hispanic     Non-Hispanic
DISTRICT      Age Population        White Alone    Black Combo    Native American   Asian Combo    Pacific Islander Some Other Race   Hispanic Non-White
   1             215,320               52,161        129,038           434             4,786            60               301          27,630    163,159
   2             221,981               55,567        130,858           486             17,746           65               337          15,780    166,414
   3             242,731               70,263        145,640           542             15,333           69               423           8,803    172,468
   4             217,244               29,764        153,227           474              748             42               235          31,546    187,480
   5             208,531               32,759        149,573           463             1,283            51               218          23,096    175,772
   6             231,440              132,521         71,294           584             4,837            133              352          20,933    98,919
   7             198,820               21,266         17,147           304             5,848            30               261          153,745   177,554
   8             236,787               67,398         12,355           666             9,408            114              595          145,686   169,389
   9             249,946              195,694         4,094            514             21,291           102              358          27,233    54,252
   10            274,584              182,543         24,759           1,043           31,686           189              643          32,361    92,041
   11            233,829              128,632         27,670           608             15,296           76               280          60,876    105,197
   12            244,884              166,241         8,275            824             21,906           165              584          46,044    78,643
   13            248,539              154,915         27,885           631             39,258           160              728          23,413    93,624
   14            236,260              179,462         3,952            397             25,125           89               290          26,489    56,798
   15            242,815              156,097         8,182            521             36,795           101              329          39,604    86,718
   16            210,042               76,452         10,730           493             4,270            77               314          117,418   133,590
   17            248,642              204,767         6,682            519             14,156           100              321          21,585    43,875


             Percent Total of      % Non-Hispanic % Non-Hispanic % Non-Hispanic % Non-Hispanic % Non-Hispanic      % Non-Hispanic
DISTRICT   Voting Age Population    White Alone    Black Combo    Native American   Asian Combo    Pacific Islander Some Other Race   Hispanic Non-White
   1              99.58%              24.22%         59.93%           0.20%            2.22%           0.03%            0.14%         12.83%    75.78%
   2              99.49%              25.03%         58.95%           0.22%            7.99%           0.03%            0.15%          7.11%    74.97%
   3              99.32%              28.95%         60.00%           0.22%            6.32%           0.03%            0.17%          3.63%    71.04%
   4              99.44%              13.70%         70.53%           0.22%            0.34%           0.02%            0.11%         14.52%    86.30%
   5              99.48%              15.71%         71.73%           0.22%            0.62%           0.02%            0.10%         11.08%    84.29%
   6              99.66%              57.26%         30.80%           0.25%            2.09%           0.06%            0.15%          9.04%    42.74%
   7              99.89%              10.70%          8.62%           0.15%            2.94%           0.02%            0.13%         77.33%    89.30%
   8              99.76%              28.46%          5.22%           0.28%            3.97%           0.05%            0.25%         61.53%    71.54%
   9              99.74%              78.29%          1.64%           0.21%            8.52%           0.04%            0.14%         10.90%    21.71%
   10             99.50%              66.48%          9.02%           0.38%           11.54%           0.07%            0.23%         11.79%    33.52%
   11             99.83%              55.01%         11.83%           0.26%            6.54%           0.03%            0.12%         26.03%    44.99%
   12             99.65%              67.89%          3.38%           0.34%            8.95%           0.07%            0.24%         18.80%    32.11%
   13             99.38%              62.33%         11.22%           0.25%           15.80%           0.06%            0.29%          9.42%    37.67%
   14             99.81%              75.96%          1.67%           0.17%           10.63%           0.04%            0.12%         11.21%    24.04%
   15             99.51%              64.29%          3.37%           0.21%           15.15%           0.04%            0.14%         16.31%    35.71%
   16             99.86%              36.40%          5.11%           0.23%            2.03%           0.04%            0.15%         55.90%    63.60%
   17             99.79%              82.35%          2.69%           0.21%            5.69%           0.04%            0.13%          8.68%    17.65%

Más contenido relacionado

La actualidad más candente (17)

Tabla chi cuadrado
Tabla chi cuadradoTabla chi cuadrado
Tabla chi cuadrado
 
Turkish consulate
Turkish consulateTurkish consulate
Turkish consulate
 
Futurevaluetables
FuturevaluetablesFuturevaluetables
Futurevaluetables
 
Korepatentistaitsitkleri
KorepatentistaitsitkleriKorepatentistaitsitkleri
Korepatentistaitsitkleri
 
I has a money puppy
I has a money puppyI has a money puppy
I has a money puppy
 
Tabelas2
Tabelas2Tabelas2
Tabelas2
 
Eco dev final
Eco dev finalEco dev final
Eco dev final
 
Tabelas
TabelasTabelas
Tabelas
 
Dodo pizza monthly update - january 2019
Dodo pizza   monthly update - january 2019Dodo pizza   monthly update - january 2019
Dodo pizza monthly update - january 2019
 
Rochester ward options
Rochester ward optionsRochester ward options
Rochester ward options
 
Social growth 4.5
Social growth 4.5Social growth 4.5
Social growth 4.5
 
108成績人數累計
108成績人數累計108成績人數累計
108成績人數累計
 
109年指考各科成績人數百分比累計表
109年指考各科成績人數百分比累計表109年指考各科成績人數百分比累計表
109年指考各科成績人數百分比累計表
 
Tabelas1
Tabelas1Tabelas1
Tabelas1
 
Sta iluu
Sta iluuSta iluu
Sta iluu
 
F.table
F.tableF.table
F.table
 
Tabel x2
Tabel x2Tabel x2
Tabel x2
 

Similar a Cook County Redistricting Plan Demographic Impact

Desempleo Por Edad
Desempleo Por EdadDesempleo Por Edad
Desempleo Por EdadAisart
 
Escrutinio Defenitivo Elecciones 2011
Escrutinio Defenitivo Elecciones 2011Escrutinio Defenitivo Elecciones 2011
Escrutinio Defenitivo Elecciones 2011Petroleuse_
 
富邦投顧研究部核心持股2011年殖利率 02.17.2012
富邦投顧研究部核心持股2011年殖利率 02.17.2012富邦投顧研究部核心持股2011年殖利率 02.17.2012
富邦投顧研究部核心持股2011年殖利率 02.17.2012yo9889
 
Resultado prova crcmg_estatistica_exame_suficiencia_1_2011
Resultado prova crcmg_estatistica_exame_suficiencia_1_2011Resultado prova crcmg_estatistica_exame_suficiencia_1_2011
Resultado prova crcmg_estatistica_exame_suficiencia_1_2011FcoCampos
 
Resultado do Exame de Suficiência 2011 - contabilistas
Resultado do Exame de Suficiência 2011 - contabilistasResultado do Exame de Suficiência 2011 - contabilistas
Resultado do Exame de Suficiência 2011 - contabilistasRoberto Dias Duarte
 
Ltn200804281069 C
Ltn200804281069 CLtn200804281069 C
Ltn200804281069 Cguest54ca90
 
Tablas propoleos
Tablas propoleosTablas propoleos
Tablas propoleosRalMejia1
 
CADE 2003 - Effects of Different Learning Styles in eLearning Environments
CADE 2003 - Effects of Different Learning Styles in eLearning EnvironmentsCADE 2003 - Effects of Different Learning Styles in eLearning Environments
CADE 2003 - Effects of Different Learning Styles in eLearning EnvironmentsMichael Barbour
 
Datos del PREP que muestran una gráfica espejo entre AMLO y el PAN
Datos del PREP que muestran una gráfica espejo entre AMLO y el PANDatos del PREP que muestran una gráfica espejo entre AMLO y el PAN
Datos del PREP que muestran una gráfica espejo entre AMLO y el PANtoliro
 
Social growth 4.10
Social growth 4.10Social growth 4.10
Social growth 4.10Mike Lewis
 
Analisis Horta Guinardo 2008 03 10
Analisis Horta Guinardo 2008 03 10Analisis Horta Guinardo 2008 03 10
Analisis Horta Guinardo 2008 03 101977bcn
 
京都大学図書館機構概要2009
京都大学図書館機構概要2009京都大学図書館機構概要2009
京都大学図書館機構概要2009kulibrarians
 
Paired Short ETFs
Paired Short ETFsPaired Short ETFs
Paired Short ETFsrich_illing
 
到都市的權利
到都市的權利到都市的權利
到都市的權利Shuwei Huang
 

Similar a Cook County Redistricting Plan Demographic Impact (20)

Desempleo Por Edad
Desempleo Por EdadDesempleo Por Edad
Desempleo Por Edad
 
Escrutinio Defenitivo Elecciones 2011
Escrutinio Defenitivo Elecciones 2011Escrutinio Defenitivo Elecciones 2011
Escrutinio Defenitivo Elecciones 2011
 
InfrormacióN DemográFica 09
InfrormacióN DemográFica 09InfrormacióN DemográFica 09
InfrormacióN DemográFica 09
 
富邦投顧研究部核心持股2011年殖利率 02.17.2012
富邦投顧研究部核心持股2011年殖利率 02.17.2012富邦投顧研究部核心持股2011年殖利率 02.17.2012
富邦投顧研究部核心持股2011年殖利率 02.17.2012
 
Estratificacion(1) dane
Estratificacion(1) daneEstratificacion(1) dane
Estratificacion(1) dane
 
Resultado prova crcmg_estatistica_exame_suficiencia_1_2011
Resultado prova crcmg_estatistica_exame_suficiencia_1_2011Resultado prova crcmg_estatistica_exame_suficiencia_1_2011
Resultado prova crcmg_estatistica_exame_suficiencia_1_2011
 
Resultado do Exame de Suficiência 2011 - contabilistas
Resultado do Exame de Suficiência 2011 - contabilistasResultado do Exame de Suficiência 2011 - contabilistas
Resultado do Exame de Suficiência 2011 - contabilistas
 
Active duty quotas 2011
Active duty quotas 2011Active duty quotas 2011
Active duty quotas 2011
 
Active quotas spring2011
Active quotas spring2011Active quotas spring2011
Active quotas spring2011
 
Ltn200804281069 C
Ltn200804281069 CLtn200804281069 C
Ltn200804281069 C
 
Tablas propoleos
Tablas propoleosTablas propoleos
Tablas propoleos
 
CADE 2003 - Effects of Different Learning Styles in eLearning Environments
CADE 2003 - Effects of Different Learning Styles in eLearning EnvironmentsCADE 2003 - Effects of Different Learning Styles in eLearning Environments
CADE 2003 - Effects of Different Learning Styles in eLearning Environments
 
CorrelationMIDWPV
CorrelationMIDWPVCorrelationMIDWPV
CorrelationMIDWPV
 
Social growth 4.5
Social growth 4.5Social growth 4.5
Social growth 4.5
 
Datos del PREP que muestran una gráfica espejo entre AMLO y el PAN
Datos del PREP que muestran una gráfica espejo entre AMLO y el PANDatos del PREP que muestran una gráfica espejo entre AMLO y el PAN
Datos del PREP que muestran una gráfica espejo entre AMLO y el PAN
 
Social growth 4.10
Social growth 4.10Social growth 4.10
Social growth 4.10
 
Analisis Horta Guinardo 2008 03 10
Analisis Horta Guinardo 2008 03 10Analisis Horta Guinardo 2008 03 10
Analisis Horta Guinardo 2008 03 10
 
京都大学図書館機構概要2009
京都大学図書館機構概要2009京都大学図書館機構概要2009
京都大学図書館機構概要2009
 
Paired Short ETFs
Paired Short ETFsPaired Short ETFs
Paired Short ETFs
 
到都市的權利
到都市的權利到都市的權利
到都市的權利
 

Más de cookcountyblog

Cook County Annual Report 2013
Cook County Annual Report 2013Cook County Annual Report 2013
Cook County Annual Report 2013cookcountyblog
 
Final Amendments to the Cook County Executive Budget Recommendation
Final Amendments to the Cook County Executive Budget RecommendationFinal Amendments to the Cook County Executive Budget Recommendation
Final Amendments to the Cook County Executive Budget Recommendationcookcountyblog
 
Tentative Amendments to the 2014 Executive Budget Recommendation
Tentative Amendments to the 2014 Executive Budget RecommendationTentative Amendments to the 2014 Executive Budget Recommendation
Tentative Amendments to the 2014 Executive Budget Recommendationcookcountyblog
 
2013 q2 star report final
2013 q2 star report   final2013 q2 star report   final
2013 q2 star report finalcookcountyblog
 
Fy2014 preliminary budget report (web)
Fy2014 preliminary budget report (web)Fy2014 preliminary budget report (web)
Fy2014 preliminary budget report (web)cookcountyblog
 
Full Report of the Cook County Sustainability Council, 060513
Full Report of the Cook County Sustainability Council, 060513Full Report of the Cook County Sustainability Council, 060513
Full Report of the Cook County Sustainability Council, 060513cookcountyblog
 
Executive Summary of Cook County Sustainability Advisory Report, 060513
Executive Summary of Cook County Sustainability Advisory Report, 060513Executive Summary of Cook County Sustainability Advisory Report, 060513
Executive Summary of Cook County Sustainability Advisory Report, 060513cookcountyblog
 
Uploading datasets to data site
Uploading datasets to data siteUploading datasets to data site
Uploading datasets to data sitecookcountyblog
 
2013 Rabies Vaccination and Microchip Clinic Calendar
2013 Rabies Vaccination and Microchip Clinic Calendar2013 Rabies Vaccination and Microchip Clinic Calendar
2013 Rabies Vaccination and Microchip Clinic Calendarcookcountyblog
 
Approved Amendments to the FY 2013 Cook County Budget
Approved Amendments to the FY 2013 Cook County BudgetApproved Amendments to the FY 2013 Cook County Budget
Approved Amendments to the FY 2013 Cook County Budgetcookcountyblog
 
2013 Cook County Suburban Warming Centers
2013 Cook County Suburban Warming Centers2013 Cook County Suburban Warming Centers
2013 Cook County Suburban Warming Centerscookcountyblog
 
2012 Cook County Government Midterm Report
2012 Cook County Government Midterm Report2012 Cook County Government Midterm Report
2012 Cook County Government Midterm Reportcookcountyblog
 
Cook County Government Budget Fy2013 Tentative Amendments
Cook County Government Budget Fy2013 Tentative AmendmentsCook County Government Budget Fy2013 Tentative Amendments
Cook County Government Budget Fy2013 Tentative Amendmentscookcountyblog
 
2013 Executive Budget Recommendation Briefing
2013 Executive Budget Recommendation Briefing2013 Executive Budget Recommendation Briefing
2013 Executive Budget Recommendation Briefingcookcountyblog
 

Más de cookcountyblog (20)

Cook County Annual Report 2013
Cook County Annual Report 2013Cook County Annual Report 2013
Cook County Annual Report 2013
 
Final Amendments to the Cook County Executive Budget Recommendation
Final Amendments to the Cook County Executive Budget RecommendationFinal Amendments to the Cook County Executive Budget Recommendation
Final Amendments to the Cook County Executive Budget Recommendation
 
Tentative Amendments to the 2014 Executive Budget Recommendation
Tentative Amendments to the 2014 Executive Budget RecommendationTentative Amendments to the 2014 Executive Budget Recommendation
Tentative Amendments to the 2014 Executive Budget Recommendation
 
2013 q2 star report final
2013 q2 star report   final2013 q2 star report   final
2013 q2 star report final
 
Fy2014 preliminary budget report (web)
Fy2014 preliminary budget report (web)Fy2014 preliminary budget report (web)
Fy2014 preliminary budget report (web)
 
Full Report of the Cook County Sustainability Council, 060513
Full Report of the Cook County Sustainability Council, 060513Full Report of the Cook County Sustainability Council, 060513
Full Report of the Cook County Sustainability Council, 060513
 
Executive Summary of Cook County Sustainability Advisory Report, 060513
Executive Summary of Cook County Sustainability Advisory Report, 060513Executive Summary of Cook County Sustainability Advisory Report, 060513
Executive Summary of Cook County Sustainability Advisory Report, 060513
 
Uploading datasets to data site
Uploading datasets to data siteUploading datasets to data site
Uploading datasets to data site
 
2013 Rabies Vaccination and Microchip Clinic Calendar
2013 Rabies Vaccination and Microchip Clinic Calendar2013 Rabies Vaccination and Microchip Clinic Calendar
2013 Rabies Vaccination and Microchip Clinic Calendar
 
Finalpfp exec summary
Finalpfp exec summaryFinalpfp exec summary
Finalpfp exec summary
 
Finalpfp report
Finalpfp reportFinalpfp report
Finalpfp report
 
Approved Amendments to the FY 2013 Cook County Budget
Approved Amendments to the FY 2013 Cook County BudgetApproved Amendments to the FY 2013 Cook County Budget
Approved Amendments to the FY 2013 Cook County Budget
 
2013 Cook County Suburban Warming Centers
2013 Cook County Suburban Warming Centers2013 Cook County Suburban Warming Centers
2013 Cook County Suburban Warming Centers
 
DHSEM CCR 121012
DHSEM CCR 121012DHSEM CCR 121012
DHSEM CCR 121012
 
2012 Cook County Government Midterm Report
2012 Cook County Government Midterm Report2012 Cook County Government Midterm Report
2012 Cook County Government Midterm Report
 
Execsumrev
ExecsumrevExecsumrev
Execsumrev
 
Cook County Government Budget Fy2013 Tentative Amendments
Cook County Government Budget Fy2013 Tentative AmendmentsCook County Government Budget Fy2013 Tentative Amendments
Cook County Government Budget Fy2013 Tentative Amendments
 
2013 Executive Budget Recommendation Briefing
2013 Executive Budget Recommendation Briefing2013 Executive Budget Recommendation Briefing
2013 Executive Budget Recommendation Briefing
 
Public Meeting Notice
Public Meeting NoticePublic Meeting Notice
Public Meeting Notice
 
Public Hearing Notice
Public Hearing NoticePublic Hearing Notice
Public Hearing Notice
 

Último

Quiz for Heritage Indian including all the rounds
Quiz for Heritage Indian including all the roundsQuiz for Heritage Indian including all the rounds
Quiz for Heritage Indian including all the roundsnaxymaxyy
 
Rohan Jaitley: Central Gov't Standing Counsel for Justice
Rohan Jaitley: Central Gov't Standing Counsel for JusticeRohan Jaitley: Central Gov't Standing Counsel for Justice
Rohan Jaitley: Central Gov't Standing Counsel for JusticeAbdulGhani778830
 
Manipur-Book-Final-2-compressed.pdfsal'rpk
Manipur-Book-Final-2-compressed.pdfsal'rpkManipur-Book-Final-2-compressed.pdfsal'rpk
Manipur-Book-Final-2-compressed.pdfsal'rpkbhavenpr
 
IndiaWest: Your Trusted Source for Today's Global News
IndiaWest: Your Trusted Source for Today's Global NewsIndiaWest: Your Trusted Source for Today's Global News
IndiaWest: Your Trusted Source for Today's Global NewsIndiaWest2
 
16042024_First India Newspaper Jaipur.pdf
16042024_First India Newspaper Jaipur.pdf16042024_First India Newspaper Jaipur.pdf
16042024_First India Newspaper Jaipur.pdfFIRST INDIA
 
57 Bidens Annihilation Nation Policy.pdf
57 Bidens Annihilation Nation Policy.pdf57 Bidens Annihilation Nation Policy.pdf
57 Bidens Annihilation Nation Policy.pdfGerald Furnkranz
 
Global Terrorism and its types and prevention ppt.
Global Terrorism and its types and prevention ppt.Global Terrorism and its types and prevention ppt.
Global Terrorism and its types and prevention ppt.NaveedKhaskheli1
 
complaint-ECI-PM-media-1-Chandru.pdfra;;prfk
complaint-ECI-PM-media-1-Chandru.pdfra;;prfkcomplaint-ECI-PM-media-1-Chandru.pdfra;;prfk
complaint-ECI-PM-media-1-Chandru.pdfra;;prfkbhavenpr
 
VIP Girls Available Call or WhatsApp 9711199012
VIP Girls Available Call or WhatsApp 9711199012VIP Girls Available Call or WhatsApp 9711199012
VIP Girls Available Call or WhatsApp 9711199012ankitnayak356677
 
Experience the Future of the Web3 Gaming Trend
Experience the Future of the Web3 Gaming TrendExperience the Future of the Web3 Gaming Trend
Experience the Future of the Web3 Gaming TrendFabwelt
 

Último (10)

Quiz for Heritage Indian including all the rounds
Quiz for Heritage Indian including all the roundsQuiz for Heritage Indian including all the rounds
Quiz for Heritage Indian including all the rounds
 
Rohan Jaitley: Central Gov't Standing Counsel for Justice
Rohan Jaitley: Central Gov't Standing Counsel for JusticeRohan Jaitley: Central Gov't Standing Counsel for Justice
Rohan Jaitley: Central Gov't Standing Counsel for Justice
 
Manipur-Book-Final-2-compressed.pdfsal'rpk
Manipur-Book-Final-2-compressed.pdfsal'rpkManipur-Book-Final-2-compressed.pdfsal'rpk
Manipur-Book-Final-2-compressed.pdfsal'rpk
 
IndiaWest: Your Trusted Source for Today's Global News
IndiaWest: Your Trusted Source for Today's Global NewsIndiaWest: Your Trusted Source for Today's Global News
IndiaWest: Your Trusted Source for Today's Global News
 
16042024_First India Newspaper Jaipur.pdf
16042024_First India Newspaper Jaipur.pdf16042024_First India Newspaper Jaipur.pdf
16042024_First India Newspaper Jaipur.pdf
 
57 Bidens Annihilation Nation Policy.pdf
57 Bidens Annihilation Nation Policy.pdf57 Bidens Annihilation Nation Policy.pdf
57 Bidens Annihilation Nation Policy.pdf
 
Global Terrorism and its types and prevention ppt.
Global Terrorism and its types and prevention ppt.Global Terrorism and its types and prevention ppt.
Global Terrorism and its types and prevention ppt.
 
complaint-ECI-PM-media-1-Chandru.pdfra;;prfk
complaint-ECI-PM-media-1-Chandru.pdfra;;prfkcomplaint-ECI-PM-media-1-Chandru.pdfra;;prfk
complaint-ECI-PM-media-1-Chandru.pdfra;;prfk
 
VIP Girls Available Call or WhatsApp 9711199012
VIP Girls Available Call or WhatsApp 9711199012VIP Girls Available Call or WhatsApp 9711199012
VIP Girls Available Call or WhatsApp 9711199012
 
Experience the Future of the Web3 Gaming Trend
Experience the Future of the Web3 Gaming TrendExperience the Future of the Web3 Gaming Trend
Experience the Future of the Web3 Gaming Trend
 

Cook County Redistricting Plan Demographic Impact

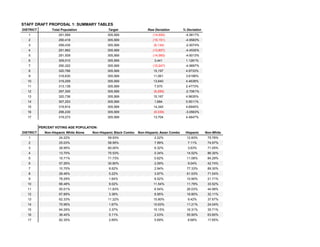
  • 1. STAFF DRAFT PROPOSAL 1: SUMMARY TABLES DISTRICT Total Population Target Raw Deviation % Deviation 1 291,569 305,569 (14,000) -4.5817% 2 290,418 305,569 (15,151) -4.9583% 3 299,435 305,569 (6,134) -2.0074% 4 291,962 305,569 (13,607) -4.4530% 5 291,509 305,569 (14,060) -4.6013% 6 309,010 305,569 3,441 1.1261% 7 290,322 305,569 (15,247) -4.9897% 8 320,766 305,569 15,197 4.9733% 9 316,630 305,569 11,061 3.6198% 10 319,209 305,569 13,640 4.4638% 11 313,139 305,569 7,570 2.4773% 12 297,300 305,569 (8,269) -2.7061% 13 320,736 305,569 15,167 4.9635% 14 307,253 305,569 1,684 0.5511% 15 319,914 305,569 14,345 4.6945% 16 296,230 305,569 (9,339) -3.0563% 17 319,273 305,569 13,704 4.4847% PERCENT VOTING AGE POPULATION: DISTRICT Non-Hispanic White Alone Non-Hispanic Black Combo Non-Hispanic Asian Combo Hispanic Non-White 1 24.22% 59.93% 2.22% 12.83% 75.78% 2 25.03% 58.95% 7.99% 7.11% 74.97% 3 28.95% 60.00% 6.32% 3.63% 71.05% 4 13.70% 70.53% 0.34% 14.52% 86.30% 5 15.71% 71.73% 0.62% 11.08% 84.29% 6 57.26% 30.80% 2.09% 9.04% 42.74% 7 10.70% 8.62% 2.94% 77.33% 89.30% 8 28.46% 5.22% 3.97% 61.53% 71.54% 9 78.29% 1.64% 8.52% 10.90% 21.71% 10 66.48% 9.02% 11.54% 11.79% 33.52% 11 55.01% 11.83% 6.54% 26.03% 44.99% 12 67.89% 3.38% 8.95% 18.80% 32.11% 13 62.33% 11.22% 15.80% 9.42% 37.67% 14 75.96% 1.67% 10.63% 11.21% 24.04% 15 64.29% 3.37% 15.15% 16.31% 35.71% 16 36.40% 5.11% 2.03% 55.90% 63.60% 17 82.35% 2.69% 5.69% 8.68% 17.65%
  • 2. STAFF DRAFT PROPOSAL 1: POPULATION BY NON-HISPANIC RACE - OFFICE OF MANAGEMENT AND BUDGET 3A Total Population Non-Hispanic Non-Hispanic Non-Hispanic Non-Hispanic Non-Hispanic Non-Hispanic DISTRICT White Alone Black Combo Native American Asian Combo Pacific Islander Some Other Race Hispanic Non-White 1 291,569 63,318 177,484 567 6,261 74 498 42,009 228,251 2 290,418 59,743 186,705 631 20,100 72 453 21,207 230,675 3 299,435 75,199 192,240 641 17,016 75 580 11,500 224,236 4 291,962 34,108 206,204 631 949 55 344 47,998 257,854 5 291,509 37,856 211,609 642 1,658 78 333 37,726 253,653 6 309,010 162,802 103,625 805 6,669 171 596 33,112 146,208 7 290,322 23,348 21,243 381 7,281 33 385 237,351 266,974 8 320,766 75,234 17,803 830 11,142 147 862 213,974 245,532 9 316,630 239,804 5,753 756 27,718 129 557 41,018 76,826 10 319,209 202,313 30,883 1,223 38,609 211 872 43,356 116,896 11 313,139 158,134 38,412 802 19,403 86 437 95,320 155,005 12 297,300 191,929 10,453 1,011 26,926 201 814 64,841 105,371 13 320,736 192,870 37,894 840 50,794 190 1,109 34,802 127,866 14 307,253 223,814 5,679 555 34,185 125 449 41,756 83,439 15 319,914 191,806 12,583 750 50,168 126 532 62,295 128,108 16 296,230 90,478 15,306 612 5,517 93 456 183,322 205,752 17 319,273 255,602 9,379 702 19,068 127 496 33,175 63,671 PERCENT OF POPULATION: Non-Hispanic Non-Hispanic Non-Hispanic Non-Hispanic Non-Hispanic Non-Hispanic DISTRICT Percent Total White Alone Black Combo Native American Asian Combo Pacific Islander Some Other Race Hispanic Non-White 1 99.53% 21.72% 60.87% 0.19% 2.15% 0.03% 0.17% 14.41% 78.28% 2 99.48% 20.57% 64.29% 0.22% 6.92% 0.02% 0.16% 7.30% 79.43% 3 99.27% 25.11% 64.20% 0.21% 5.68% 0.03% 0.19% 3.84% 74.89% 4 99.43% 11.68% 70.63% 0.22% 0.33% 0.02% 0.12% 16.44% 88.32% 5 99.45% 12.99% 72.59% 0.22% 0.57% 0.03% 0.11% 12.94% 87.01% 6 99.60% 52.69% 33.53% 0.26% 2.16% 0.06% 0.19% 10.72% 47.31% 7 99.90% 8.04% 7.32% 0.13% 2.51% 0.01% 0.13% 81.75% 91.96% 8 99.76% 23.45% 5.55% 0.26% 3.47% 0.05% 0.27% 66.71% 76.55% 9 99.72% 75.74% 1.82% 0.24% 8.75% 0.04% 0.18% 12.95% 24.26% 10 99.45% 63.38% 9.67% 0.38% 12.10% 0.07% 0.27% 13.58% 36.62% 11 99.83% 50.50% 12.27% 0.26% 6.20% 0.03% 0.14% 30.44% 49.50% 12 99.62% 64.56% 3.52% 0.34% 9.06% 0.07% 0.27% 21.81% 35.44% 13 99.30% 60.13% 11.81% 0.26% 15.84% 0.06% 0.35% 10.85% 39.87% 14 99.78% 72.84% 1.85% 0.18% 11.13% 0.04% 0.15% 13.59% 27.16% 15 99.48% 59.96% 3.93% 0.23% 15.68% 0.04% 0.17% 19.47% 40.04% 16 99.85% 30.54% 5.17% 0.21% 1.86% 0.03% 0.15% 61.89% 69.46% 17 99.77% 80.06% 2.94% 0.22% 5.97% 0.04% 0.16% 10.39% 19.94%
  • 3. STAFF DRAFT PROPOSAL 1: VOTING AGE POPULATION BY RACE - OFFICE OF MANAGEMENT AND BUDGET 6A Total Voting Non-Hispanic Non-Hispanic Non-Hispanic Non-Hispanic Non-Hispanic Non-Hispanic DISTRICT Age Population White Alone Black Combo Native American Asian Combo Pacific Islander Some Other Race Hispanic Non-White 1 215,320 52,161 129,038 434 4,786 60 301 27,630 163,159 2 221,981 55,567 130,858 486 17,746 65 337 15,780 166,414 3 242,731 70,263 145,640 542 15,333 69 423 8,803 172,468 4 217,244 29,764 153,227 474 748 42 235 31,546 187,480 5 208,531 32,759 149,573 463 1,283 51 218 23,096 175,772 6 231,440 132,521 71,294 584 4,837 133 352 20,933 98,919 7 198,820 21,266 17,147 304 5,848 30 261 153,745 177,554 8 236,787 67,398 12,355 666 9,408 114 595 145,686 169,389 9 249,946 195,694 4,094 514 21,291 102 358 27,233 54,252 10 274,584 182,543 24,759 1,043 31,686 189 643 32,361 92,041 11 233,829 128,632 27,670 608 15,296 76 280 60,876 105,197 12 244,884 166,241 8,275 824 21,906 165 584 46,044 78,643 13 248,539 154,915 27,885 631 39,258 160 728 23,413 93,624 14 236,260 179,462 3,952 397 25,125 89 290 26,489 56,798 15 242,815 156,097 8,182 521 36,795 101 329 39,604 86,718 16 210,042 76,452 10,730 493 4,270 77 314 117,418 133,590 17 248,642 204,767 6,682 519 14,156 100 321 21,585 43,875 Percent Total of % Non-Hispanic % Non-Hispanic % Non-Hispanic % Non-Hispanic % Non-Hispanic % Non-Hispanic DISTRICT Voting Age Population White Alone Black Combo Native American Asian Combo Pacific Islander Some Other Race Hispanic Non-White 1 99.58% 24.22% 59.93% 0.20% 2.22% 0.03% 0.14% 12.83% 75.78% 2 99.49% 25.03% 58.95% 0.22% 7.99% 0.03% 0.15% 7.11% 74.97% 3 99.32% 28.95% 60.00% 0.22% 6.32% 0.03% 0.17% 3.63% 71.04% 4 99.44% 13.70% 70.53% 0.22% 0.34% 0.02% 0.11% 14.52% 86.30% 5 99.48% 15.71% 71.73% 0.22% 0.62% 0.02% 0.10% 11.08% 84.29% 6 99.66% 57.26% 30.80% 0.25% 2.09% 0.06% 0.15% 9.04% 42.74% 7 99.89% 10.70% 8.62% 0.15% 2.94% 0.02% 0.13% 77.33% 89.30% 8 99.76% 28.46% 5.22% 0.28% 3.97% 0.05% 0.25% 61.53% 71.54% 9 99.74% 78.29% 1.64% 0.21% 8.52% 0.04% 0.14% 10.90% 21.71% 10 99.50% 66.48% 9.02% 0.38% 11.54% 0.07% 0.23% 11.79% 33.52% 11 99.83% 55.01% 11.83% 0.26% 6.54% 0.03% 0.12% 26.03% 44.99% 12 99.65% 67.89% 3.38% 0.34% 8.95% 0.07% 0.24% 18.80% 32.11% 13 99.38% 62.33% 11.22% 0.25% 15.80% 0.06% 0.29% 9.42% 37.67% 14 99.81% 75.96% 1.67% 0.17% 10.63% 0.04% 0.12% 11.21% 24.04% 15 99.51% 64.29% 3.37% 0.21% 15.15% 0.04% 0.14% 16.31% 35.71% 16 99.86% 36.40% 5.11% 0.23% 2.03% 0.04% 0.15% 55.90% 63.60% 17 99.79% 82.35% 2.69% 0.21% 5.69% 0.04% 0.13% 8.68% 17.65%