SlideShare una empresa de Scribd logo
1 de 7
Descargar para leer sin conexión
u p dat e
to

Hui Aloha O Kiholo
By: Henrieta Dulaiova and Christine A. Waters (University of Hawaii at Manoa and Hawaii EPSCoR)
(808) 956-0720 | hdulaiov@hawaii.edu

Research Questions
Hawaii’s coastal aquifers and environments
play a fundamental role in the state’s history,
economy, and culture. The need to maintain
the appeal and general health of Hawaii’s
coasts has been recognized and was
addressed with the creation of watershed
partnerships and the continuation of
traditional land divisions (ahupua’a). This
study will provide a necessary baseline
for how groundwater aquifers on these
traditional lands contribute to Hawaii’s
coastal ecosystems.

1.	 What volume of groundwater discharges to Kiholo
Bay, what is its composition, and how does it change
over time?
2.	 What amount of nutrients does submarine
groundwater discharge (SGD) deliver to the coast?
3.	 How long does it take for the currents to flush the
groundwater-derived nutrients from the nearshore
region?
4.	 How important are groundwater-derived nutrients
for coastal ocean productivity, i.e. growth of algae,
plankton, et cetera?

the many seasons of sgd
The Kona coast on leeward Hawaii is one of the
driest places in the Hawaiian Island chain, and it
is a place where streams only rarely reach to the
sea. Yet, groundwater from rain falling high on
the mountainsides of the Hualalai, Mauna Kea,
and Mauna Loa provides tremendous amounts
of water to the coastal ocean, fed through the
subterranean aquifers (Figure 1). Because groundwater in coastal aquifers is slightly brackish, we have to rely on tracers
other than salinity to identify and quantify SGD. We use radon, a natural radioactive isotope that is present as the daughter
product of uranium in the groundwater aquifers. Elevated coastal ocean radon levels reveal locations of groundwater
discharge and allow us to quantify rates of SGD flow.
Our team used radon as a geochemical tracer of groundwater
at Kiholo Bay in order to calculate the amount of groundwater
discharged into the sea during different seasons. You may
have noticed our dinghy anchored for 2-3 days at a time,
housing measuring apparatuses, during our several trips to
this location. Radon is produced naturally in the groundwater
aquifer and accumulates in it. It is also radioactive, so we may
rely on its decay (~3.8 days) to assure us that the groundwater
we measure is newly discharged to the coast.

Kiholo Bay

Figure 1. Cross-section showing a simplified island aquifer
(modified from Johnson, 2008).

Using this tool, in addition to salinity and temperature, we
calculated total groundwater discharges at three identified groundwater outlets in Kiholo Bay (Figure 2) . The purpose for
sampling twice a year was to see if there was a distinction between discharge dynamics and chemistry between wet and
dry seasons. As you can see in Figure 3, total groundwater discharge was the greatest at the head of the inlet, amounting on
average to about 4,000 m3/d (as measured in June 2010). The error bars on the figure illustrate the large range of measured
discharge over a 3-day period.

Page 1
This range is expected, as groundwater discharge is modulated by tides.
During high tide, the ocean level is higher and the hydraulic gradient,
the difference between groundwater level and ocean level, is smaller than
at low tide. The larger the hydraulic gradient, the more groundwater
can flow out of the coastal aquifer. During dry summer months,
groundwater discharge at the mouth of the inlet and on the southwest
corner of the bay (~2,000 - 2,200 m3/d) was less than in measurement
periods during/following winter months (~2,400 - 3,000 m3/d).

THE SUBSURFACE STRUCTURE OF
THE COASTLINE
We used a physical technique called electrical resistivity sensing of the
subsurface aquifer to study the groundwater conduits. We imaged the
below ground composition of the coastal aquifer along the southwest
side of Kiholo Bay and found that, here, brackish groundwater of salinity
about 5, discharged through isolated conduits in rocks such as lava tubes.
We also showed (Figure 3) that, at low tide, the coastal aquifer is more
dominated by brackish groundwater (red areas representing high resistivity
regions, because freshwater is less conductive than seawater) than at
high tide when seawater inundates the coastal aquifer and the freshwater
recedes landward. This confirms our findings using the radon tracer that
showed higher groundwater discharge at low tide as described above. Figure 2. Total groundwater discharge at the
Figure 3. Electrical resistivity sensing images of the
subsurface aquifer at the black pebble shoreline of Kiholo
Bay. At low tide, the subsurface coastline is dominated by
red areas of higher resistivity freshwater than during high
tide.

Higher High Tide

Lower Low Tide

Page 2

inlet head and mouth and at a coastal site on
the southwest side of Kiholo Bay.
Is there spatial Variability to sgd at kiholo
bay?
We measured radon concentration in the coastal ocean along the coastline in order to identify groundwater discharge
sites. Figure 4 shows surveys for radon and salinity along the coastline. Higher radon (red, yellow, and green circles)
with salinities below ambient marine salinity (< 36.0, shown as light blue in the blue-gradient swathes) indicate locations
of SGD. These occurred during all excursions, regardless of season, at the head of the inlet and from basalts along the
middle, eastward side of the inlet. There is groundwater discharging along the pebble beach and from the southwest
corner of the bay, which is discernible by the slightly elevated radon levels and lowered salinity in the middle bay area.
These are consistent with findings from previous studies using thermal infrared imaging (Johnson et al., 2008). Possible
groundwater outlets unnoticed in previous studies were discovered in September’s lengthier shoreline survey (box
C) along the western coast, possibly flowing through natural conduits in basalts just outside Kiholo Bay. There were
significantly elevated levels of radon measured in surface waters during the month of March 2011 (box D), corresponding
These measurements were done
to increased groundwater fluxes during this period.
A
B
C
one week after the Japan tsunami,
which inundated the land and
forced seawater to infiltrate
the into the coastal aquifer.
We believe the elevated coastal
groundwater discharge was due
to this inundation. Because our
measurements only lasted 2 days,
D
E
we were unable to determine the length of time required for
the aquifer and the lagoon to get back to their natural state.
Figure 4. From upper left to lower right: Groundwater surveys
conducted on A) June 23 and B) June 25, 2010, C) September
29, 2010, D) March 24, 2011, and E) March 29, 2012. Hot
colors (reds, yellows, and oranges) show areas of higher
radon concentrations (associated with greater groundwater
discharge). Light blue swathes indicate fresher salinities.

Nutrient Fluxes Originating
from Groundwater Discharge
Coastal groundwater is enriched in nutrients in comparison to ocean nutrient
levels. It is therefore important to understand what role SGD has in delivering
nutrients to the coastline. An optimal range of nitrogen and phosphorus in
the coastal ocean is preferred, as these nutrients support algal and plankton
growth, supporting the bottom of the food web. Too many nutrients, on the
other hand, may cause overpopulation of algae, phytoplankton blooms of
undesired levels that potentially affect the coral reefs. The nutrient composition
of the groundwater has to be optimal, just the right ratio of nitrogen to
phosphorus for coastal plants. We therefore measured groundwater nutrient
concentrations and combined these with corresponding groundwater discharge
estimates (Figure 2). The calculated nutrient fluxes via groundwater discharge
are shown in Figure 5 (DIP: dissolved inorganic phosphorus, DIN: dissolved
Figure 5. Nutrient fluxes derived from groundwater fluxes at time
series (yellow stars in Figure 2) locations at Kiholo Bay. DIP: dissolved
inorganic phosphorus, DIN: dissolved inorganic nitrogen, DON:
dissolved organic nitrogen, and DOP: dissolved organic phosphorus.

Page 3
inorganic nitrogen, DON: dissolved organic nitrogen, and DOP: dissolved organic phosphorus). DIP ranged from
2.0-7.0 mol/d and DIN ranged from 38.4-170.3 mol/d. These graphs show that the largest fluxes of bioavailable
phosphorus and nitrogen are delivered by groundwater fluxes through the head and mouth of the lagoon during
the winter months (March and September). For comparison, nutrient fluxes in the less pristine Honokohau Harbor
are 182 mol/d and about 4,000 mol/d of bioavailable phosphorus and nitrogen, respectively (Holleman, 2011).

Where do we see possible areas of increased
primary productivity (i.e. plankton growth)?
Because phytoplankton are either the direct
or indirect food source for all marine animals,
knowledge of its population mass and growth can
inform us of the general state of an ecosystem.
We use chlorophyll-a (chl-a), the green pigment
essential for photosynthesis in algae and
phytoplankton, which was measured in the surface
waters, as our proxy for primary productivity. We
measured chl-a during three sampling excursions
which are shown in Figure 6 as grey circles (June 2010),
squares (March 2011), and triangles (October 2011),
with chl-a concentrations ranging from 0.1-0.7 µg/L.
Figure 6. Chl-a concentration measured in surface
water samples, shown with radon measured during
March 2011 survey (from Figure 2, box D) to
indicate groundwater discharge locations (in red).

The March 2011 samples (squares) had the highest overall average chl-a concentrations. The highest concentration
(0.7 µg/L in October 2011) was measured outside the lagoon in the open bay. Surprisingly, chl-a concentrations
at the head of the lagoon (where groundwater discharge occurs at large volume), were the smallest (0.1 µg/L). This
led us to investigate possible reasons for minimal uptake of groundwater-delivered nutrients directly at the source.
The graphs below, in Figure 7, show chl-a concentration (green fill) with time of day (x-axis) and tide (blue
fill). Sampling was conducted during low, low rising tide during every excursion. It is important to note
that chl-a concentrations vary with the availability of sunlight as the sun’s energy is needed for the plants to
perform photosynthesis. For comparison, mean chl-a concentration for the sampling excursion is shown
as the green dotted line and mean chl-a concentration of all samples is given by the straight black line.

Figure 7. Chlorophyll-a (chl-a) and mean chl-a concentration with tide at different times of the day. Chl-a concentration varies with
the availability of sunlight, temperature, and salinity of water.

Page 4
Figure 8 shows chl-a concentration with salinity, radon, and the time since groundwater entered the ocean, i.e.
the age of the nutrients assuming 0 age at the point of discharge. Our data suggest that cold temperatures and
low salinity of SGD plumes near their source are not favored by marine organisms, despite the abundance of
bioavailable nutrients. At the same time, older aged waters are warmer and have higher salinity because they mix
with ocean water. Yet, they still contain elevated nutrient levels in comparison to the ambient ocean concentration.
Thanks also to the longer presence of nutrients, these water masses exhibit higher primary productivity.

Figure 8. Chlorophyll-a (chl-a) concentration measured in surface water samples with salinity, radon, and plotted against the apparent
age of waters. Chl-a concentration increases with increasing salinity and age of waters. Also, March 2011 “tsunami” samples were
brackish samples that had atypically high chl-a concentration, possibly due to inundation of seawater into the groundwater aquifer.

Tying it all Together
Highest Chl-a
“Oldest” Water
8-12 Days Old
Lowest Chl-a
“Youngest” Water
0-2 Days Old

up to 2,400 m3/d

up to 8,000 m3/d

up to 6,500 m3/d

Figure 9. We found that as much as 11,000 m3/d of groundwater discharged to Kiholo Bay every day. Groundwater
is enriched in nutrients and among others, contributes nitrogen, phosphorus and silica to the coastal ocean. Our data
suggest that cold temperatures and low salinity of SGD plumes near their source are not favored by marine organisms,
despite the abundance of bioavailable nutrients. At the same time, older aged waters are warmer and have higher salinity
because they mix with ocean water. Thanks also to the longer presence of nutrients, these water masses exhibit higher
primary productivity.

Page 5
Continuing Work & the role of the sgd sniffer
Ongoing work includes analyzing data for salinity, nutrients, radon and temperature across the whole depth
of the water column in the bay and lagoon regions in order to get an idea of how the SGD plume changes/
does not change with seasons throughout the water column. These data will also provide us ideas about
benthic groundwater fluxes that do not have a prominent surface signature. Lastly, net primary productivity
will be better constrained by performing carbon uptake measurements along the SGD plumes in the bay.

Figure 10. Groundwater is naturally enriched in radon,
and elevated coastal radon levels (shown in units of
decay per minute per liter of seawater) reveal locations of
groundwater discharge. Thanks to the newly developed
SGD Sniffer (shown in the inset), we can now investigate
this long-term record of submarine groundwater
discharge to the coastal ocean to better understand landocean-climate interaction. The SGD Sniffer would be
best positioned at the location proposed on this image,
as that is one of the major SGD outcrops in the protected
lagoon. More details on the proposed deployment
can be found in the attached plan of operation.

The SGD Sniffer MISSION

Over several years, we have performed 2-3 day long measurements of coastal radon to calculate groundwater
discharge and coastal nutrient fluxes in different seasons. We created maps of the coastline indicating the
locations of focused groundwater outflow. We found that discharge is not uniform along the coastline but
occurs through well-defined conduits. We also found that groundwater fluxes across the land-ocean interface
vary significantly throughout the tidal cycle and also within and between wet and dry seasons.
An excellent example of the temperamental nature of the magnitude of these fluxes occurs near the mouth of
the inlet at Kiholo Bay (Figure 10). From June 2010 to March 2012 (five, 1-week periods), fluxes of groundwater
from the coast at this one location varied in magnitude from about 5,000 gallons per day, to more than one
million gallons per day. More-brackish discharges occurred just one week after the March 2011 tsunami brought
up to 11-foot high waves to Kona. Discharges from March 2011 also had a noticeable effect on nearshore
phytoplankton growth compared to previous sampling periods.
It is evident that one cannot take “snap-shot” measurements of SGD to adequately understand how groundwater
and its dissolved constituent fluxes respond to changes in climate and/or sea level change. To address this
problem, we designed a unique coastal radon detector, the SGD Sniffer, which is capable of self-sustained longterm high-frequency monitoring of SGD. This is a first of its kind continuous radon monitor that will allow us to
measure groundwater fluxes to the ocean over durations of months and years. The newly developed SGD Sniffer
will provide continuous data on submarine groundwater discharge and will make it possible to investigate the
mechanisms of long-term trends in SGD and its impact on coastal ecosystems. Thanks to this methodological
advance, we can, for the first time, investigate long-term trends in SGD within the larger context of our rapidly
expanding awareness and knowledge about climate change, sea-level rise and watershed processes. At the same
time, we will be able to couple how land-ocean water fluxes change in magnitude and chemistry in response to
local environmental and anthropogenic stressors. All data from the SGD Sniffer will be available to members of
the Kiholo Community through a public data portal: PacIOOS.org.
Page 6
For More Information, Please Contact:
Henrieta Dulaiova and Craig Glenn: (808) 956-0720 | hdulaiov@hawaii.edu
University of Hawaii at Manoa
Marine Geology
1680 East-West Road POST 701
Honolulu, HI 96822

™

And
View Our Team At:

www.epscor.hawaii.edu/ender

Page 7

Más contenido relacionado

La actualidad más candente

0c9605211e66c2f5be000000
0c9605211e66c2f5be0000000c9605211e66c2f5be000000
0c9605211e66c2f5be000000Thomas Saunders
 
AdamGerughtycapstonerevised
AdamGerughtycapstonerevisedAdamGerughtycapstonerevised
AdamGerughtycapstonerevisedAdam Gerughty
 
1-s2.0-S0022169415003698-main
1-s2.0-S0022169415003698-main1-s2.0-S0022169415003698-main
1-s2.0-S0022169415003698-mainMaria Blumstock
 
Offshore fresh groundwater reserves as a global phenomenon
Offshore fresh groundwater reserves as a global phenomenonOffshore fresh groundwater reserves as a global phenomenon
Offshore fresh groundwater reserves as a global phenomenonCarlos Bella
 
Pertemuan 05 upwelling
Pertemuan 05 upwellingPertemuan 05 upwelling
Pertemuan 05 upwellingEko Efendi
 
Ecology of the east african lakes for unfccc adaptation
Ecology of the east african lakes for unfccc adaptationEcology of the east african lakes for unfccc adaptation
Ecology of the east african lakes for unfccc adaptationNAP Events
 
Impact of Climate Change on Groundwater System
Impact of Climate Change on Groundwater SystemImpact of Climate Change on Groundwater System
Impact of Climate Change on Groundwater SystemC. P. Kumar
 
Global Warming Effect Groundwater Proposal
Global Warming Effect Groundwater ProposalGlobal Warming Effect Groundwater Proposal
Global Warming Effect Groundwater Proposalmahfoodhshuely
 
Physical Forcing Mechanisms Controlling the Variability of Chlorophyll-a over...
Physical Forcing Mechanisms Controlling the Variability of Chlorophyll-a over...Physical Forcing Mechanisms Controlling the Variability of Chlorophyll-a over...
Physical Forcing Mechanisms Controlling the Variability of Chlorophyll-a over...Da Silva Meyre
 
Saby et al., 2016
Saby et al., 2016Saby et al., 2016
Saby et al., 2016Marion Saby
 

La actualidad más candente (15)

0c9605211e66c2f5be000000
0c9605211e66c2f5be0000000c9605211e66c2f5be000000
0c9605211e66c2f5be000000
 
Caballero-Alfonso et al. 2015
Caballero-Alfonso et al. 2015Caballero-Alfonso et al. 2015
Caballero-Alfonso et al. 2015
 
AdamGerughtycapstonerevised
AdamGerughtycapstonerevisedAdamGerughtycapstonerevised
AdamGerughtycapstonerevised
 
1-s2.0-S0022169415003698-main
1-s2.0-S0022169415003698-main1-s2.0-S0022169415003698-main
1-s2.0-S0022169415003698-main
 
Offshore fresh groundwater reserves as a global phenomenon
Offshore fresh groundwater reserves as a global phenomenonOffshore fresh groundwater reserves as a global phenomenon
Offshore fresh groundwater reserves as a global phenomenon
 
Pertemuan 05 upwelling
Pertemuan 05 upwellingPertemuan 05 upwelling
Pertemuan 05 upwelling
 
Aquatic ecosystems freshwater
Aquatic ecosystems  freshwaterAquatic ecosystems  freshwater
Aquatic ecosystems freshwater
 
Ecology of the east african lakes for unfccc adaptation
Ecology of the east african lakes for unfccc adaptationEcology of the east african lakes for unfccc adaptation
Ecology of the east african lakes for unfccc adaptation
 
Junk&wantzen 1989 update_new flood pulse
Junk&wantzen 1989 update_new flood pulseJunk&wantzen 1989 update_new flood pulse
Junk&wantzen 1989 update_new flood pulse
 
Impact of Climate Change on Groundwater System
Impact of Climate Change on Groundwater SystemImpact of Climate Change on Groundwater System
Impact of Climate Change on Groundwater System
 
Global Warming Effect Groundwater Proposal
Global Warming Effect Groundwater ProposalGlobal Warming Effect Groundwater Proposal
Global Warming Effect Groundwater Proposal
 
Physical Forcing Mechanisms Controlling the Variability of Chlorophyll-a over...
Physical Forcing Mechanisms Controlling the Variability of Chlorophyll-a over...Physical Forcing Mechanisms Controlling the Variability of Chlorophyll-a over...
Physical Forcing Mechanisms Controlling the Variability of Chlorophyll-a over...
 
Saby et al., 2016
Saby et al., 2016Saby et al., 2016
Saby et al., 2016
 
River eco report
River  eco reportRiver  eco report
River eco report
 
Global Journal of Ecology
Global Journal of EcologyGlobal Journal of Ecology
Global Journal of Ecology
 

Destacado

Sex, Likes & Social Media leaflet
Sex, Likes & Social Media leafletSex, Likes & Social Media leaflet
Sex, Likes & Social Media leafletAllison Havey
 
about start up for you 13
about start up for you 13about start up for you 13
about start up for you 13aliaalistartup
 
Observaciones finales sobre el segundo informe periódico de honduras
Observaciones finales sobre el segundo informe periódico de hondurasObservaciones finales sobre el segundo informe periódico de honduras
Observaciones finales sobre el segundo informe periódico de hondurasMULTIMEDIA-RP
 
One point studio mazeget aug2012
One point studio mazeget aug2012One point studio mazeget aug2012
One point studio mazeget aug2012Assaf Leket
 
Presentacion de catedra - BIOLOGIA 2017
Presentacion de catedra - BIOLOGIA 2017Presentacion de catedra - BIOLOGIA 2017
Presentacion de catedra - BIOLOGIA 2017Franco Vazquez
 
Casual Games; A Strategic Review of the Sector
Casual Games; A Strategic Review of the SectorCasual Games; A Strategic Review of the Sector
Casual Games; A Strategic Review of the SectorPaul Heydon
 
GLOSARIO DE TERMINOS I - REDES INFORMATICAS DE COMUNICACION
GLOSARIO DE TERMINOS I - REDES INFORMATICAS DE COMUNICACION GLOSARIO DE TERMINOS I - REDES INFORMATICAS DE COMUNICACION
GLOSARIO DE TERMINOS I - REDES INFORMATICAS DE COMUNICACION Jason Ventosilla Gutierrez
 
CAMPAÑA RJM: MUJERES Y HOMBRES EN MOVIMIENTO POR LA DIGNIDAD
CAMPAÑA RJM: MUJERES Y HOMBRES EN MOVIMIENTO POR LA DIGNIDADCAMPAÑA RJM: MUJERES Y HOMBRES EN MOVIMIENTO POR LA DIGNIDAD
CAMPAÑA RJM: MUJERES Y HOMBRES EN MOVIMIENTO POR LA DIGNIDADMULTIMEDIA-RP
 
Trimble R10 sales presentation
Trimble R10 sales presentationTrimble R10 sales presentation
Trimble R10 sales presentationgeoteamnir
 
Branded Games - The Dark Horse in Digital Advertising
Branded Games - The Dark Horse in Digital AdvertisingBranded Games - The Dark Horse in Digital Advertising
Branded Games - The Dark Horse in Digital AdvertisingBen Chong
 
Literatura e compreensão textual ENEM Professor João Giliarde
Literatura e compreensão textual ENEM  Professor João GiliardeLiteratura e compreensão textual ENEM  Professor João Giliarde
Literatura e compreensão textual ENEM Professor João GiliardeGiliarde Rodrigues
 
Hotel Casa Monte Ruesga
Hotel Casa Monte RuesgaHotel Casa Monte Ruesga
Hotel Casa Monte RuesgaDaniela Ruesga
 

Destacado (17)

YALI_Certificate
YALI_CertificateYALI_Certificate
YALI_Certificate
 
Sex, Likes & Social Media leaflet
Sex, Likes & Social Media leafletSex, Likes & Social Media leaflet
Sex, Likes & Social Media leaflet
 
about start up for you 13
about start up for you 13about start up for you 13
about start up for you 13
 
Observaciones finales sobre el segundo informe periódico de honduras
Observaciones finales sobre el segundo informe periódico de hondurasObservaciones finales sobre el segundo informe periódico de honduras
Observaciones finales sobre el segundo informe periódico de honduras
 
One point studio mazeget aug2012
One point studio mazeget aug2012One point studio mazeget aug2012
One point studio mazeget aug2012
 
Portfolio
PortfolioPortfolio
Portfolio
 
Presentacion de catedra - BIOLOGIA 2017
Presentacion de catedra - BIOLOGIA 2017Presentacion de catedra - BIOLOGIA 2017
Presentacion de catedra - BIOLOGIA 2017
 
Glosario de terminos de redes
Glosario de terminos de redesGlosario de terminos de redes
Glosario de terminos de redes
 
William Fierman - Clips
William Fierman - ClipsWilliam Fierman - Clips
William Fierman - Clips
 
Casual Games; A Strategic Review of the Sector
Casual Games; A Strategic Review of the SectorCasual Games; A Strategic Review of the Sector
Casual Games; A Strategic Review of the Sector
 
Pom ppt.
Pom ppt.Pom ppt.
Pom ppt.
 
GLOSARIO DE TERMINOS I - REDES INFORMATICAS DE COMUNICACION
GLOSARIO DE TERMINOS I - REDES INFORMATICAS DE COMUNICACION GLOSARIO DE TERMINOS I - REDES INFORMATICAS DE COMUNICACION
GLOSARIO DE TERMINOS I - REDES INFORMATICAS DE COMUNICACION
 
CAMPAÑA RJM: MUJERES Y HOMBRES EN MOVIMIENTO POR LA DIGNIDAD
CAMPAÑA RJM: MUJERES Y HOMBRES EN MOVIMIENTO POR LA DIGNIDADCAMPAÑA RJM: MUJERES Y HOMBRES EN MOVIMIENTO POR LA DIGNIDAD
CAMPAÑA RJM: MUJERES Y HOMBRES EN MOVIMIENTO POR LA DIGNIDAD
 
Trimble R10 sales presentation
Trimble R10 sales presentationTrimble R10 sales presentation
Trimble R10 sales presentation
 
Branded Games - The Dark Horse in Digital Advertising
Branded Games - The Dark Horse in Digital AdvertisingBranded Games - The Dark Horse in Digital Advertising
Branded Games - The Dark Horse in Digital Advertising
 
Literatura e compreensão textual ENEM Professor João Giliarde
Literatura e compreensão textual ENEM  Professor João GiliardeLiteratura e compreensão textual ENEM  Professor João Giliarde
Literatura e compreensão textual ENEM Professor João Giliarde
 
Hotel Casa Monte Ruesga
Hotel Casa Monte RuesgaHotel Casa Monte Ruesga
Hotel Casa Monte Ruesga
 

Similar a Understanding Coastal Aquifers and their Role in Nutrient Delivery

Interrelationship between nutrients and chlorophyll-a in an urban stormwater ...
Interrelationship between nutrients and chlorophyll-a in an urban stormwater ...Interrelationship between nutrients and chlorophyll-a in an urban stormwater ...
Interrelationship between nutrients and chlorophyll-a in an urban stormwater ...Journal of Contemporary Urban Affairs
 
JEMA article Relationship between nitrogen concentration, light, and Z.marina...
JEMA article Relationship between nitrogen concentration, light, and Z.marina...JEMA article Relationship between nitrogen concentration, light, and Z.marina...
JEMA article Relationship between nitrogen concentration, light, and Z.marina...Jen Benson
 
Gulf.report.dec.01.2010
Gulf.report.dec.01.2010Gulf.report.dec.01.2010
Gulf.report.dec.01.2010John Hutchison
 
Gulf.report.dec.01.2010
Gulf.report.dec.01.2010Gulf.report.dec.01.2010
Gulf.report.dec.01.2010John Hutchison
 
Gulf.report.dec.01.2010
Gulf.report.dec.01.2010Gulf.report.dec.01.2010
Gulf.report.dec.01.2010John Hutchison
 
Origin of water salinity in Annaba aquifer system, North-Eastern Algeria | JBES
Origin of water salinity in Annaba aquifer system, North-Eastern Algeria | JBESOrigin of water salinity in Annaba aquifer system, North-Eastern Algeria | JBES
Origin of water salinity in Annaba aquifer system, North-Eastern Algeria | JBESInnspub Net
 
Hernández-Terrones et al. (2010) Groundwater pollution in a karstic region (...
Hernández-Terrones et al. (2010) Groundwater pollution in a karstic region (...Hernández-Terrones et al. (2010) Groundwater pollution in a karstic region (...
Hernández-Terrones et al. (2010) Groundwater pollution in a karstic region (...Emiliano Monroy Ríos
 
2k21ene10 Eutrophication.pptx
2k21ene10 Eutrophication.pptx2k21ene10 Eutrophication.pptx
2k21ene10 Eutrophication.pptxAJAYMALIK97
 
Assessment of the Water Quality of Lake Sidi Boughaba (Ramsar Site 1980) Keni...
Assessment of the Water Quality of Lake Sidi Boughaba (Ramsar Site 1980) Keni...Assessment of the Water Quality of Lake Sidi Boughaba (Ramsar Site 1980) Keni...
Assessment of the Water Quality of Lake Sidi Boughaba (Ramsar Site 1980) Keni...journal ijrtem
 
Assessment of the Water Quality of Lake Sidi Boughaba (Ramsar Site 1980) Keni...
Assessment of the Water Quality of Lake Sidi Boughaba (Ramsar Site 1980) Keni...Assessment of the Water Quality of Lake Sidi Boughaba (Ramsar Site 1980) Keni...
Assessment of the Water Quality of Lake Sidi Boughaba (Ramsar Site 1980) Keni...IJRTEMJOURNAL
 
Lake Tahoe Water Clarity Project
Lake Tahoe Water Clarity ProjectLake Tahoe Water Clarity Project
Lake Tahoe Water Clarity ProjectChristine Stontz
 
s12932-017-0042-3 (1).pdf
s12932-017-0042-3 (1).pdfs12932-017-0042-3 (1).pdf
s12932-017-0042-3 (1).pdfMelanyEthereal
 
Factors influencing distribution of nutrition elements in sea
Factors influencing distribution of nutrition elements in seaFactors influencing distribution of nutrition elements in sea
Factors influencing distribution of nutrition elements in seaNazmul Ahmed Oli
 
Physical Forcing Mechanisms Controlling the Variability of Chlorophyll-a over...
Physical Forcing Mechanisms Controlling the Variability of Chlorophyll-a over...Physical Forcing Mechanisms Controlling the Variability of Chlorophyll-a over...
Physical Forcing Mechanisms Controlling the Variability of Chlorophyll-a over...Meyre Da Silva
 
Hydrosphere Presentation
Hydrosphere PresentationHydrosphere Presentation
Hydrosphere Presentation090966
 
Hydrosphere Presentation
Hydrosphere PresentationHydrosphere Presentation
Hydrosphere Presentation090966
 

Similar a Understanding Coastal Aquifers and their Role in Nutrient Delivery (20)

Leporacci_Nicole_Poster
Leporacci_Nicole_PosterLeporacci_Nicole_Poster
Leporacci_Nicole_Poster
 
Interrelationship between nutrients and chlorophyll-a in an urban stormwater ...
Interrelationship between nutrients and chlorophyll-a in an urban stormwater ...Interrelationship between nutrients and chlorophyll-a in an urban stormwater ...
Interrelationship between nutrients and chlorophyll-a in an urban stormwater ...
 
JEMA article Relationship between nitrogen concentration, light, and Z.marina...
JEMA article Relationship between nitrogen concentration, light, and Z.marina...JEMA article Relationship between nitrogen concentration, light, and Z.marina...
JEMA article Relationship between nitrogen concentration, light, and Z.marina...
 
Gulf.report.dec.01.2010
Gulf.report.dec.01.2010Gulf.report.dec.01.2010
Gulf.report.dec.01.2010
 
Gulf.report.dec.01.2010
Gulf.report.dec.01.2010Gulf.report.dec.01.2010
Gulf.report.dec.01.2010
 
Gulf.report.dec.01.2010
Gulf.report.dec.01.2010Gulf.report.dec.01.2010
Gulf.report.dec.01.2010
 
Great ocean conveyor
Great ocean conveyor Great ocean conveyor
Great ocean conveyor
 
Origin of water salinity in Annaba aquifer system, North-Eastern Algeria | JBES
Origin of water salinity in Annaba aquifer system, North-Eastern Algeria | JBESOrigin of water salinity in Annaba aquifer system, North-Eastern Algeria | JBES
Origin of water salinity in Annaba aquifer system, North-Eastern Algeria | JBES
 
Project environment
Project environmentProject environment
Project environment
 
Hernández-Terrones et al. (2010) Groundwater pollution in a karstic region (...
Hernández-Terrones et al. (2010) Groundwater pollution in a karstic region (...Hernández-Terrones et al. (2010) Groundwater pollution in a karstic region (...
Hernández-Terrones et al. (2010) Groundwater pollution in a karstic region (...
 
2k21ene10 Eutrophication.pptx
2k21ene10 Eutrophication.pptx2k21ene10 Eutrophication.pptx
2k21ene10 Eutrophication.pptx
 
Assessment of the Water Quality of Lake Sidi Boughaba (Ramsar Site 1980) Keni...
Assessment of the Water Quality of Lake Sidi Boughaba (Ramsar Site 1980) Keni...Assessment of the Water Quality of Lake Sidi Boughaba (Ramsar Site 1980) Keni...
Assessment of the Water Quality of Lake Sidi Boughaba (Ramsar Site 1980) Keni...
 
Assessment of the Water Quality of Lake Sidi Boughaba (Ramsar Site 1980) Keni...
Assessment of the Water Quality of Lake Sidi Boughaba (Ramsar Site 1980) Keni...Assessment of the Water Quality of Lake Sidi Boughaba (Ramsar Site 1980) Keni...
Assessment of the Water Quality of Lake Sidi Boughaba (Ramsar Site 1980) Keni...
 
Lake Tahoe Water Clarity Project
Lake Tahoe Water Clarity ProjectLake Tahoe Water Clarity Project
Lake Tahoe Water Clarity Project
 
s12932-017-0042-3 (1).pdf
s12932-017-0042-3 (1).pdfs12932-017-0042-3 (1).pdf
s12932-017-0042-3 (1).pdf
 
Factors influencing distribution of nutrition elements in sea
Factors influencing distribution of nutrition elements in seaFactors influencing distribution of nutrition elements in sea
Factors influencing distribution of nutrition elements in sea
 
Physical Forcing Mechanisms Controlling the Variability of Chlorophyll-a over...
Physical Forcing Mechanisms Controlling the Variability of Chlorophyll-a over...Physical Forcing Mechanisms Controlling the Variability of Chlorophyll-a over...
Physical Forcing Mechanisms Controlling the Variability of Chlorophyll-a over...
 
Hydrosphere Presentation
Hydrosphere PresentationHydrosphere Presentation
Hydrosphere Presentation
 
Hydrosphere Presentation
Hydrosphere PresentationHydrosphere Presentation
Hydrosphere Presentation
 
Althouse et al. 2014
Althouse et al. 2014Althouse et al. 2014
Althouse et al. 2014
 

Último

A Critique of the Proposed National Education Policy Reform
A Critique of the Proposed National Education Policy ReformA Critique of the Proposed National Education Policy Reform
A Critique of the Proposed National Education Policy ReformChameera Dedduwage
 
The byproduct of sericulture in different industries.pptx
The byproduct of sericulture in different industries.pptxThe byproduct of sericulture in different industries.pptx
The byproduct of sericulture in different industries.pptxShobhayan Kirtania
 
BASLIQ CURRENT LOOKBOOK LOOKBOOK(1) (1).pdf
BASLIQ CURRENT LOOKBOOK  LOOKBOOK(1) (1).pdfBASLIQ CURRENT LOOKBOOK  LOOKBOOK(1) (1).pdf
BASLIQ CURRENT LOOKBOOK LOOKBOOK(1) (1).pdfSoniaTolstoy
 
Software Engineering Methodologies (overview)
Software Engineering Methodologies (overview)Software Engineering Methodologies (overview)
Software Engineering Methodologies (overview)eniolaolutunde
 
microwave assisted reaction. General introduction
microwave assisted reaction. General introductionmicrowave assisted reaction. General introduction
microwave assisted reaction. General introductionMaksud Ahmed
 
Web & Social Media Analytics Previous Year Question Paper.pdf
Web & Social Media Analytics Previous Year Question Paper.pdfWeb & Social Media Analytics Previous Year Question Paper.pdf
Web & Social Media Analytics Previous Year Question Paper.pdfJayanti Pande
 
JAPAN: ORGANISATION OF PMDA, PHARMACEUTICAL LAWS & REGULATIONS, TYPES OF REGI...
JAPAN: ORGANISATION OF PMDA, PHARMACEUTICAL LAWS & REGULATIONS, TYPES OF REGI...JAPAN: ORGANISATION OF PMDA, PHARMACEUTICAL LAWS & REGULATIONS, TYPES OF REGI...
JAPAN: ORGANISATION OF PMDA, PHARMACEUTICAL LAWS & REGULATIONS, TYPES OF REGI...anjaliyadav012327
 
Measures of Dispersion and Variability: Range, QD, AD and SD
Measures of Dispersion and Variability: Range, QD, AD and SDMeasures of Dispersion and Variability: Range, QD, AD and SD
Measures of Dispersion and Variability: Range, QD, AD and SDThiyagu K
 
1029-Danh muc Sach Giao Khoa khoi 6.pdf
1029-Danh muc Sach Giao Khoa khoi  6.pdf1029-Danh muc Sach Giao Khoa khoi  6.pdf
1029-Danh muc Sach Giao Khoa khoi 6.pdfQucHHunhnh
 
Nutritional Needs Presentation - HLTH 104
Nutritional Needs Presentation - HLTH 104Nutritional Needs Presentation - HLTH 104
Nutritional Needs Presentation - HLTH 104misteraugie
 
Introduction to Nonprofit Accounting: The Basics
Introduction to Nonprofit Accounting: The BasicsIntroduction to Nonprofit Accounting: The Basics
Introduction to Nonprofit Accounting: The BasicsTechSoup
 
Sports & Fitness Value Added Course FY..
Sports & Fitness Value Added Course FY..Sports & Fitness Value Added Course FY..
Sports & Fitness Value Added Course FY..Disha Kariya
 
Grant Readiness 101 TechSoup and Remy Consulting
Grant Readiness 101 TechSoup and Remy ConsultingGrant Readiness 101 TechSoup and Remy Consulting
Grant Readiness 101 TechSoup and Remy ConsultingTechSoup
 
Paris 2024 Olympic Geographies - an activity
Paris 2024 Olympic Geographies - an activityParis 2024 Olympic Geographies - an activity
Paris 2024 Olympic Geographies - an activityGeoBlogs
 
The basics of sentences session 2pptx copy.pptx
The basics of sentences session 2pptx copy.pptxThe basics of sentences session 2pptx copy.pptx
The basics of sentences session 2pptx copy.pptxheathfieldcps1
 
Interactive Powerpoint_How to Master effective communication
Interactive Powerpoint_How to Master effective communicationInteractive Powerpoint_How to Master effective communication
Interactive Powerpoint_How to Master effective communicationnomboosow
 
Q4-W6-Restating Informational Text Grade 3
Q4-W6-Restating Informational Text Grade 3Q4-W6-Restating Informational Text Grade 3
Q4-W6-Restating Informational Text Grade 3JemimahLaneBuaron
 
Z Score,T Score, Percential Rank and Box Plot Graph
Z Score,T Score, Percential Rank and Box Plot GraphZ Score,T Score, Percential Rank and Box Plot Graph
Z Score,T Score, Percential Rank and Box Plot GraphThiyagu K
 
9548086042 for call girls in Indira Nagar with room service
9548086042  for call girls in Indira Nagar  with room service9548086042  for call girls in Indira Nagar  with room service
9548086042 for call girls in Indira Nagar with room servicediscovermytutordmt
 

Último (20)

A Critique of the Proposed National Education Policy Reform
A Critique of the Proposed National Education Policy ReformA Critique of the Proposed National Education Policy Reform
A Critique of the Proposed National Education Policy Reform
 
The byproduct of sericulture in different industries.pptx
The byproduct of sericulture in different industries.pptxThe byproduct of sericulture in different industries.pptx
The byproduct of sericulture in different industries.pptx
 
BASLIQ CURRENT LOOKBOOK LOOKBOOK(1) (1).pdf
BASLIQ CURRENT LOOKBOOK  LOOKBOOK(1) (1).pdfBASLIQ CURRENT LOOKBOOK  LOOKBOOK(1) (1).pdf
BASLIQ CURRENT LOOKBOOK LOOKBOOK(1) (1).pdf
 
Software Engineering Methodologies (overview)
Software Engineering Methodologies (overview)Software Engineering Methodologies (overview)
Software Engineering Methodologies (overview)
 
microwave assisted reaction. General introduction
microwave assisted reaction. General introductionmicrowave assisted reaction. General introduction
microwave assisted reaction. General introduction
 
Web & Social Media Analytics Previous Year Question Paper.pdf
Web & Social Media Analytics Previous Year Question Paper.pdfWeb & Social Media Analytics Previous Year Question Paper.pdf
Web & Social Media Analytics Previous Year Question Paper.pdf
 
JAPAN: ORGANISATION OF PMDA, PHARMACEUTICAL LAWS & REGULATIONS, TYPES OF REGI...
JAPAN: ORGANISATION OF PMDA, PHARMACEUTICAL LAWS & REGULATIONS, TYPES OF REGI...JAPAN: ORGANISATION OF PMDA, PHARMACEUTICAL LAWS & REGULATIONS, TYPES OF REGI...
JAPAN: ORGANISATION OF PMDA, PHARMACEUTICAL LAWS & REGULATIONS, TYPES OF REGI...
 
Measures of Dispersion and Variability: Range, QD, AD and SD
Measures of Dispersion and Variability: Range, QD, AD and SDMeasures of Dispersion and Variability: Range, QD, AD and SD
Measures of Dispersion and Variability: Range, QD, AD and SD
 
1029-Danh muc Sach Giao Khoa khoi 6.pdf
1029-Danh muc Sach Giao Khoa khoi  6.pdf1029-Danh muc Sach Giao Khoa khoi  6.pdf
1029-Danh muc Sach Giao Khoa khoi 6.pdf
 
Nutritional Needs Presentation - HLTH 104
Nutritional Needs Presentation - HLTH 104Nutritional Needs Presentation - HLTH 104
Nutritional Needs Presentation - HLTH 104
 
Introduction to Nonprofit Accounting: The Basics
Introduction to Nonprofit Accounting: The BasicsIntroduction to Nonprofit Accounting: The Basics
Introduction to Nonprofit Accounting: The Basics
 
Sports & Fitness Value Added Course FY..
Sports & Fitness Value Added Course FY..Sports & Fitness Value Added Course FY..
Sports & Fitness Value Added Course FY..
 
Grant Readiness 101 TechSoup and Remy Consulting
Grant Readiness 101 TechSoup and Remy ConsultingGrant Readiness 101 TechSoup and Remy Consulting
Grant Readiness 101 TechSoup and Remy Consulting
 
Paris 2024 Olympic Geographies - an activity
Paris 2024 Olympic Geographies - an activityParis 2024 Olympic Geographies - an activity
Paris 2024 Olympic Geographies - an activity
 
The basics of sentences session 2pptx copy.pptx
The basics of sentences session 2pptx copy.pptxThe basics of sentences session 2pptx copy.pptx
The basics of sentences session 2pptx copy.pptx
 
Interactive Powerpoint_How to Master effective communication
Interactive Powerpoint_How to Master effective communicationInteractive Powerpoint_How to Master effective communication
Interactive Powerpoint_How to Master effective communication
 
Q4-W6-Restating Informational Text Grade 3
Q4-W6-Restating Informational Text Grade 3Q4-W6-Restating Informational Text Grade 3
Q4-W6-Restating Informational Text Grade 3
 
Z Score,T Score, Percential Rank and Box Plot Graph
Z Score,T Score, Percential Rank and Box Plot GraphZ Score,T Score, Percential Rank and Box Plot Graph
Z Score,T Score, Percential Rank and Box Plot Graph
 
9548086042 for call girls in Indira Nagar with room service
9548086042  for call girls in Indira Nagar  with room service9548086042  for call girls in Indira Nagar  with room service
9548086042 for call girls in Indira Nagar with room service
 
INDIA QUIZ 2024 RLAC DELHI UNIVERSITY.pptx
INDIA QUIZ 2024 RLAC DELHI UNIVERSITY.pptxINDIA QUIZ 2024 RLAC DELHI UNIVERSITY.pptx
INDIA QUIZ 2024 RLAC DELHI UNIVERSITY.pptx
 

Understanding Coastal Aquifers and their Role in Nutrient Delivery

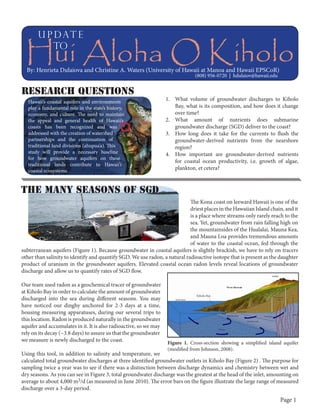
  • 1. u p dat e to Hui Aloha O Kiholo By: Henrieta Dulaiova and Christine A. Waters (University of Hawaii at Manoa and Hawaii EPSCoR) (808) 956-0720 | hdulaiov@hawaii.edu Research Questions Hawaii’s coastal aquifers and environments play a fundamental role in the state’s history, economy, and culture. The need to maintain the appeal and general health of Hawaii’s coasts has been recognized and was addressed with the creation of watershed partnerships and the continuation of traditional land divisions (ahupua’a). This study will provide a necessary baseline for how groundwater aquifers on these traditional lands contribute to Hawaii’s coastal ecosystems. 1. What volume of groundwater discharges to Kiholo Bay, what is its composition, and how does it change over time? 2. What amount of nutrients does submarine groundwater discharge (SGD) deliver to the coast? 3. How long does it take for the currents to flush the groundwater-derived nutrients from the nearshore region? 4. How important are groundwater-derived nutrients for coastal ocean productivity, i.e. growth of algae, plankton, et cetera? the many seasons of sgd The Kona coast on leeward Hawaii is one of the driest places in the Hawaiian Island chain, and it is a place where streams only rarely reach to the sea. Yet, groundwater from rain falling high on the mountainsides of the Hualalai, Mauna Kea, and Mauna Loa provides tremendous amounts of water to the coastal ocean, fed through the subterranean aquifers (Figure 1). Because groundwater in coastal aquifers is slightly brackish, we have to rely on tracers other than salinity to identify and quantify SGD. We use radon, a natural radioactive isotope that is present as the daughter product of uranium in the groundwater aquifers. Elevated coastal ocean radon levels reveal locations of groundwater discharge and allow us to quantify rates of SGD flow. Our team used radon as a geochemical tracer of groundwater at Kiholo Bay in order to calculate the amount of groundwater discharged into the sea during different seasons. You may have noticed our dinghy anchored for 2-3 days at a time, housing measuring apparatuses, during our several trips to this location. Radon is produced naturally in the groundwater aquifer and accumulates in it. It is also radioactive, so we may rely on its decay (~3.8 days) to assure us that the groundwater we measure is newly discharged to the coast. Kiholo Bay Figure 1. Cross-section showing a simplified island aquifer (modified from Johnson, 2008). Using this tool, in addition to salinity and temperature, we calculated total groundwater discharges at three identified groundwater outlets in Kiholo Bay (Figure 2) . The purpose for sampling twice a year was to see if there was a distinction between discharge dynamics and chemistry between wet and dry seasons. As you can see in Figure 3, total groundwater discharge was the greatest at the head of the inlet, amounting on average to about 4,000 m3/d (as measured in June 2010). The error bars on the figure illustrate the large range of measured discharge over a 3-day period. Page 1
  • 2. This range is expected, as groundwater discharge is modulated by tides. During high tide, the ocean level is higher and the hydraulic gradient, the difference between groundwater level and ocean level, is smaller than at low tide. The larger the hydraulic gradient, the more groundwater can flow out of the coastal aquifer. During dry summer months, groundwater discharge at the mouth of the inlet and on the southwest corner of the bay (~2,000 - 2,200 m3/d) was less than in measurement periods during/following winter months (~2,400 - 3,000 m3/d). THE SUBSURFACE STRUCTURE OF THE COASTLINE We used a physical technique called electrical resistivity sensing of the subsurface aquifer to study the groundwater conduits. We imaged the below ground composition of the coastal aquifer along the southwest side of Kiholo Bay and found that, here, brackish groundwater of salinity about 5, discharged through isolated conduits in rocks such as lava tubes. We also showed (Figure 3) that, at low tide, the coastal aquifer is more dominated by brackish groundwater (red areas representing high resistivity regions, because freshwater is less conductive than seawater) than at high tide when seawater inundates the coastal aquifer and the freshwater recedes landward. This confirms our findings using the radon tracer that showed higher groundwater discharge at low tide as described above. Figure 2. Total groundwater discharge at the Figure 3. Electrical resistivity sensing images of the subsurface aquifer at the black pebble shoreline of Kiholo Bay. At low tide, the subsurface coastline is dominated by red areas of higher resistivity freshwater than during high tide. Higher High Tide Lower Low Tide Page 2 inlet head and mouth and at a coastal site on the southwest side of Kiholo Bay.
  • 3. Is there spatial Variability to sgd at kiholo bay? We measured radon concentration in the coastal ocean along the coastline in order to identify groundwater discharge sites. Figure 4 shows surveys for radon and salinity along the coastline. Higher radon (red, yellow, and green circles) with salinities below ambient marine salinity (< 36.0, shown as light blue in the blue-gradient swathes) indicate locations of SGD. These occurred during all excursions, regardless of season, at the head of the inlet and from basalts along the middle, eastward side of the inlet. There is groundwater discharging along the pebble beach and from the southwest corner of the bay, which is discernible by the slightly elevated radon levels and lowered salinity in the middle bay area. These are consistent with findings from previous studies using thermal infrared imaging (Johnson et al., 2008). Possible groundwater outlets unnoticed in previous studies were discovered in September’s lengthier shoreline survey (box C) along the western coast, possibly flowing through natural conduits in basalts just outside Kiholo Bay. There were significantly elevated levels of radon measured in surface waters during the month of March 2011 (box D), corresponding These measurements were done to increased groundwater fluxes during this period. A B C one week after the Japan tsunami, which inundated the land and forced seawater to infiltrate the into the coastal aquifer. We believe the elevated coastal groundwater discharge was due to this inundation. Because our measurements only lasted 2 days, D E we were unable to determine the length of time required for the aquifer and the lagoon to get back to their natural state. Figure 4. From upper left to lower right: Groundwater surveys conducted on A) June 23 and B) June 25, 2010, C) September 29, 2010, D) March 24, 2011, and E) March 29, 2012. Hot colors (reds, yellows, and oranges) show areas of higher radon concentrations (associated with greater groundwater discharge). Light blue swathes indicate fresher salinities. Nutrient Fluxes Originating from Groundwater Discharge Coastal groundwater is enriched in nutrients in comparison to ocean nutrient levels. It is therefore important to understand what role SGD has in delivering nutrients to the coastline. An optimal range of nitrogen and phosphorus in the coastal ocean is preferred, as these nutrients support algal and plankton growth, supporting the bottom of the food web. Too many nutrients, on the other hand, may cause overpopulation of algae, phytoplankton blooms of undesired levels that potentially affect the coral reefs. The nutrient composition of the groundwater has to be optimal, just the right ratio of nitrogen to phosphorus for coastal plants. We therefore measured groundwater nutrient concentrations and combined these with corresponding groundwater discharge estimates (Figure 2). The calculated nutrient fluxes via groundwater discharge are shown in Figure 5 (DIP: dissolved inorganic phosphorus, DIN: dissolved Figure 5. Nutrient fluxes derived from groundwater fluxes at time series (yellow stars in Figure 2) locations at Kiholo Bay. DIP: dissolved inorganic phosphorus, DIN: dissolved inorganic nitrogen, DON: dissolved organic nitrogen, and DOP: dissolved organic phosphorus. Page 3
  • 4. inorganic nitrogen, DON: dissolved organic nitrogen, and DOP: dissolved organic phosphorus). DIP ranged from 2.0-7.0 mol/d and DIN ranged from 38.4-170.3 mol/d. These graphs show that the largest fluxes of bioavailable phosphorus and nitrogen are delivered by groundwater fluxes through the head and mouth of the lagoon during the winter months (March and September). For comparison, nutrient fluxes in the less pristine Honokohau Harbor are 182 mol/d and about 4,000 mol/d of bioavailable phosphorus and nitrogen, respectively (Holleman, 2011). Where do we see possible areas of increased primary productivity (i.e. plankton growth)? Because phytoplankton are either the direct or indirect food source for all marine animals, knowledge of its population mass and growth can inform us of the general state of an ecosystem. We use chlorophyll-a (chl-a), the green pigment essential for photosynthesis in algae and phytoplankton, which was measured in the surface waters, as our proxy for primary productivity. We measured chl-a during three sampling excursions which are shown in Figure 6 as grey circles (June 2010), squares (March 2011), and triangles (October 2011), with chl-a concentrations ranging from 0.1-0.7 µg/L. Figure 6. Chl-a concentration measured in surface water samples, shown with radon measured during March 2011 survey (from Figure 2, box D) to indicate groundwater discharge locations (in red). The March 2011 samples (squares) had the highest overall average chl-a concentrations. The highest concentration (0.7 µg/L in October 2011) was measured outside the lagoon in the open bay. Surprisingly, chl-a concentrations at the head of the lagoon (where groundwater discharge occurs at large volume), were the smallest (0.1 µg/L). This led us to investigate possible reasons for minimal uptake of groundwater-delivered nutrients directly at the source. The graphs below, in Figure 7, show chl-a concentration (green fill) with time of day (x-axis) and tide (blue fill). Sampling was conducted during low, low rising tide during every excursion. It is important to note that chl-a concentrations vary with the availability of sunlight as the sun’s energy is needed for the plants to perform photosynthesis. For comparison, mean chl-a concentration for the sampling excursion is shown as the green dotted line and mean chl-a concentration of all samples is given by the straight black line. Figure 7. Chlorophyll-a (chl-a) and mean chl-a concentration with tide at different times of the day. Chl-a concentration varies with the availability of sunlight, temperature, and salinity of water. Page 4
  • 5. Figure 8 shows chl-a concentration with salinity, radon, and the time since groundwater entered the ocean, i.e. the age of the nutrients assuming 0 age at the point of discharge. Our data suggest that cold temperatures and low salinity of SGD plumes near their source are not favored by marine organisms, despite the abundance of bioavailable nutrients. At the same time, older aged waters are warmer and have higher salinity because they mix with ocean water. Yet, they still contain elevated nutrient levels in comparison to the ambient ocean concentration. Thanks also to the longer presence of nutrients, these water masses exhibit higher primary productivity. Figure 8. Chlorophyll-a (chl-a) concentration measured in surface water samples with salinity, radon, and plotted against the apparent age of waters. Chl-a concentration increases with increasing salinity and age of waters. Also, March 2011 “tsunami” samples were brackish samples that had atypically high chl-a concentration, possibly due to inundation of seawater into the groundwater aquifer. Tying it all Together Highest Chl-a “Oldest” Water 8-12 Days Old Lowest Chl-a “Youngest” Water 0-2 Days Old up to 2,400 m3/d up to 8,000 m3/d up to 6,500 m3/d Figure 9. We found that as much as 11,000 m3/d of groundwater discharged to Kiholo Bay every day. Groundwater is enriched in nutrients and among others, contributes nitrogen, phosphorus and silica to the coastal ocean. Our data suggest that cold temperatures and low salinity of SGD plumes near their source are not favored by marine organisms, despite the abundance of bioavailable nutrients. At the same time, older aged waters are warmer and have higher salinity because they mix with ocean water. Thanks also to the longer presence of nutrients, these water masses exhibit higher primary productivity. Page 5
  • 6. Continuing Work & the role of the sgd sniffer Ongoing work includes analyzing data for salinity, nutrients, radon and temperature across the whole depth of the water column in the bay and lagoon regions in order to get an idea of how the SGD plume changes/ does not change with seasons throughout the water column. These data will also provide us ideas about benthic groundwater fluxes that do not have a prominent surface signature. Lastly, net primary productivity will be better constrained by performing carbon uptake measurements along the SGD plumes in the bay. Figure 10. Groundwater is naturally enriched in radon, and elevated coastal radon levels (shown in units of decay per minute per liter of seawater) reveal locations of groundwater discharge. Thanks to the newly developed SGD Sniffer (shown in the inset), we can now investigate this long-term record of submarine groundwater discharge to the coastal ocean to better understand landocean-climate interaction. The SGD Sniffer would be best positioned at the location proposed on this image, as that is one of the major SGD outcrops in the protected lagoon. More details on the proposed deployment can be found in the attached plan of operation. The SGD Sniffer MISSION Over several years, we have performed 2-3 day long measurements of coastal radon to calculate groundwater discharge and coastal nutrient fluxes in different seasons. We created maps of the coastline indicating the locations of focused groundwater outflow. We found that discharge is not uniform along the coastline but occurs through well-defined conduits. We also found that groundwater fluxes across the land-ocean interface vary significantly throughout the tidal cycle and also within and between wet and dry seasons. An excellent example of the temperamental nature of the magnitude of these fluxes occurs near the mouth of the inlet at Kiholo Bay (Figure 10). From June 2010 to March 2012 (five, 1-week periods), fluxes of groundwater from the coast at this one location varied in magnitude from about 5,000 gallons per day, to more than one million gallons per day. More-brackish discharges occurred just one week after the March 2011 tsunami brought up to 11-foot high waves to Kona. Discharges from March 2011 also had a noticeable effect on nearshore phytoplankton growth compared to previous sampling periods. It is evident that one cannot take “snap-shot” measurements of SGD to adequately understand how groundwater and its dissolved constituent fluxes respond to changes in climate and/or sea level change. To address this problem, we designed a unique coastal radon detector, the SGD Sniffer, which is capable of self-sustained longterm high-frequency monitoring of SGD. This is a first of its kind continuous radon monitor that will allow us to measure groundwater fluxes to the ocean over durations of months and years. The newly developed SGD Sniffer will provide continuous data on submarine groundwater discharge and will make it possible to investigate the mechanisms of long-term trends in SGD and its impact on coastal ecosystems. Thanks to this methodological advance, we can, for the first time, investigate long-term trends in SGD within the larger context of our rapidly expanding awareness and knowledge about climate change, sea-level rise and watershed processes. At the same time, we will be able to couple how land-ocean water fluxes change in magnitude and chemistry in response to local environmental and anthropogenic stressors. All data from the SGD Sniffer will be available to members of the Kiholo Community through a public data portal: PacIOOS.org. Page 6
  • 7. For More Information, Please Contact: Henrieta Dulaiova and Craig Glenn: (808) 956-0720 | hdulaiov@hawaii.edu University of Hawaii at Manoa Marine Geology 1680 East-West Road POST 701 Honolulu, HI 96822 ™ And View Our Team At: www.epscor.hawaii.edu/ender Page 7