SlideShare una empresa de Scribd logo
1 de 4
Descargar para leer sin conexión
Volume 1, Issue 2, 2006
                                                researchnotes
Proving the Link: ROA, Sales Growth, Market to Book

An organization’s culture is critical to its                       illustrating that a strong and effective organizational
success or failure (Schein, 1992; 1999). Many ex-                  culture can provide a competitive advantage to an
ecutives, managers, employees and experts intui-                   organization.
tively recognize the importance of an organization’s
culture for the health of the organization. However,               We used the data collected from 102 public compa-
prior to 1984, there was no hard evidence to prove                 nies that completed the Denison Organizational Cul-
the relationship between organizational culture and                ture Survey (DOCS). This research shows a strong
bottom-line performance results. For the last twenty               and significant relationship between culture and
years, Dr. Daniel Denison, of IMD Business School                  financial performance. Figure 1 shows the DOCS
in Lausanne, Switzerland has been conducting re-                   composite profiles for those companies in the top
search to prove the link between organizational cul-               25% versus those in the bottom 25% on their over-
ture and bottom-line performance metrics. (Denison                 all organizational culture results. Table 1 translates
1984; Denison 1990). This Research Note highlights                 these differences into financial results, showing that
the latest compelling evidence linking organizational              those companies with the most positive culture
culture to bottom-line metrics such as return-on-                  scores also have the best financial results.
assets, sales growth and market-to-book ratio
 Figure 1 = Scores on Denison Organizational Culture Survey
                           Bottom 25%                                                        Top 25%


                             ROA = 4.5%                                                      ROA = 6.3%
                         Sales Growth = 0.1%                                            Sales Growth = 15.1%
                              MtB = 3.5                                                       MtB = 4.4


   All content © copyright 2005-2006 Denison Consulting, LLC All rights reserved.   l   www.denisonconsulting.com   l   Page 1
Research Method                                                    the market value of a share. For example, assume
To examine the relationship between culture and                    an organization has $100 Million in assets on the
performance, we looked at a sample of public com-                  balance sheet and $75 Million in liabilities. The book
panies surveyed using the Denison Organizational                   value of that organization is $25 Million. (Assets – Li-
Culture Survey from 1996 to 2004. We included                      abilities = Book Value) If there are 10 million shares
organizations if more than .5% of all employees re-                outstanding, each share would represent $2.50 of
sponded or there were over 100 total respondents.                  book value. If each share sells on the market at $5
We did this to ensure that the employees surveyed                  (market value), then the market-to-book ratio would
adequately represent an organization’s culture. Ad-                be 2 (because 5/2.50 = 2). Essentially, market value
ditionally, we removed projects if they were a subdi-              is the investment community’s expectations of the
vision of a public company. The result was a sample                company’s worth.
of 102 companies in 29 industries incorporated pri-
marily in the US (89%). (Past research indicates that              We predicted that the companies with higher scores
the DOCS results are comparable across countries                   in the DOCS culture traits of Mission, Consistency,
[Denison, Haaland, & Goelzer, 2003].)                              Adaptability and Involvement would also have better
                                                                   return-on-assets, sales growth, and market-to-book
                                                                   ratios than those with lower scores. To test our
Measuring Performance                                              hypothesis, we linked the organizations in our data-
Once we had the sample, the next step was to                       base to publicly-available financial performance data
measure performance over time. We chose three                      from Standard & Poor’s COMPUSTAT database.
financial metrics to examine: return-on-assets, sales
growth and market-to-book ratio.
                                                                                        Table 1: The Results
First we took a look at return-on-assets. Return-
                                                                     Performance Measure Bottom 25%                      Top 25%
on-assets is the percentage of profits derived from
a company’s total assets. In other words, return-                   Return-on-Assets                   4.5%               6.3%
on-assets tells you how much profit a company                       Sales Growth                       0.1%              15.1%
generated for each dollar in assets. The higher the                 Market-to-Book Ratio                3.5                4.4
percentage of ROA, the better the organization is at
using its invested capital, or assets, to turn a profit.
For example, if two companies independently invest
$100,000 in equipment for a project and one com-
pany produces $10,000 in profit and another pro-
duces $12,000, the second company has a greater                                  “Culture matters…
return-on-assets.                                                        If the organization begins to fail,
                                                                         this implies that elements of the
Second and related to profitability, we took a look at                 culture have become dysfunctional
sales growth. Sales growth is usually expressed as
the percentage of increased sales from one year to
                                                                       and must change. Failure to under-
the next. For example, if we surveyed an organiza-                      stand culture and take it seriously
tion in 1999, year 0-1 sales growth was calculated                     can have disastrous consequences
by subtracting the sales from 1998 from the sales                               for an organization.”
from 1999. To get the percentage, we divided the
difference by the 1998 sales.

Finally we looked at the market-to-book ratio as a                    (Edgar H. Schein, The Corporate Culture
way of measuring an organization’s performance.                              Survival Guide, 1999, p.3)
The market-to-book ratio shows how the value of a
company by comparing the book value of a share to


   All content © copyright 2005-2006 Denison Consulting, LLC All rights reserved.   l    www.denisonconsulting.com   l    Page 2
The Results                                                  Figure 2 = Return-on-Assets
The results of our analyses show some
exciting findings. As you can see in Table                                                              Industry Percentile of Return-on-Assets
1, in the year of the survey, those orga-
                                                                                                80%
nizations with scores in the bottom 25th
percentile for traits of Mission, Consis-                                                       75%


                                                              Industry Percentile
tency, Involvement, and Adaptability                                                            70%
earn $4500 for every $100,000 spent on
                                                                                                65%
assets, while those in the top 25% earned
$6500. This profitability is also related to                                                    60%
how fast these companies are growing.                                                           55%
The sales growth of the top 25% was
                                                                                                50%
15% whereas those in the bottom 25%                                                                       Year 0           Year 1          Year 2               Year 3
were staying even at .1% growth. Turning
                                                                                                                    Top 25% (Average of 12 Indexes)
to the market-to-book ratio, the invest-                                                                            Bottom 25% (Average of 12 Indexes)
ment/market community is recognizing
the organizations with the higher culture
scores at 440% of book value versus                                 Figure 3 = Sales Growth
350% for organizations in the bottom
25%.                                                                                                       Industry Percentile of Sales Growth
                                                                                                 65%
This evidence indicates that the com-
panies with higher culture scores have                                                           60%
                                                                          Industry Percentile


better performance in the year of the                                                            55%
survey. But this study also allowed us to                                                        50%
take a look at the longitudinal data and
                                                                                                 45%
the results indicate that those high scor-
ing organizations also perform better in                                                         40%
the future. Figures 2, 3, and 4 illustrate                                                       35%
                                                                                                Figures
how the bottom and top 25% rank in their                                                                   Year 0 - 1        Year 1 - 2            Year 2 - 3
industry (by SIC code) over a three year                                                                                Top 25% (Average of 12 Indexes)
period for each of the three performance                                                                                Bottom 25% (Average of 12 Indexes)
measures.

All three graphs indicate that today’s                         Figure 4 = Market-to-Book Ratio
culture affects tomorrow’s performance.
Figure 2 shows that companies in the top                                                              Industry Percentile of Market-to-Book Ratio
25% improved to the 70th percentile in                                                          80%
industry return-on-assets within a three                                                    75%
year period. The lower scoring companies
                                                             Industry Percentile


                                                                                                70%
barely stay even. Similarly, Figure 3 shows
that, as measured by sales growth, the                                                          65%
companies in the top 25% consistently                                                           60%
beat their industry average. Figure 4
                                                                                                55%
shows a dramatic reversal over the three
years with the top 25% improving in the                                                         50%
investment community’s assessment of                                                                     Year 0          Year 1           Year 2           Year 3
their market value while the bottom 25%                                                                            Top 25% (Average of 12 Indexes)
                                                                                                                   Bottom 25% (Average of 12 Indexes)
declined.


   All content © copyright 2005-2006 Denison Consulting, LLC All rights reserved.                                   l    www.denisonconsulting.com                 l     Page 3
Conclusion
These results indicate that culture has not only a short-term impact on performance but lasting effects as
a competitive edge in the industry. Specifically, this research has shown a premium of almost 2% on ROA,
sales growth that is 15% higher, and a 90% greater market value for organizations scoring in the top (vs.
bottom) 25th percentile on the DOCS. Culture makes a difference in bottom-line performance. As a mea-
surable and controllable aspect of your organization, it is a lever that can improve future performance.
Executives, managers, and employees can focus on their organization’s culture today to improve their bot-
tom-line performance tomorrow.

The Denison Model
This research uses a culture model developed by Daniel Denison and                             “This research shows
William Neale built to explain the cultural factors leading to financial per-                      us how we can
formance and organizational effectiveness (Denison 1990). The model                             measure culture in a
assesses four behavioral traits: Involvement, Consistency, Mission, and                         way that is useful to
Adaptability. These traits are each broken down into three indexes. Ulti-
mately, they can be defined as “a code, a logic, and a system of struc-
                                                                                               managers because it
tured behaviors and meaning that have stood the test of time and serve                           links culture with
as a collective guide to future adaptation and survival” (Denison 1990,                          other bottom-line
175). The traits and definition of culture match Schein’s notion of the                             performance
“shared basic assumption that the group learned as it solved its problems                            measures.”
of external adaptation and internal integration” (1992, 12). The notion of
survival in the external environment is manifested in the adaptability and
mission traits which describe how strategically-oriented and customer-                          (Dan Denison, Denison
focused an organization is. The learned responses to the “problems of                                Consulting)
internal integration” are manifested by the traits of involvement and con-
sistency.

Related Resources                                                   Sons.
Denison, D. R., Haaland, S. & Goelzer, P. (2003). Is
Asia different from the rest of the world?. Organiza-               Schein, E. H. (1992). Organizational culture and
tional Dynamics, 33 (1), 98-109.                                    leadership (2nd ed.). San Francisco: Jossey-Bass.

Denison, D. R. (1984). Bringing Corporate Culture                   Schein, E. H. (1999). The Corporate Culture Survival
to the Bottom Line. Organizational dynamics, 13(2)                  Guide. San Francisco: Jossey-Bass.
5-22.

Denison, D. R. (1990). Corporate culture and or-
ganizational effectiveness. New York: John Wiley &


Contact Information                                                Copyright Information
Denison Consulting, LLC                                            Copyright 2005-2006 Denison Consulting, LLC
121 West Washington, Suite 201                                     All Rights Reserved.
Ann Arbor, Michigan 48104                                          Unauthorized reproduction, in any manner, is prohibited.
Phone: (734) 302-4002                                              The Denison model, circumplex and survey are trade-
Fax: (734) 302-4023                                                marks of Denison Consulting, LLC.
Email: research@denisonconsulting.com                              Version 1.0, March 2006


   All content © copyright 2005-2006 Denison Consulting, LLC All rights reserved.   l   www.denisonconsulting.com   l   Page 4

Más contenido relacionado

Último

Call US-88OO1O2216 Call Girls In Mahipalpur Female Escort Service
Call US-88OO1O2216 Call Girls In Mahipalpur Female Escort ServiceCall US-88OO1O2216 Call Girls In Mahipalpur Female Escort Service
Call US-88OO1O2216 Call Girls In Mahipalpur Female Escort Servicecallgirls2057
 
Global Scenario On Sustainable and Resilient Coconut Industry by Dr. Jelfina...
Global Scenario On Sustainable  and Resilient Coconut Industry by Dr. Jelfina...Global Scenario On Sustainable  and Resilient Coconut Industry by Dr. Jelfina...
Global Scenario On Sustainable and Resilient Coconut Industry by Dr. Jelfina...ictsugar
 
Marketplace and Quality Assurance Presentation - Vincent Chirchir
Marketplace and Quality Assurance Presentation - Vincent ChirchirMarketplace and Quality Assurance Presentation - Vincent Chirchir
Marketplace and Quality Assurance Presentation - Vincent Chirchirictsugar
 
(Best) ENJOY Call Girls in Faridabad Ex | 8377087607
(Best) ENJOY Call Girls in Faridabad Ex | 8377087607(Best) ENJOY Call Girls in Faridabad Ex | 8377087607
(Best) ENJOY Call Girls in Faridabad Ex | 8377087607dollysharma2066
 
8447779800, Low rate Call girls in Shivaji Enclave Delhi NCR
8447779800, Low rate Call girls in Shivaji Enclave Delhi NCR8447779800, Low rate Call girls in Shivaji Enclave Delhi NCR
8447779800, Low rate Call girls in Shivaji Enclave Delhi NCRashishs7044
 
Independent Call Girls Andheri Nightlaila 9967584737
Independent Call Girls Andheri Nightlaila 9967584737Independent Call Girls Andheri Nightlaila 9967584737
Independent Call Girls Andheri Nightlaila 9967584737Riya Pathan
 
Investment in The Coconut Industry by Nancy Cheruiyot
Investment in The Coconut Industry by Nancy CheruiyotInvestment in The Coconut Industry by Nancy Cheruiyot
Investment in The Coconut Industry by Nancy Cheruiyotictsugar
 
The CMO Survey - Highlights and Insights Report - Spring 2024
The CMO Survey - Highlights and Insights Report - Spring 2024The CMO Survey - Highlights and Insights Report - Spring 2024
The CMO Survey - Highlights and Insights Report - Spring 2024christinemoorman
 
Organizational Structure Running A Successful Business
Organizational Structure Running A Successful BusinessOrganizational Structure Running A Successful Business
Organizational Structure Running A Successful BusinessSeta Wicaksana
 
Lowrate Call Girls In Sector 18 Noida ❤️8860477959 Escorts 100% Genuine Servi...
Lowrate Call Girls In Sector 18 Noida ❤️8860477959 Escorts 100% Genuine Servi...Lowrate Call Girls In Sector 18 Noida ❤️8860477959 Escorts 100% Genuine Servi...
Lowrate Call Girls In Sector 18 Noida ❤️8860477959 Escorts 100% Genuine Servi...lizamodels9
 
Digital Transformation in the PLM domain - distrib.pdf
Digital Transformation in the PLM domain - distrib.pdfDigital Transformation in the PLM domain - distrib.pdf
Digital Transformation in the PLM domain - distrib.pdfJos Voskuil
 
2024 Numerator Consumer Study of Cannabis Usage
2024 Numerator Consumer Study of Cannabis Usage2024 Numerator Consumer Study of Cannabis Usage
2024 Numerator Consumer Study of Cannabis UsageNeil Kimberley
 
Ten Organizational Design Models to align structure and operations to busines...
Ten Organizational Design Models to align structure and operations to busines...Ten Organizational Design Models to align structure and operations to busines...
Ten Organizational Design Models to align structure and operations to busines...Seta Wicaksana
 
BEST Call Girls In Greater Noida ✨ 9773824855 ✨ Escorts Service In Delhi Ncr,
BEST Call Girls In Greater Noida ✨ 9773824855 ✨ Escorts Service In Delhi Ncr,BEST Call Girls In Greater Noida ✨ 9773824855 ✨ Escorts Service In Delhi Ncr,
BEST Call Girls In Greater Noida ✨ 9773824855 ✨ Escorts Service In Delhi Ncr,noida100girls
 
Future Of Sample Report 2024 | Redacted Version
Future Of Sample Report 2024 | Redacted VersionFuture Of Sample Report 2024 | Redacted Version
Future Of Sample Report 2024 | Redacted VersionMintel Group
 
Innovation Conference 5th March 2024.pdf
Innovation Conference 5th March 2024.pdfInnovation Conference 5th March 2024.pdf
Innovation Conference 5th March 2024.pdfrichard876048
 
Islamabad Escorts | Call 03070433345 | Escort Service in Islamabad
Islamabad Escorts | Call 03070433345 | Escort Service in IslamabadIslamabad Escorts | Call 03070433345 | Escort Service in Islamabad
Islamabad Escorts | Call 03070433345 | Escort Service in IslamabadAyesha Khan
 
Call Girls In Connaught Place Delhi ❤️88604**77959_Russian 100% Genuine Escor...
Call Girls In Connaught Place Delhi ❤️88604**77959_Russian 100% Genuine Escor...Call Girls In Connaught Place Delhi ❤️88604**77959_Russian 100% Genuine Escor...
Call Girls In Connaught Place Delhi ❤️88604**77959_Russian 100% Genuine Escor...lizamodels9
 
8447779800, Low rate Call girls in Saket Delhi NCR
8447779800, Low rate Call girls in Saket Delhi NCR8447779800, Low rate Call girls in Saket Delhi NCR
8447779800, Low rate Call girls in Saket Delhi NCRashishs7044
 

Último (20)

Call US-88OO1O2216 Call Girls In Mahipalpur Female Escort Service
Call US-88OO1O2216 Call Girls In Mahipalpur Female Escort ServiceCall US-88OO1O2216 Call Girls In Mahipalpur Female Escort Service
Call US-88OO1O2216 Call Girls In Mahipalpur Female Escort Service
 
Global Scenario On Sustainable and Resilient Coconut Industry by Dr. Jelfina...
Global Scenario On Sustainable  and Resilient Coconut Industry by Dr. Jelfina...Global Scenario On Sustainable  and Resilient Coconut Industry by Dr. Jelfina...
Global Scenario On Sustainable and Resilient Coconut Industry by Dr. Jelfina...
 
Marketplace and Quality Assurance Presentation - Vincent Chirchir
Marketplace and Quality Assurance Presentation - Vincent ChirchirMarketplace and Quality Assurance Presentation - Vincent Chirchir
Marketplace and Quality Assurance Presentation - Vincent Chirchir
 
(Best) ENJOY Call Girls in Faridabad Ex | 8377087607
(Best) ENJOY Call Girls in Faridabad Ex | 8377087607(Best) ENJOY Call Girls in Faridabad Ex | 8377087607
(Best) ENJOY Call Girls in Faridabad Ex | 8377087607
 
8447779800, Low rate Call girls in Shivaji Enclave Delhi NCR
8447779800, Low rate Call girls in Shivaji Enclave Delhi NCR8447779800, Low rate Call girls in Shivaji Enclave Delhi NCR
8447779800, Low rate Call girls in Shivaji Enclave Delhi NCR
 
Independent Call Girls Andheri Nightlaila 9967584737
Independent Call Girls Andheri Nightlaila 9967584737Independent Call Girls Andheri Nightlaila 9967584737
Independent Call Girls Andheri Nightlaila 9967584737
 
Investment in The Coconut Industry by Nancy Cheruiyot
Investment in The Coconut Industry by Nancy CheruiyotInvestment in The Coconut Industry by Nancy Cheruiyot
Investment in The Coconut Industry by Nancy Cheruiyot
 
The CMO Survey - Highlights and Insights Report - Spring 2024
The CMO Survey - Highlights and Insights Report - Spring 2024The CMO Survey - Highlights and Insights Report - Spring 2024
The CMO Survey - Highlights and Insights Report - Spring 2024
 
Organizational Structure Running A Successful Business
Organizational Structure Running A Successful BusinessOrganizational Structure Running A Successful Business
Organizational Structure Running A Successful Business
 
Lowrate Call Girls In Sector 18 Noida ❤️8860477959 Escorts 100% Genuine Servi...
Lowrate Call Girls In Sector 18 Noida ❤️8860477959 Escorts 100% Genuine Servi...Lowrate Call Girls In Sector 18 Noida ❤️8860477959 Escorts 100% Genuine Servi...
Lowrate Call Girls In Sector 18 Noida ❤️8860477959 Escorts 100% Genuine Servi...
 
Digital Transformation in the PLM domain - distrib.pdf
Digital Transformation in the PLM domain - distrib.pdfDigital Transformation in the PLM domain - distrib.pdf
Digital Transformation in the PLM domain - distrib.pdf
 
2024 Numerator Consumer Study of Cannabis Usage
2024 Numerator Consumer Study of Cannabis Usage2024 Numerator Consumer Study of Cannabis Usage
2024 Numerator Consumer Study of Cannabis Usage
 
Ten Organizational Design Models to align structure and operations to busines...
Ten Organizational Design Models to align structure and operations to busines...Ten Organizational Design Models to align structure and operations to busines...
Ten Organizational Design Models to align structure and operations to busines...
 
BEST Call Girls In Greater Noida ✨ 9773824855 ✨ Escorts Service In Delhi Ncr,
BEST Call Girls In Greater Noida ✨ 9773824855 ✨ Escorts Service In Delhi Ncr,BEST Call Girls In Greater Noida ✨ 9773824855 ✨ Escorts Service In Delhi Ncr,
BEST Call Girls In Greater Noida ✨ 9773824855 ✨ Escorts Service In Delhi Ncr,
 
Corporate Profile 47Billion Information Technology
Corporate Profile 47Billion Information TechnologyCorporate Profile 47Billion Information Technology
Corporate Profile 47Billion Information Technology
 
Future Of Sample Report 2024 | Redacted Version
Future Of Sample Report 2024 | Redacted VersionFuture Of Sample Report 2024 | Redacted Version
Future Of Sample Report 2024 | Redacted Version
 
Innovation Conference 5th March 2024.pdf
Innovation Conference 5th March 2024.pdfInnovation Conference 5th March 2024.pdf
Innovation Conference 5th March 2024.pdf
 
Islamabad Escorts | Call 03070433345 | Escort Service in Islamabad
Islamabad Escorts | Call 03070433345 | Escort Service in IslamabadIslamabad Escorts | Call 03070433345 | Escort Service in Islamabad
Islamabad Escorts | Call 03070433345 | Escort Service in Islamabad
 
Call Girls In Connaught Place Delhi ❤️88604**77959_Russian 100% Genuine Escor...
Call Girls In Connaught Place Delhi ❤️88604**77959_Russian 100% Genuine Escor...Call Girls In Connaught Place Delhi ❤️88604**77959_Russian 100% Genuine Escor...
Call Girls In Connaught Place Delhi ❤️88604**77959_Russian 100% Genuine Escor...
 
8447779800, Low rate Call girls in Saket Delhi NCR
8447779800, Low rate Call girls in Saket Delhi NCR8447779800, Low rate Call girls in Saket Delhi NCR
8447779800, Low rate Call girls in Saket Delhi NCR
 

Destacado

Product Design Trends in 2024 | Teenage Engineerings
Product Design Trends in 2024 | Teenage EngineeringsProduct Design Trends in 2024 | Teenage Engineerings
Product Design Trends in 2024 | Teenage EngineeringsPixeldarts
 
How Race, Age and Gender Shape Attitudes Towards Mental Health
How Race, Age and Gender Shape Attitudes Towards Mental HealthHow Race, Age and Gender Shape Attitudes Towards Mental Health
How Race, Age and Gender Shape Attitudes Towards Mental HealthThinkNow
 
AI Trends in Creative Operations 2024 by Artwork Flow.pdf
AI Trends in Creative Operations 2024 by Artwork Flow.pdfAI Trends in Creative Operations 2024 by Artwork Flow.pdf
AI Trends in Creative Operations 2024 by Artwork Flow.pdfmarketingartwork
 
PEPSICO Presentation to CAGNY Conference Feb 2024
PEPSICO Presentation to CAGNY Conference Feb 2024PEPSICO Presentation to CAGNY Conference Feb 2024
PEPSICO Presentation to CAGNY Conference Feb 2024Neil Kimberley
 
Content Methodology: A Best Practices Report (Webinar)
Content Methodology: A Best Practices Report (Webinar)Content Methodology: A Best Practices Report (Webinar)
Content Methodology: A Best Practices Report (Webinar)contently
 
How to Prepare For a Successful Job Search for 2024
How to Prepare For a Successful Job Search for 2024How to Prepare For a Successful Job Search for 2024
How to Prepare For a Successful Job Search for 2024Albert Qian
 
Social Media Marketing Trends 2024 // The Global Indie Insights
Social Media Marketing Trends 2024 // The Global Indie InsightsSocial Media Marketing Trends 2024 // The Global Indie Insights
Social Media Marketing Trends 2024 // The Global Indie InsightsKurio // The Social Media Age(ncy)
 
Trends In Paid Search: Navigating The Digital Landscape In 2024
Trends In Paid Search: Navigating The Digital Landscape In 2024Trends In Paid Search: Navigating The Digital Landscape In 2024
Trends In Paid Search: Navigating The Digital Landscape In 2024Search Engine Journal
 
5 Public speaking tips from TED - Visualized summary
5 Public speaking tips from TED - Visualized summary5 Public speaking tips from TED - Visualized summary
5 Public speaking tips from TED - Visualized summarySpeakerHub
 
ChatGPT and the Future of Work - Clark Boyd
ChatGPT and the Future of Work - Clark Boyd ChatGPT and the Future of Work - Clark Boyd
ChatGPT and the Future of Work - Clark Boyd Clark Boyd
 
Getting into the tech field. what next
Getting into the tech field. what next Getting into the tech field. what next
Getting into the tech field. what next Tessa Mero
 
Google's Just Not That Into You: Understanding Core Updates & Search Intent
Google's Just Not That Into You: Understanding Core Updates & Search IntentGoogle's Just Not That Into You: Understanding Core Updates & Search Intent
Google's Just Not That Into You: Understanding Core Updates & Search IntentLily Ray
 
Time Management & Productivity - Best Practices
Time Management & Productivity -  Best PracticesTime Management & Productivity -  Best Practices
Time Management & Productivity - Best PracticesVit Horky
 
The six step guide to practical project management
The six step guide to practical project managementThe six step guide to practical project management
The six step guide to practical project managementMindGenius
 
Beginners Guide to TikTok for Search - Rachel Pearson - We are Tilt __ Bright...
Beginners Guide to TikTok for Search - Rachel Pearson - We are Tilt __ Bright...Beginners Guide to TikTok for Search - Rachel Pearson - We are Tilt __ Bright...
Beginners Guide to TikTok for Search - Rachel Pearson - We are Tilt __ Bright...RachelPearson36
 
Unlocking the Power of ChatGPT and AI in Testing - A Real-World Look, present...
Unlocking the Power of ChatGPT and AI in Testing - A Real-World Look, present...Unlocking the Power of ChatGPT and AI in Testing - A Real-World Look, present...
Unlocking the Power of ChatGPT and AI in Testing - A Real-World Look, present...Applitools
 
12 Ways to Increase Your Influence at Work
12 Ways to Increase Your Influence at Work12 Ways to Increase Your Influence at Work
12 Ways to Increase Your Influence at WorkGetSmarter
 

Destacado (20)

Product Design Trends in 2024 | Teenage Engineerings
Product Design Trends in 2024 | Teenage EngineeringsProduct Design Trends in 2024 | Teenage Engineerings
Product Design Trends in 2024 | Teenage Engineerings
 
How Race, Age and Gender Shape Attitudes Towards Mental Health
How Race, Age and Gender Shape Attitudes Towards Mental HealthHow Race, Age and Gender Shape Attitudes Towards Mental Health
How Race, Age and Gender Shape Attitudes Towards Mental Health
 
AI Trends in Creative Operations 2024 by Artwork Flow.pdf
AI Trends in Creative Operations 2024 by Artwork Flow.pdfAI Trends in Creative Operations 2024 by Artwork Flow.pdf
AI Trends in Creative Operations 2024 by Artwork Flow.pdf
 
Skeleton Culture Code
Skeleton Culture CodeSkeleton Culture Code
Skeleton Culture Code
 
PEPSICO Presentation to CAGNY Conference Feb 2024
PEPSICO Presentation to CAGNY Conference Feb 2024PEPSICO Presentation to CAGNY Conference Feb 2024
PEPSICO Presentation to CAGNY Conference Feb 2024
 
Content Methodology: A Best Practices Report (Webinar)
Content Methodology: A Best Practices Report (Webinar)Content Methodology: A Best Practices Report (Webinar)
Content Methodology: A Best Practices Report (Webinar)
 
How to Prepare For a Successful Job Search for 2024
How to Prepare For a Successful Job Search for 2024How to Prepare For a Successful Job Search for 2024
How to Prepare For a Successful Job Search for 2024
 
Social Media Marketing Trends 2024 // The Global Indie Insights
Social Media Marketing Trends 2024 // The Global Indie InsightsSocial Media Marketing Trends 2024 // The Global Indie Insights
Social Media Marketing Trends 2024 // The Global Indie Insights
 
Trends In Paid Search: Navigating The Digital Landscape In 2024
Trends In Paid Search: Navigating The Digital Landscape In 2024Trends In Paid Search: Navigating The Digital Landscape In 2024
Trends In Paid Search: Navigating The Digital Landscape In 2024
 
5 Public speaking tips from TED - Visualized summary
5 Public speaking tips from TED - Visualized summary5 Public speaking tips from TED - Visualized summary
5 Public speaking tips from TED - Visualized summary
 
ChatGPT and the Future of Work - Clark Boyd
ChatGPT and the Future of Work - Clark Boyd ChatGPT and the Future of Work - Clark Boyd
ChatGPT and the Future of Work - Clark Boyd
 
Getting into the tech field. what next
Getting into the tech field. what next Getting into the tech field. what next
Getting into the tech field. what next
 
Google's Just Not That Into You: Understanding Core Updates & Search Intent
Google's Just Not That Into You: Understanding Core Updates & Search IntentGoogle's Just Not That Into You: Understanding Core Updates & Search Intent
Google's Just Not That Into You: Understanding Core Updates & Search Intent
 
How to have difficult conversations
How to have difficult conversations How to have difficult conversations
How to have difficult conversations
 
Introduction to Data Science
Introduction to Data ScienceIntroduction to Data Science
Introduction to Data Science
 
Time Management & Productivity - Best Practices
Time Management & Productivity -  Best PracticesTime Management & Productivity -  Best Practices
Time Management & Productivity - Best Practices
 
The six step guide to practical project management
The six step guide to practical project managementThe six step guide to practical project management
The six step guide to practical project management
 
Beginners Guide to TikTok for Search - Rachel Pearson - We are Tilt __ Bright...
Beginners Guide to TikTok for Search - Rachel Pearson - We are Tilt __ Bright...Beginners Guide to TikTok for Search - Rachel Pearson - We are Tilt __ Bright...
Beginners Guide to TikTok for Search - Rachel Pearson - We are Tilt __ Bright...
 
Unlocking the Power of ChatGPT and AI in Testing - A Real-World Look, present...
Unlocking the Power of ChatGPT and AI in Testing - A Real-World Look, present...Unlocking the Power of ChatGPT and AI in Testing - A Real-World Look, present...
Unlocking the Power of ChatGPT and AI in Testing - A Real-World Look, present...
 
12 Ways to Increase Your Influence at Work
12 Ways to Increase Your Influence at Work12 Ways to Increase Your Influence at Work
12 Ways to Increase Your Influence at Work
 

Proving the Link: ROA, Sales Growth, Market to Book

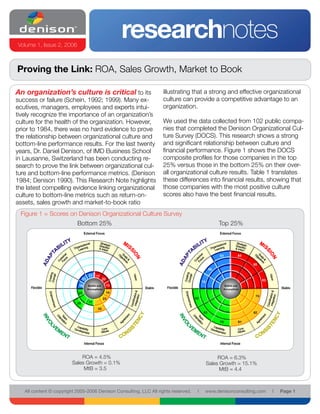
  • 1. Volume 1, Issue 2, 2006 researchnotes Proving the Link: ROA, Sales Growth, Market to Book An organization’s culture is critical to its illustrating that a strong and effective organizational success or failure (Schein, 1992; 1999). Many ex- culture can provide a competitive advantage to an ecutives, managers, employees and experts intui- organization. tively recognize the importance of an organization’s culture for the health of the organization. However, We used the data collected from 102 public compa- prior to 1984, there was no hard evidence to prove nies that completed the Denison Organizational Cul- the relationship between organizational culture and ture Survey (DOCS). This research shows a strong bottom-line performance results. For the last twenty and significant relationship between culture and years, Dr. Daniel Denison, of IMD Business School financial performance. Figure 1 shows the DOCS in Lausanne, Switzerland has been conducting re- composite profiles for those companies in the top search to prove the link between organizational cul- 25% versus those in the bottom 25% on their over- ture and bottom-line performance metrics. (Denison all organizational culture results. Table 1 translates 1984; Denison 1990). This Research Note highlights these differences into financial results, showing that the latest compelling evidence linking organizational those companies with the most positive culture culture to bottom-line metrics such as return-on- scores also have the best financial results. assets, sales growth and market-to-book ratio Figure 1 = Scores on Denison Organizational Culture Survey Bottom 25% Top 25% ROA = 4.5% ROA = 6.3% Sales Growth = 0.1% Sales Growth = 15.1% MtB = 3.5 MtB = 4.4 All content © copyright 2005-2006 Denison Consulting, LLC All rights reserved. l www.denisonconsulting.com l Page 1
  • 2. Research Method the market value of a share. For example, assume To examine the relationship between culture and an organization has $100 Million in assets on the performance, we looked at a sample of public com- balance sheet and $75 Million in liabilities. The book panies surveyed using the Denison Organizational value of that organization is $25 Million. (Assets – Li- Culture Survey from 1996 to 2004. We included abilities = Book Value) If there are 10 million shares organizations if more than .5% of all employees re- outstanding, each share would represent $2.50 of sponded or there were over 100 total respondents. book value. If each share sells on the market at $5 We did this to ensure that the employees surveyed (market value), then the market-to-book ratio would adequately represent an organization’s culture. Ad- be 2 (because 5/2.50 = 2). Essentially, market value ditionally, we removed projects if they were a subdi- is the investment community’s expectations of the vision of a public company. The result was a sample company’s worth. of 102 companies in 29 industries incorporated pri- marily in the US (89%). (Past research indicates that We predicted that the companies with higher scores the DOCS results are comparable across countries in the DOCS culture traits of Mission, Consistency, [Denison, Haaland, & Goelzer, 2003].) Adaptability and Involvement would also have better return-on-assets, sales growth, and market-to-book ratios than those with lower scores. To test our Measuring Performance hypothesis, we linked the organizations in our data- Once we had the sample, the next step was to base to publicly-available financial performance data measure performance over time. We chose three from Standard & Poor’s COMPUSTAT database. financial metrics to examine: return-on-assets, sales growth and market-to-book ratio. Table 1: The Results First we took a look at return-on-assets. Return- Performance Measure Bottom 25% Top 25% on-assets is the percentage of profits derived from a company’s total assets. In other words, return- Return-on-Assets 4.5% 6.3% on-assets tells you how much profit a company Sales Growth 0.1% 15.1% generated for each dollar in assets. The higher the Market-to-Book Ratio 3.5 4.4 percentage of ROA, the better the organization is at using its invested capital, or assets, to turn a profit. For example, if two companies independently invest $100,000 in equipment for a project and one com- pany produces $10,000 in profit and another pro- duces $12,000, the second company has a greater “Culture matters… return-on-assets. If the organization begins to fail, this implies that elements of the Second and related to profitability, we took a look at culture have become dysfunctional sales growth. Sales growth is usually expressed as the percentage of increased sales from one year to and must change. Failure to under- the next. For example, if we surveyed an organiza- stand culture and take it seriously tion in 1999, year 0-1 sales growth was calculated can have disastrous consequences by subtracting the sales from 1998 from the sales for an organization.” from 1999. To get the percentage, we divided the difference by the 1998 sales. Finally we looked at the market-to-book ratio as a (Edgar H. Schein, The Corporate Culture way of measuring an organization’s performance. Survival Guide, 1999, p.3) The market-to-book ratio shows how the value of a company by comparing the book value of a share to All content © copyright 2005-2006 Denison Consulting, LLC All rights reserved. l www.denisonconsulting.com l Page 2
  • 3. The Results Figure 2 = Return-on-Assets The results of our analyses show some exciting findings. As you can see in Table Industry Percentile of Return-on-Assets 1, in the year of the survey, those orga- 80% nizations with scores in the bottom 25th percentile for traits of Mission, Consis- 75% Industry Percentile tency, Involvement, and Adaptability 70% earn $4500 for every $100,000 spent on 65% assets, while those in the top 25% earned $6500. This profitability is also related to 60% how fast these companies are growing. 55% The sales growth of the top 25% was 50% 15% whereas those in the bottom 25% Year 0 Year 1 Year 2 Year 3 were staying even at .1% growth. Turning Top 25% (Average of 12 Indexes) to the market-to-book ratio, the invest- Bottom 25% (Average of 12 Indexes) ment/market community is recognizing the organizations with the higher culture scores at 440% of book value versus Figure 3 = Sales Growth 350% for organizations in the bottom 25%. Industry Percentile of Sales Growth 65% This evidence indicates that the com- panies with higher culture scores have 60% Industry Percentile better performance in the year of the 55% survey. But this study also allowed us to 50% take a look at the longitudinal data and 45% the results indicate that those high scor- ing organizations also perform better in 40% the future. Figures 2, 3, and 4 illustrate 35% Figures how the bottom and top 25% rank in their Year 0 - 1 Year 1 - 2 Year 2 - 3 industry (by SIC code) over a three year Top 25% (Average of 12 Indexes) period for each of the three performance Bottom 25% (Average of 12 Indexes) measures. All three graphs indicate that today’s Figure 4 = Market-to-Book Ratio culture affects tomorrow’s performance. Figure 2 shows that companies in the top Industry Percentile of Market-to-Book Ratio 25% improved to the 70th percentile in 80% industry return-on-assets within a three 75% year period. The lower scoring companies Industry Percentile 70% barely stay even. Similarly, Figure 3 shows that, as measured by sales growth, the 65% companies in the top 25% consistently 60% beat their industry average. Figure 4 55% shows a dramatic reversal over the three years with the top 25% improving in the 50% investment community’s assessment of Year 0 Year 1 Year 2 Year 3 their market value while the bottom 25% Top 25% (Average of 12 Indexes) Bottom 25% (Average of 12 Indexes) declined. All content © copyright 2005-2006 Denison Consulting, LLC All rights reserved. l www.denisonconsulting.com l Page 3
  • 4. Conclusion These results indicate that culture has not only a short-term impact on performance but lasting effects as a competitive edge in the industry. Specifically, this research has shown a premium of almost 2% on ROA, sales growth that is 15% higher, and a 90% greater market value for organizations scoring in the top (vs. bottom) 25th percentile on the DOCS. Culture makes a difference in bottom-line performance. As a mea- surable and controllable aspect of your organization, it is a lever that can improve future performance. Executives, managers, and employees can focus on their organization’s culture today to improve their bot- tom-line performance tomorrow. The Denison Model This research uses a culture model developed by Daniel Denison and “This research shows William Neale built to explain the cultural factors leading to financial per- us how we can formance and organizational effectiveness (Denison 1990). The model measure culture in a assesses four behavioral traits: Involvement, Consistency, Mission, and way that is useful to Adaptability. These traits are each broken down into three indexes. Ulti- mately, they can be defined as “a code, a logic, and a system of struc- managers because it tured behaviors and meaning that have stood the test of time and serve links culture with as a collective guide to future adaptation and survival” (Denison 1990, other bottom-line 175). The traits and definition of culture match Schein’s notion of the performance “shared basic assumption that the group learned as it solved its problems measures.” of external adaptation and internal integration” (1992, 12). The notion of survival in the external environment is manifested in the adaptability and mission traits which describe how strategically-oriented and customer- (Dan Denison, Denison focused an organization is. The learned responses to the “problems of Consulting) internal integration” are manifested by the traits of involvement and con- sistency. Related Resources Sons. Denison, D. R., Haaland, S. & Goelzer, P. (2003). Is Asia different from the rest of the world?. Organiza- Schein, E. H. (1992). Organizational culture and tional Dynamics, 33 (1), 98-109. leadership (2nd ed.). San Francisco: Jossey-Bass. Denison, D. R. (1984). Bringing Corporate Culture Schein, E. H. (1999). The Corporate Culture Survival to the Bottom Line. Organizational dynamics, 13(2) Guide. San Francisco: Jossey-Bass. 5-22. Denison, D. R. (1990). Corporate culture and or- ganizational effectiveness. New York: John Wiley & Contact Information Copyright Information Denison Consulting, LLC Copyright 2005-2006 Denison Consulting, LLC 121 West Washington, Suite 201 All Rights Reserved. Ann Arbor, Michigan 48104 Unauthorized reproduction, in any manner, is prohibited. Phone: (734) 302-4002 The Denison model, circumplex and survey are trade- Fax: (734) 302-4023 marks of Denison Consulting, LLC. Email: research@denisonconsulting.com Version 1.0, March 2006 All content © copyright 2005-2006 Denison Consulting, LLC All rights reserved. l www.denisonconsulting.com l Page 4