More Related Content
Similar to Digital Facts: Cars Drive 80% of Internet Advertising Growth
Similar to Digital Facts: Cars Drive 80% of Internet Advertising Growth (20)
More from 中文互联网数据研究资讯中心--199it
More from 中文互联网数据研究资讯中心--199it (20)
Digital Facts: Cars Drive 80% of Internet Advertising Growth
- 1. Digital Facts
Automobiles
• Cars are the top driver of Internet advertising
• Cars are strong in mobile display advertising
• One in every ten Internet users visits auto manufacturer sites
• Nine out of ten users of Audi’s new car configurator are men
• Advertising pressure and social media posts for electric and hybrid models are growing
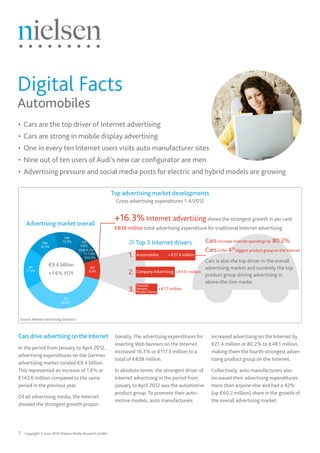
Top advertising market developments
Gross advertising expenditures 1-4/2012
Advertising market overall
+16.3% Internet advertising shows the strongest growth in per cent
€838 million total advertising expenditure for traditional Internet advertising
CM
DM
12,2% RD
Top 3 Internet drivers Cars increase Internet spendings by 80.2%
12,3% 5,0%
OOH 4,2% Cars is the 4th biggest product group on the Internet
TJ 1,5%
CI 0,3% 1. Automobiles + €21.4 million
Cars is also the top driver in the overall
€9.4 billion
NP INT advertising market and currently the top
17,4%
+1.6% YOY 8,9%
2. Company Advertising + €14.1 million
product group driving advertising in
above-the-line media
Financial
3. ServicesClients + €7.7 million
Private
TV
38,2%
Source: Nielsen Advertising Statistics
Cars drive advertising on the Internet tionally. The advertising expenditures for increased advertising on the Internet by
inserting Web banners on the Internet €21.4 million or 80.2% to €48.1 million,
In the period from January to April 2012,
increased 16.3% or €117.3 million to a making them the fourth-strongest adver-
advertising expenditures on the German
total of €838 million. tising product group on the Internet.
advertising market totaled €9.4 billion.
This represented an increase of 1.6% or In absolute terms, the strongest driver of Collectively, auto manufacturers also
€143.6 million compared to the same Internet advertising in the period from increased their advertising expenditures
period in the previous year. January to April 2012 was the automotive more than anyone else and had a 42%
product group. To promote their auto- (up €60.2 million) share in the growth of
Of all advertising media, the Internet
motive models, auto manufacturers the overall advertising market.
showed the strongest growth propor-
1 Copyright © June 2012 Nielsen Media Research GmbH
Legend
- 2. Nielsen Digital Facts Automobiles
Audi is responsible for the greatest
Automotive product group – media mix and top drivers
increase of advertising pressure in
Gross advertising expenditures 1-4/2012
the auto market
CM
12,0%
+80.2% Automotive increases Internet
While auto manufacturers increased the
DM
1,7%
RD
advertising disproportionately advertising pressure for their models by
11,8%
OOH 2,3%
11.8% to €577.6 million in the period from
TJ 0,5%
January to April 2012, according to the
NP
25,1% Automotive
CI 0,2%
INT
Top 3 Internet drivers Federal Motor Transport Authority, new
€577.6 million 8,3%
1. Audi +3,1 Mio.€ registrations in the same period were up
+11.8% YOY 1.8% compared to the previous year.
2. Opel +2,7 Mio.€ By a wide margin, Audi increased monetary
TV advertising the most to promote its auto-
38,1%
3. Renault +2,5 Mio.€ motive models. With an increase of €19.1
million, Audi almost doubled its advertising
New car expenditures from January to April 2012
registrations compared to the previous year. The largest
Top 3 drivers overall 1-4/2012 vs. 1-4/2011 shares were dedicated to promoting the
A1 compact car and the A4 Avant station
1. Audi +19,1 Mio.€ +7.1%
wagon.
2. VW +9,1 Mio.€ +2.9% With a share of 38.1%, the greatest share
Audi increases of automotive advertising was still on
advertising pressure
3. Hyundai +8,6 Mio.€ +16.2% more than anyone else television, but a significantly greater
percentage of the additional money auto
manufacturers invested in advertising
went to the Internet. Here, too, Audi
S
ource: Advertising data, Nielsen Advertising Statistics; New car registrations,
Federal Motor Transport Authority (Kraftfahrt-Bundesamt, KBA) showed the greatest growth.
Strong increase of mobile adver-
Mobile display advertising
tising campaigns for cars
Gross advertising expenditures 1-4/2012
There was also an increase of mobile
Vehicle market sector
campaigns advertising car models. In the
first four months of 2012, advertising
Automotive product group expenditures by auto manufacturers for
+117% growth of display display advertising on mobile websites
11.0% advertising on mobile websites and and apps increased by 117% compared
22.2% apps for car models compared with with the same period in the previous
the previous year year. This makes the automotive sector
a strong driver of the mobile advertising
Top 3 auto manufacturers
market, which saw overall growth of 76%
1. Volkswagen in the period under consideration. In the
2. Audi automotive product group, Volkswagen
3. Toyota and Audi were the leading users of this
Source: Nielsen Advertising Statistics PKW method of addressing the target group.
W B KF
Z
Res t
2 Copyright © June 2012 Nielsen Media Research GmbH
Legend
- 3. Nielsen Digital Facts Automobiles
Auto manufacturers on the Internet
Website visitors in the auto manufacturer category in April 2012
One in every ten Internet visitors
went to an auto manufacturer’s website
Top 5 websites
4.8 million users overall were Volkswagen
recorded by auto manufacturers’ 865,601 users / 1.89% active reach
Web offerings in April BMW
593,174 users / 1.29% active reach
Mercedes-Benz
496,803 users / 1.08% active reach
41% 59%
Opel
Index: Index:
Men visit auto manufacturer websites
427,585 users / 0.93% active reach
88 110
more often and longer Audi
410,567 users / 0.89% active reach
2.00 2.27
Top 2 source of traffic
2.16 Sessions per person
1. 2. 46% of the visitors to auto
direct google.de manufacturer websites
14 23
46% 29% go directly to the offering
19 Pages per person others
25%
29% arrive via a
Google search
8:42 11:31
10:21 Duration of visit in minutes
Range of 1:04 minutes for Lexus to 21:28 minutes duration of visit at Audi
Highest number of average pages per person is 43, at Audi
Source: Nielsen NetView
3 Copyright © June 2012 Nielsen Media Research GmbH
Legend
- 4. Nielsen Digital Facts Automobiles
Almost every other visitor calls
Audi website
up automotive websites directly
Visitors to the Audi website in April 2012
Examining the Internet presence of auto
manufacturers shows that these sites
were well used: In April 2012 auto manu-
410,567 website visitors in April
facturers recorded a total of 4.8 million Audi with 21:28 minutes, this was the
visitors to their websites. This means that highest duration of visit
every tenth active Internet user in April
out of all auto manufacturer sites
visited an auto manufacturer’s website at
least once.
36% 64%
Visitors to the Audi website are
46% of users called up the website of the
disproportionately men,
respective auto manufacturer directly,
who use auto manufacturer sites
while 29% arrived via a Google search.
The rest were led there via various links more intensively overall
on sites, including via advertising banners
inserted on the Internet.
More than one in four visitors
Volkswagen recorded the most visitors used the
in the auto manufacturer sector in April 40:03 minutes duration of visit
2012, followed by BMW and Mercedes- Configurator 84 pages per person
Benz. 865,601 visitors, meaning 1.89% of
active Internet users in April, went to the 13% 87%
Volkswagen website.
Men use car websites more often Mainly men
and more intensively use the configurator
An average of 59% of visitors to auto
manufacturer websites were men, mean- 12.7% of the visitors were in the password-protected area ‘myAudi’
ing that men were disproportionately
Source: Nielsen NetView
represented on these pages compared to
the structure of all Internet users.
10:21 minutes, with a very wide range. With 64%, this represents the dispropor-
In addition to representing the largest
While Internet visitors to the Lexus web- tionately higher share of male users at
percentage of visitors to automobile
site stayed for an average of 1:04 minutes, Audi, who use automobile websites more
manufacturer websites, men also use
they stayed at Audi for an average of intensively overall.
them more intensively than women.
21:28 minutes.
While visitors called up the Internet More than one in every four Audi Internet
presences of automobile manufacturers visitors used the configurator, which
Audi has higher duration of visit
an average of 2.16 times in April 2012, allows the user to put together a car
with new car configurator
male visitors went to the respective according to custom specifications. The
offering an average of 2.27 times. Men Audi’s website, which recorded 410,576 share of male users of the configurator
also spent more time here and called up visitors in April 2012, not only exhibits was 87%, which was again higher, as was
more pages. the highest average duration of visit in the average duration of visit, at 40:03
the automobile sector, but also the high- minutes.
The average duration of visit on automo-
est average number of page views, at 43.
bile manufacturers’ websites in April was
4 Copyright © June 2012 Nielsen Media Research GmbH
- 5. Nielsen Digital Facts Automobiles
Electric and hybrid market gaining
Electric and hybrid cars
importance
Gross advertising expenditures 1-4/2012
While auto manufacturers increased their
of the entire advertising pressure for automotive advertising investment by 11.8% in the
,0% 5.0% were allotted to electric and hybrid models first four months of the year compared
0%
6%
0% with the previous year, proportionally
% their increase of advertising pressure
+75.4% more advertising investments
DM CM
NP 0,2% 16,8%
11,6% for their electric and hybrid models was
RD
5,8% for electric and hybrid cars significantly stronger. With a growth rate
Electric/ TJ
0,6%
+133% advertising pressure of 75.4%, 5.0% of overall automobile
hybrid cars INT
6,7% on the Internet advertising expenditures were allotted to
€29.0 million electric and hybrid models. If only April
+75.4% YOY Top 5 companies 2012 is considered, the share is already 8.7%.
Advertising expenditures /Overall share at the company
In the period from January to April 2012,
TV
Toyota (including Lexus)
58,3%
€11.3 million / 29.1%
the auto manufacturers Toyota and Citroёn
invested the highest percentages of their
Citroёn
€7.4 million / 25.9%
automobile advertising expenditures, with
over a quarter of total spendings, in electric
Top 5 individually advertised
Opel
electric and hybrid models €4.8 million / 12.7%
and hybrid vehicles. These two companies
also exerted the highest advertising pres-
Citroёn DS5 Hybrid
€7.4 million Renault sure in this segment in absolute terms,
€3.5 million / 8.9% while Audi, for example, did not advertise
Lexus CT 200 Hybrid
€5.1 million BMW its electric and hybrid models during the
€1.3 million / 6.4% period under consideration.
Opel Ampera Electric
€4.8 million The topic of electric mobility is also
Renault Twizy Electric gaining social significance due to the
€3.0 million promotion of new technologies through
BMW 3 Series Hybrid government specifications, and currently
€1.3 million also has a high degree of media presence.
On the Internet, the growing volume
of discussions in social media on the
+21.2% topic of electric and hybrid mobility also
new registrations provides evidence that these vehicles are
of electric and hybrid cars becoming increasingly important.
KBA However, consumers are currently still
1-4/2012
very cautious about buying electric and
hybrid vehicles. According to the Federal
Not only advertising pressure and new registrations of electric Motor Transport Authority, in the period
and hybrid cars are showing significant growth. Discussions from January to April 2012, new registra-
tions of hybrid cars were up 23.4%, while
by Internet users in social media about this topic are also
those of electric cars were up 10.0%, but
increasing appreciably.
the overall level remains low. Together,
S
ource: Advertising data, Nielsen Advertising Statistics; New car registrations, Federal Motor Transport Authority electric and hybrid cars accounted for
(Kraftfahrt-Bundesamt, KBA)
0.6% of all new car registrations.
5 Copyright © June 2012 Nielsen Media Research GmbH
Legend
- 6. Nielsen Digital Facts Automobiles
Online discussions influence the
Significance of social media in the decision to purchase a car
purchasing decision for auto-
mobiles
64% of consumers in Germany trust consumer opinions posted
on the Internet absolutely or completely If consumers are asked which (advertis-
ing) recommendations they trust,
of consumers indicate that it is very likely or likely that their next recommendations by people they know
44% purchasing decision regarding automobiles will be based on are in first place. Nine of ten people
online product discussions/social media websites surveyed rely on recommendations from
family and friends. However, consumer
Source: Nielsen Global Trust in Advertising Survey, Q3 2011; Nielsen Global Survey Social Media, Q1 2012
opinions posted on the Internet are in
second place. 64% trust social media,
while editorial content and different
Social media posts on the topic of electric and hybrid cars
forms of advertising come after this.
This trust is shown in the purchase
29,129 30,907 +6.1% social media posts decision process: For 44% of people
1-4/2011 1-4/2012 on the topic of electric and hybrid cars surveyed, the decision for a future car
purchase is very likely or likely to be
Contents of the topic discussion based on online reviews. Consumers find
Electric/hybrid mobility1) a large number of social media posts to
Top 7 sources shape their opinion. In the period from
Social media posts 1-4/2012 32% of the posts discuss environmental January to April 2012, alone, there were
friendliness, which is the most heavily 579,478 posts mentioning an automobile
twitter.com
5,890 posts
promoted aspect in the advertising.
brand.
However, technological and
motor-talk.de Electric and hybrid cars are
2,932 posts
financial aspects predominate, at
54% and 44% respectively. These frequently discussed online
meinews.niuz.biz
2,925 posts aspects are usually assessed critically. In the period from January to April 2012,
photovoltaikforum.com
1,893 posts Almost ¼ of users mention the purchase
30,907 social media postings were made
on the topic of electric and hybrid mobil-
price, which most find to be too high.
facebook.com
1,293 posts
ity, which is 6.1% more than during the
same period in the previous year.
In 46% of the posts the users refer to a
flickr.com
538 posts specific brand. Among the top sources with the most
postings on this topic were technical
haustechnikdialog.de 6% of the users who express an opinion forums, but also platforms that primarily
529 posts
about electric and hybrid mobility have deal with general interest topics. The
driven one of these vehicles previously. ranking by the microblogging service
Twitter is cited, in which news and
Read more about this topic in the Nielsen/NM Incite Study trends on electric mobility as well as
“Consumer Acceptance of Electric Mobility,” market-related studies are distributed. In
which compares advertising communication and online discussion in detail contrast, in forums the advantages and
disadvantages of specific vehicle models
1) Assessment period: 01/01/2011 - 02/29/2012 are discussed, as well as the development
B
asis: German-speaking social media posts on the topic of electric mobility in social communities such as forums, blogs, of electric mobility in general.
Facebook, Twitter and video platforms.
Source: NM Incite (A Nielsen/McKinsey Company)
6 Copyright © June 2012 Nielsen Media Research GmbH
- 7. About this report
The basis for this study is data on Internet use from the
Nielsen NetView Panel, analyses for social media by
NM Incite and Nielsen’s advertising data.
NetView Advertising statistical data
NetView is a Nielsen service for recording The gross advertising expenditures indi-
the use of the Internet and applications cated are based on Nielsen Advertising
on the basis of a representative panel of Statistics. The following media classes
25,000 people. The measurement is per- were included in the analyses:
formed by means of patented software
• Television
installed on the panelists’ computers.
• Radio
The complete click stream on the URL • Newspapers
level is recorded, as well as video and • Consumer magazines
application use of the respective individuals • Trade journals Legend
in the household. The most important • ut of home (posters, transport media,
O
• bove-the-line media = overall ad-
A
key figures here are the unique audience and at-retail media)
vertising market without direct mail
(visitors) and the duration of visit. • Cinema
• ctive reach = share of all active
A
• Internet
Internet users
Social media analyses • Direct mail
• DM = direct mail (advertising by mail)
NM Incite (A Nielsen/McKinsey Company) The advertising expenditures correspond • TJ = trade journals
uses social media as the world’s largest to the gross insertion charges, which in
• verall advertising market = tele-
O
focus group to answer various marketing direct mail is equal to the postal charges. vision, radio, newspapers, consumer
and market-research questions. Experi- magazines, trade journals, out of
enced research analysts browse, structure Comparisons with the previous home (posters, transport media, and
and analyse social media such as blogs, year at-retail media), cinema, Internet
forums, Facebook and Twitter. and direct mail
The changes shown compared with the • INT = Internet
Right now no medium is growing faster previous year are adjusted comparisons.
• CI = cinema
than social media. Millions of consumers Methodological changes were excluded,
are online everyday to express their while natural developments on the media • OH = out of home (posters, trans-
O
port media and at-retail media)
opinions, share their ideas with other market, such as launches or discontinua-
people, and to gather information on tions, are retained. • CM = consumer magazines
subjects and products. In this way users • RD = radio
mutually influence each other in their • TV = television
purchasing decisions as well as in the • OY = year on year (adjusted com-
Y
assessment of products, brands and parison with previous year)
companies. • dvertising expenditures = gross
A
insertion charges; for direct mail this
For the current analysis, the comments
corresponds to the postal charges.
were gathered from the entire NM Incite
• NP = newspapers
database. They contain posts from forums,
blogs, Facebook, Twitter, YouTube, Flickr etc.
7 Copyright © June 2012 Nielsen Media Research GmbH
- 8. About Nielsen
Nielsen Holdings N.V. (NYSE: NLSN) is a global information
and measurement company with leading market positions in
marketing and consumer information, television and other
media measurement, online intelligence, mobile measurement,
trade shows and related properties. Nielsen has a presence in
approximately 100 countries, with headquarters in New York, Keep an
USA and Diemen, the Netherlands.
eye on
For more information, visit:
www.nielsen.com all media
with Nielsen!
Contact
Nielsen Media Research GmbH
Sachsenstrasse 16
20097 Hamburg, Germany Tanja Panten
t: +49 (0) 40 - 236 42-0 t: +49 (0) 40 - 236 42-347
f: +49 (0) 40 - 236 42-122 f: +49 (0) 40 - 236 42-122
e: info@nielsen.com e: tanja.panten@nielsen.com
Follow us ... and discover more exciting insights
Click now
http://blog.nielsen.com/nielsenwire/online_mobile
European consumers have a stronger reaction to mobile
advertising than U.S. consumers
One third of users in Germany have already purchased online following
http://twitter.com/Nielsen_Germany mobile advertising
Surfing in front of the TV: Worldwide trends in dual
screening
http://www.facebook.com/NielsenGermany Americans are the world champions of using TV and mobile devices in
parallel
Over one quarter of users in Germany use tablet computers even while
they are watching TV
Coverage of movie portals, social media posts, and visitor
numbers at the movies are connected
Visit us at the
on 12 and 13 September in Cologne Shopper Sentiment: How Consumers Feel About Shopping
Hall 8.1, Stand 018 In-Store, Online, and via Mobile
www.nielsen.com/de
Copyright © June 2012 Nielsen Media Research GmbH. All rights reserved. Nielsen and the Nielsen
logo are trademarks or registered trademarks of CZT/ACN Trademarks, L.L.C. Other product and
service names are trademarks or registered trademarks of their respective companies.