
Recommended
Recommended
More Related Content
What's hot
What's hot (20)
Similar to Flevy.com - World's First Research Report-cum-Financial Model
Similar to Flevy.com - World's First Research Report-cum-Financial Model (20)
More from David Tracy
More from David Tracy (20)
Recently uploaded
Recently uploaded (20)
Flevy.com - World's First Research Report-cum-Financial Model
- 1. Multi Commodity Exchange of India Ltd. 27-2-2012 Research Report-cum-Financial Model India - Large Cap - Financial Sector Multi Commodity Exchange of India Ltd. operates MCX, India's leading commodity futures exchange, and is going public. Analyst's Note We introduce herewith a new presentation format - 'Fusion of a Research Report and a Financial Model' - 'possibly' for the first time in the global research community. Please excuse us, if you've seen a similar format earlier! Please refer the Disclaimer sheet. This research report-cum-financial model contains a wealth of information about commodity futures exchanges as an industry, the regulatory environment in India, trading volumes, business model, strengths, financials and earnings estimates of MCX, and global peer financial highlights and valuations. This document is an unlocked spreadsheet and is print-ready. Bonus: our proprietary 'IPO Analysis Checklist' is included. The IPO will list soon in India and we believe this report-cum-customizable model will remain relevant. Just plug in the current stock price, make changes in underlying assumptions or earnings estimates as per your own views, in the relevant sheets, to arrive at valuations, incl. DCF, and target price. Index IPO Analysis Checklist IPO Highlights Investment Case & Concerns Industry Volumes - MCX v/s NSE Business Model Issue Details Shareholdings Assumptions Consolidated P&L Consolidated Balance_Sheet Consolidated CashFlows DCF Workings Valuation Matrix Global Peers Disclaimer © All rights reserved Nitin A. Khandkar, Founder Mumbai, India nitin.k.ier @ gmail . com
- 2. Multi Commodity Exchange of India Ltd. Checklist of Data Points relevant to the Analysis of the IPO Sr. Name of Data Point Data for MCX No. 1 Year of Incorporation 2002 2 Year of Commencement of Operations 2003 3 No. of years of track record 8 4 Management background and expertise, if any Promoted by Financial Technologies 5 Focus segments Commodity futures trading 6 Segment information - revenues, EBIT margins, profits No segments 7 Geographical breakup of revenues, if any None 8 % of Revenues coming from group companies, if any Some transactions with FTIL 9 Whether present in any unrelated business No 10 Market share within industry ~87% share of trading volumes 11 Whether inorganic growth contemplated Not indicated 12 Promoters’ average cost of acquisition of the company’s shares, pre-IPO Low vis-à-vis IPO price 13 Extent of dilution of promoters' stake via the IPO 5.2% 14 Names of pre-IPO investors See "Shareholdings" worksheet 15 Pre-IPO investors’ average cost of acquisition (adjusted for bonus issue) FID: `480 per share (in 2006) 16 Pricing of Investments by pre-IPO investors within 12 months before IPO Does not apply 17 Whether any pre-IPO investor exiting partly or fully via IPO Yes, see "Shareholdings" worksheet 18 Revenue mix for last 5 years Does not apply 19 Client concentration data Does not apply 20 Order book position Does not apply Utilization of IPO proceeds 21 Breakup of Capex into plant, buildings, etc. No fresh issue, no funds infusion 22 Status of machinery required, ordered and received as of RHP date Does not apply 23 Amount to be utilised for non-critical purposes Does not apply 24 Gap in fund raising programme if any (IPO + Debt - Capex) Does not apply Expansion project 25 Time lag between date of IPO and completion of expansion project Does not apply
- 3. Financials 26 Consolidated and Standalone P&L, Bal Sheet for last 3 / 5 full years See relevant worksheets 27 Consolidated and Standalone P&L, Bal Sheet for latest 3 / 6 months See relevant worksheets 28 Quality of disclosures Good 29 Ratio analysis Good margins, see relevant worksheets 30 EV computation See relevant worksheets 31 EPS computation See relevant worksheets 32 Comments on Financials Good growth trajectory 33 Peer comparison - Installed Capacities, production, utilisation See relevant worksheets - Market shares See relevant worksheets Post-listing 34 Free float - absolute no. of shares 37,738,794
- 4. Comments The gap between date of incorporation and commencement of ops should not be too wide Professional qualifications and relevant experience of management Identify relationships that can hamper profitability Should not have unrelated diversifications The market leadership position can result in a valuation premium Likely impact in terms of equity dilutions or higher leverage Mention specifically in Exec Summary, highlight huge discount to IPO price Mention if dilution is substantial Highlight in case of good VC / PE names Mention specifically in Exec Summary, highlight huge discount to IPO price Mention specifically in Exec Summary, highlight huge discount to IPO price Since not a positive sign, highlight if substantial Provide table Provide table Review revenue visibility over next 2 years Highlight in case of gap between required, ordered and received General corporate purposes, etc. Highlight if substantial To determine how soon cash flows will begin to kick in
- 5. Return ratios, turnover ratios, others Consider Mcap post issue, cash and debt as of latest bal sheet, annualise EBITDA Make estimates, else annualise quarterly / half yearly profit, take post IPO equity Highlight revenue growth, dramatic changes in margins, leverage, ROE etc. Follow identical EPS computation for peers Mention period of financial statements clearly, below the comparison table Highlight if no. of free float shares too small - exit may be difficult for QIBs
- 6. Multi Commodity Exchange of India Ltd. IPO Highlights Mode of Issue Offer for Sale by Selling Shareholders Issue Size (Amount) at floor / cap price `5.53bn (~$112.3mn) / `6.63bn (~$134.7mn) Issue Size (No. of Shares) 6.427mn Equity Shares of `10 each Equity Dilution 12.6% of Equity Capital Price Band `860 - 1032 per Equity Share Subscription Period February 22 - 24, 2012 BRLMs Edelweiss, Citigroup, Morgan Stanley Grading 5/5 (CRISIL) Market Cap (at floor/cap price) `43.9bn ($891mn)/ `52.6bn ($1.07bn) Free Float Market Cap (at floor/cap price) `32.5bn ($659mn)/ `38.9bn ($791mn) Listing The Stock Exchange, Mumbai (BSE) only
- 7. Multi Commodity Exchange of India Ltd. Executive Summary Multi Commodity Exchange of India Ltd. (MCEIL) operates MCX, the predominant, No. 1 commodity futures exchange in India, which 1 offers trading in a wide range of commodity futures (49 commodities as of December 31, 2011). MCX is the also the fifth largest commodity futures exchange globally, in terms of the number of contracts traded and among the 2 leading commodity exchanges in the world, in terms of trading volumes of certain commodities. MCEIL has been promoted by Financial Technologies India Ltd. (FTIL), a leading software developer in India, which is a technical 3 service provider to automated electronic markets in the areas of foreign exchange, commodities, debts, treasuries, securities, banking and insurance. The rising popularity of commodity futures trading in India can be gauged by the fact that while the NSE’s cash market segment saw a decline in trading volumes from `36,577bn in 2010, to `27,633bn in 2011, the value of commodity futures contracts traded on the 4 MCX went up from `86,969bn in 2010, to `149,329bn in 2011. Though not strictly comparable, the average daily trading volumes on the MCX are also substantially higher than in the cash segment on the NSE. We therefore view MCEIL as an ideal play on the fast growing commodities futures trading segment in India. While commodities 5 futures may involve some amount of risk, an investment in the underlying exchange itself, where these futures contracts get traded, is an ideal hedge against the risks associated with futures trading. While the IPO is via an offer for sale by FTIL and some institutional investors, all of these are only partly reducing their stake, and not 6 exiting the company fully. As such the proceeds of the IPO will not go to the company, nor is there an equity dilution. The last issue by MCEIL to an outside investor for cash was to FID Funds Mauritius Ltd. (a Fidelity International affiliate) at an ex- 7 bonus price of `480 per share, in February, 2006. No major equity dilution has taken place during the last 3 years, except allotments made to the company’s ESOP trust, and a bonus issue (1:4) in March, 2011. 8 Investment Positives a Dominant market share within commodity futures exchanges in India. Rising trading volumes: Value of futures contracts traded at MCX grew at 52.3% CAGR between 2007 and 2011. Incidentally, trading b volumes at MCX are much higher than those in the capital market segment at NSE, though the former is a derivatives exchange, while the latter is a cash equities trading exchange. Stock or futures exchanges are inherently profitable the world over, since revenues far outstrip costs, leading to high EBITDA margins. We believe MCX’s business model is almost risk-free, since sizeable revenues are assured as long as trading volumes remain c robust. Given its favourable variable cost structure, high EBITDA margins can be considered sustainable. In addition, sizeable recurring ‘other income’ will continue to add to profitability.
- 8. In spite of its focus on technology, MCEIL’s recurring capital expenditure in fixed assets (`8.40Cr, `23.56Cr and `17.89Cr in FY10, d FY11 and FY12 YTD respectively) is low vis-à-vis its balance sheet size. We believe MCEIL may either not need to invest heavily in capex going forward, or may be comfortably able to meet the same, from operating cash flows. MCEIL is a zero-debt, cash-rich company, with a strong reserves position. We expect it to continue to enjoy comfortable return ratios, e i.e., RoE and RoCE, going ahead (see sheet 'Consolidated P&L' ). We believe MCX may not require a major funds infusion in the next couple of years, by virtue of its sustainable, recurring net operating cash inflows. f The fact that there is no listed peer for MCX in India, may possibly lead to some valuation premium on listing. 9 Investment Concerns Over 90% of MCEIL’s revenues (96.1% in 9 months to December 31, 2011) constitute transaction fees, which are directly linked to i trading volumes. As such, the company’s revenue generating ability may be hampered in case of reduction in trading volumes. However, as stated above, MCEIL continues to generate sizeable, recurring other income. Just four commodities, viz., silver, gold, crude oil and copper, account for over 80% of MCX’s turnover by value (90.4% in 9 months to ii December 31, 2011). We view this concentration as a risk, in case prices of any of these commodities, already at high levels, were to crash. Under Indian regulations, foreign institutional investors (FIIs), banks and mutual funds cannot trade on commodity exchanges. Also, trading in commodities options is prohibited. This may suppress the valuation premium on the IPO. However these very concerns iii can well become kickers for the stock going forward, if and when the authorities permit these investors to trade on the MCX and also permit options trading. The IPO will list on the BSE only. At a structural level, absence of dual listing (NSE as well as BSE) may possibly impact price discovery on listing, and cap future price performance, though not immediately on listing, since it has been observed historically that iv stocks listed only on the BSE see lesser liquidity and poorer price performance over a period of time, vis-à-vis stocks listed on both exchanges. Based on our EPS estimates of `55.51 (FY12E) and `67.68 (FY13E), the IPO was priced at 18.6x FY12E and 15.2x FY13E on the basis of the cap price. Global leading commodity futures exchanges trade in the range of 9.9x - 16.6x CY12E (see worksheet 'Global Peers' ). 10 However by virtue of the relatively low revenue base vis-à-vis global peers, MCEIL will see higher revenue growth in % terms. We had a Subscribe rating on the IPO. The rating will change on listing, depending on the valuations (absolute, and relative to global peers) post-listing.
- 9. Multi Commodity Exchange of India Ltd. Commodity Futures Industry Overview Futures contracts are derivative products that provide means for hedging and asset allocation. The asset underlying futures contracts could be a physical asset (e.g. agricultural commodity) or a financial asset (e.g. interest rates, foreign exchange products 1 and stock indices). A commodity (as traded on an exchange) is an undifferentiated product whose market value arises from the owner‘s right to sell the product rather than the right to use the product. Commodities traded globally on exchanges include crude oil, gold, copper and agricultural products such as wheat, corn and soybeans. Commodity futures contracts are commitments to make or accept delivery of a specified quantity and quality of a commodity at a set time in the future for a price established at the time the commitment is made. The buyer agrees to take delivery of the underlying commodity, while the seller agrees to make delivery. In practice, futures markets are rarely used to actually buy or sell 2 the physical commodity being traded and only a small number of contracts traded worldwide each year result in delivery of the underlying commodity. Instead, traders generally offset (a buyer will liquidate by selling the contract, the seller will liquidate by buying back the contract) their futures positions before their contracts mature. Commodity futures contracts are primarily made available through a centralized trading or computerized matching process, with bids and offers on each contract traded publicly. Through this process, a prevailing futures market price is reached for each 3 commodity futures contract, based primarily on the laws of anticipated supply and demand. Many markets abroad also offer trading in options contracts in commodities. The Global Commodity Futures Market There are over 30 commodity futures and options exchanges worldwide that trade commodities ranging from energy, metals, agriculture to livestock in countries including the United States, China, Japan, Malaysia and the United Kingdom. (Source: Futures a Industry Association (FIA), FI magazine September 2011) . The commodity exchanges trade in physical commodity products, as well as in financial instruments. Trading is mostly done in futures and options contracts. Spot trading calls for immediate delivery of a specified commodity and is often used to obtain the goods necessary to fulfil a seller‘s delivery obligations under futures contracts. According to the FIA Report, strong levels of growth were seen in the trading volume of commodity futures and options, especially b those relating to non-precious metals, agricultural, energy and precious metals commodities.
- 10. Recent times have seen a distinct shift futures and options trading from non-precious metals and agri commodities, to precious metals and energy. The trading volume of futures and options contracts of precious metals rose by 49.8% to 127.49mn contracts for c the six months ended June 30, 2011 y-o-y, and that of futures and options contracts of energy products rose by 16.0% to 416.24mn contracts for the same period. The trading volume of futures and options contracts of non-precious metals decreased by 37.7% to 190.37mn, while that of agricultural commodities decreased by 9.1% to 529.59mn contracts during the same period. Metals Futures Metal futures contracts include a wide variety of metal commodities, classified into precious metals (incl. gold, silver and platinum) and non-precious metals (incl. lead, aluminium, copper and zinc). Gold is the most popular precious metal in metal futures contracts trading. Trading in gold futures provides individual investors with an easy and convenient alternative to the traditional means of investing in gold, such as bullion, coins, and mining stocks. In addition, a broad cross-section of companies in the gold industry, from mining companies to fabricators of finished products, can use gold futures contracts to hedge their price risk. Energy Futures Energy futures contracts include energy commodities such as crude oil, natural gas, heating oil, gasoline and coal. Over the past several years, the markets for energy commodities trading have been characterised by rapid growth and high liquidity, which can be attributed to: · increased market acceptance of the value of commodity futures as risk management tools, · greater access to futures markets through technological innovation, · increased price fluctuation in crude oil and natural gas, · increased demand for commodities as a distinct asset class for portfolio diversification, · increased participation in energy markets by financial institutions, such as banks and hedge funds, · increased awareness of the ability to obtain or hedge market exposure through the use of futures and options contracts, · changes in the regulatory environment of energy markets around the world, specifically electricity and natural gas.
- 11. Caps on Foreign Investments in the Commodity Exchanges Sector in India Foreign investment is permitted in commodity exchanges with the following restrictions: a) Foreign direct investment up to 49.0% is allowed under the Government route as follows: (i) Investment by registered foreign institutional investors under the Portfolio Investment Scheme will be limited to 23.0%, (ii) Investment as FDI under the FDI Scheme will be limited to 26.0%, b) Foreign institutional investors’ purchases shall be restricted to the secondary market only, c) No non-resident investor or entity, including persons acting in concert, shall hold more than 5.0% of the equity in commodity exchanges. Further, foreign direct investment (FDI) is allowed in commodity exchanges only with the prior approval of the Foreign Investment Promotion Board (FIPB). Furthermore, transfer of shares between non-residents and residents are freely permitted, subject to certain restrictions. Other Commodity Exchanges in India Currently there are 21 commodity exchanges and associations in India, which are recognised by the Government of India and authorised to organise and regulate futures trading in various commodities. Of these exchanges, 16 are regional or localised exchanges, which are spread across India. Most of these regional exchanges practice the open-outcry system. Some of these regional exchanges trade in just a few commodities. The five national multi-commodity exchanges, namely MCX, NCDEX, NMCE, ICEX and ACE offer electronic trading in numerous commodity futures contracts. Four of these exchanges, viz., MCX, NCDEX, NMCE and ICEX, accounted for 98.8% of the turnover of commodity futures contracts traded in India during FY10. These five national multi-commodity exchanges (including ACE, which was started in October 2010) accounted for 99.4% and 99.7% of the turnover of commodity futures contracts traded in India for FY11 and the nine months ended December 31, 2011, respectively. National Commodity and Derivatives Exchange Ltd. (NCDEX) NCDEX commenced operations in December 2003. According to FMC data, 34 and 29 commodities were traded on NCDEX for FY11 and 9 months ended Dec. 31, 2011, respectively. National Multi Commodity Exchange of India Ltd. (NMCE) NMCE was India‘s first demutualised national multi-commodity exchange, having commenced futures trading in November 2002. According to FMC data, 24 and 26 commodities were traded on NMCE for FY11 and 9 months ended Dec. 31, 2011, respectively.
- 12. Indian Commodity Exchange Ltd. (ICEX) ICEX received FMC approval to begin operations as a national bourse in October 2009. ICEX commenced trading operations in November, 2009. According to FMC data, 14 and 13 commodities were traded on ICEX for FY11 and 9 months ended Dec. 31, 2011, respectively. ACE Derivatives & Commodity Exchange Ltd. (ACE) Ace Derivatives and Commodity Exchange, which transformed from a regional exchange to a national multi-commodities futures trading platform, was launched in October, 2010. Six and eight commodities were traded on ACE for FY11 and 9 months ended Dec. 31, 2011, respectively. Industry Growth in India Commodity futures trading in India has grown multi-fold since the Government of India permitted futures trading in commodities in April, 2003. The total value of commodities futures traded in India in FY11 was `119,489bn, up ~90x the value of commodity futures contracts traded in FY04, which was `1,294bn. Commodity futures trading volumes have risen at a CAGR of 90.9% between FY04 and FY11. There are currently over 60 commodities futures that have been approved by the FMC for trading during the calendar year 2011 with gold, silver, crude oil, copper, zinc, nickel and natural gas comprising the majority of the trading turnover. Growth Drivers for the Industry Economic growth Government of India initiatives to modernize commodity futures markets Introduction of new commodity classes, particularly intangibles such as freight, rainfall and commodity indices Increased investor participation Technological advancements Introduction of Options: Options trading volumes in the global derivatives markets constituted around 50.8% of the total futures and options volumes traded for the six months ended June 30, 2011. If trading in commodity options are permitted by the Government, it may lead to increased volumes and overall growth in the Indian commodity derivatives market. Certain types of investors precluded from commodities trading; options too prohibited Under the current regulations in India, foreign institutional investors (FIIs), banks and mutual funds cannot trade on commodity exchanges. Also, trading in commodities options is prohibited. While this remains a concern from the point of view of existing investors, we believe this can in fact be a driver of the stock’s valuation going forward, in case the authorities permit these investor classes to trade on commodity exchanges and also permit trading in commodity options.
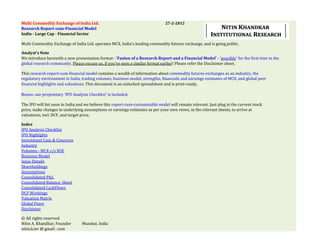
- 13. Multi Commodity Exchange of India Ltd. Comparison of Volumes on MCX and NSE MCX NSE Month Year Commodity Futures Volumes Cash Equities Volumes (`Bn) (USDBn) (`Bn) (USDBn) Jan 2010 5,627 114 3,384 69 Feb 2010 6,170 125 2,451 50 Mar 2010 6,279 128 2,862 58 Apr 2010 6,035 123 2,766 56 May 2010 7,036 143 2,846 58 Jun 2010 7,536 153 2,861 58 Jul 2010 7,528 153 2,786 57 Aug 2010 7,580 154 3,120 63 Sep 2010 7,628 155 3,299 67 Oct 2010 8,477 172 3,605 73 Nov 2010 9,059 184 3,640 74 Dec 2010 8,015 163 2,957 60 Jan 2011 9,198 187 2,673 54 Feb 2011 9,121 185 2,665 54 Mar 2011 11,203 228 2,557 52 Apr 2011 11,614 236 2,283 46 May 2011 11,481 233 2,339 48 Jun 2011 10,487 213 2,225 45 Jul 2011 12,453 253 2,300 47 Aug 2011 17,674 359 2,353 48 Sep 2011 17,682 359 2,353 48 Oct 2011 12,018 244 1,933 39 Nov 2011 13,992 284 2,063 42 Dec 2011 12,405 252 1,889 38 Jan 2012 12,209 248 2,369 48
- 14. 25 75 125 175 225 275 325 375 Jan-10 Mar-10 May-10 Jul-10 Sep-10 Nov-10 MCX (USD bn) Jan-11 Mar-11 May-11 Jul-11 Trading Volumes: MCX v/s NSE NSE (USD bn) Sep-11 Nov-11 Jan-12
- 15. Multi Commodity Exchange of India Ltd. Analyst’s Note This research note attempts to capture the essence of the business model of MCX and some of the investment positives and concerns. Investors are advised to refer the red herring for the IPO, for a better understanding of the company, its business model and risk factors. Company Background MCEIL was incorporated in April, 2002 as a private limited company. FTIL acquired the shareholding of the erstwhile promoters in August, 2003. MCX commenced online futures trading in November 2003. Business Model Overview MCX is the leading commodities exchange in India, based on value of commodity futures contracts traded. Peculiarities of Business Model Contracts traded on the MCX (by value) grew at CAGR of 52.3% during FY07-11, from `2,729,821Cr in FY07, to `14,932,852Cr in FY11. Recent growth in the value of contracts traded on the MCX is largely attributable to growth in the trading volume of key commodities traded on MCX such as gold, silver, base metals and crude oil, the introduction of new commodity futures contracts, increased liquidity in the commodities market and the expansion of MCX’s market as also the resulting increase in its membership base. Concentration of four commodities Turnover of commodity futures contracts traded on MCX (by value) has been concentrated in silver, gold, crude oil and copper, as per following table. FY11 9 mths to Dec.'11 Silver 27.4% 38.2% Gold 25.1% 27.5% Crude Oil 17.9% 15.9% Copper 11.6% 8.8% Total 82.0% 90.4% Any significant decline in the prices of gold, crude oil and silver may therefore impact the futures turnover volumes of these commodities on the MCX, impacting its financial performance in turn.
- 16. We believe gold and silver, in particular, have seen an unprecedented run-up in prices in the last two years. Any correction in these therefore, may likely impact MCX’s volumes. MCX’s trading volumes may be affected primarily by: development of new commodity futures contracts on competing exchanges volatility in commodity prices availability of more electronic trading platforms possible regulatory changes negative publicity and regulatory investigations Subsidiary / Associate Companies Country of Proportion of Ownership Interest Name of Subsidiary / Associate Co. incorporation (as at Dec-31-2011) Multi Commodity Exchange India 100% Clearing Corporation Ltd. (MCX CCL) India 100% SME Exchange of India Ltd. (SME) India 51% MCX-SX Clearing Corporation Ltd. (MCX SXCCL) India 26% Dubai Gold and Commodities Exchange DMCC (DGCX) U.A.E. 5% MCX Stock Exchange Ltd. (MCX-SX) India 5% Global Rankings We note that the MCX compares well with global derivatives exchanges, in terms of volumes of commodity futures contracts. It was ranked 9th among global derivatives exchanges and 5th among global commodity futures exchanges. Rankings Commodity 2011 2011 among Futures (Jan - June) (Jan - June) Name of Commodity Futures Exchange Derivatives Rankings Jan - Volume (mn Change y-o-y Exchanges (Jan - June 2011 contracts) (%) CME Group (includes CBOT & NYMEX) 2 1 352.96 18.1 Zhengzhou Commodity Exchange 11 2 217.58 -0.4 ICE Group (incl. U.S., U.K. and Canadian Markets) 12 3 159.09 18.4 Shanghai Futures Exchange 14 4 128.54 -57.2 Multi Commodity Exchange of India 9 5 127.77 41.5
- 17. Multi Commodity Exchange of India Ltd. `: Indian Rupee Crore = 10 million IPO Details 49.232 per USD Price per No. of Shares Amt. (`Cr) share (`) IPO size 10,000,000 New shares 0 0.00 * Assuming pricing at cap price of ` 1032/share Shares being sold by selling shareholders * 6,427,378 1032 663.31 6,427,378 663.31 134.73 552.8 112.28 Diluted Equity (no. of shares) At Cap price At Floor price Pre-IPO 50,998,369 50,998,369 IPO new shares 0 0 -> dilution Total No. of Shares post-IPO 50,998,369 50,998,369 No. of Shares (Cr) 5.100 5.100 IPO Price ` 1032 1032 1032 860 Market Cap (`Cr) 5263 4386 Market Cap ($mn) 1069 891 Earnings Estimates and Valuations (`Cr) Particulars FY10 FY11 FY12E FY13E Revenues 287.38 368.89 538.81 702.25 EBITDA 141.56 191.76 342.83 429.07 PAT 220.81 176.27 283.10 345.17 Pd up Equity 40.80 51.00 51.00 51.00 EPS (`) 54.12 34.56 55.51 67.68 P/e (x) 19.1 29.9 18.6 15.2 Book value (`) 170.79 166.44 218.35 277.90 P/b (x) 6.0 6.2 4.7 3.1 Price / Sales (x) 14.3 9.77 6.25
- 18. Multi Commodity Exchange of India Ltd. Shareholding Pattern Shareholder Categories Pre-Issue Post-Issue No. of Shares % Holding No. of Shares % Holding Promoters (Financial Technologies Ltd.) 15,903,491 31.2% 13,259,575 26.0% Institutions 16,744,784 32.8% 12,961,322 25.4% Others 16,491,131 32.3% 16,491,131 32.3% Anchor Investors (excl. Domestic MFs) 0 0.0% 617,738 1.2% QIBs excl. Mutual Funds 0 0.0% 2,053,978 4.0% Mutual Funds (incl. Domestic MFs) 0 0.0% 416,973 0.8% Non-Institutional Investors 0 0.0% 926,607 1.8% Employees 0 0.0% 250,000 0.5% Public (Individuals) 1,858,963 3.6% 4,021,045 7.9% Total 50,998,369 100.0% 50,998,369 100.0% 12.6% Free Float 37,738,794 Issue size 6,427,378 Shares `Cr 663.31 Issue Breakup No. of Shares Value $mn Issue size 6,427,378 Reservation for: Employees 250,000 3.9% 5.2 Net IPO 6,177,378 96.1% 129.5 QIBs 3,088,689 48.1% 64.7 - Anchor Investors 926,607 14.4% 19.4 30.0% - QIBs excl. MFs 2,053,978 32.0% 43.1 66.5% - MFs 108,104 1.7% 2.3 3.5% Non-Institutional Investors 926,607 14.4% 19.4 Retail Investors 2,162,082 33.6% 45.3 Total 6,427,378 100.0% 134.7 Breakup of Anchor Investor portion 926,607 - Domestic MFs 308,869 1/3 √ - Non-MF 617,738 2/3 √ Shares sold by Selling Shareholders Financial Technologies 2,643,916 15,903,491 13,259,575 SBI 2,112,025 2,640,031 528,006 GLG Financials 781,508 976,885 195,377 Alexandra Mauritius 390,754 488,442 97,688 Corporation Bank 246,175 1,775,000 1,528,825 ICICI Lombard 148,000 185,000 37,000 Bank of Baroda 105,000 525,000 420,000 TOTAL (excl. FT) 3,783,462 6,590,358 2,806,896
- 19. Post-Issue Market Cap 10000000 No. of Shares 50,998,369 $= 49.232 ` Cap Price per share 1032 `Cr 5263 $mn 1069 1.07 Free float Mcap 3895 Free float Mcap $mn 791 No. of Shares 50,998,369 Floor Price per share 860 `Cr 4386 Free float Mcap 3,246
- 20. Multi Commodity Exchange of India Ltd. Legend: Cr = 10 Million Exchange Rate: USD 1 = INR (`) 49.23 Key Assumptions FY12E FY13E Revenue Growth 46.1% 30.3% Staff costs / Sales 5.1% 5.3% Administration and other operating expenses / Sales 31.2% 33.6% Total Expenditure / Sales 36.4% 38.9% EBITDA margin 63.6% 61.1% Other Income / Sales 17.2% 14.2% Other Income / PBT 22.7% 20.2% Depreciation / Average Net Block 14.2% 17.5% Tax / PBT 30.0% 30.0% PAT / Sales 52.5% 49.2% Rate of Dividend 50% 70% Dividend Payout ratio 10.5% 12.0% Debt-equity Ratio (x) 0.00 0.00 Current Ratio (x) 0.68 1.00 Receivables Collection period days 43 40 Fixed Assets turn (x) 1.7 2.1 RoE 24.3% 23.5% RoCE 27.9% 27.5%
- 21. Multi Commodity Exchange of India Ltd. Earnings Estimates (`Cr) Particulars FY12E FY13E Total Revenues (excl. other income) 538.81 702.25 EBITDA 342.83 429.07 Profit before Depreciation & Taxation 435.47 529.12 Depreciation 27.44 33.44 Profit Before Taxation 408.03 495.68 Total Tax 122.41 141.7 Profit After Taxation 283.1 345.17 EPS (`) 55.51 67.68 CEPS (`) 60.89 74.24 Book-value (`) 218.35 277.9 EBITDA margin 63.6% 61.1% RoE 24.3% 23.5% RoCE 27.9% 27.5% Source: Nitin Khandkar Institutional Research
- 22. Multi Commodity Exchange of India Ltd. (`Cr) Consolidated P&L Statements for period ending, 31-3-2009 31-3-2010 31-3-2011 31-12-2011 31-3-2012 31-3-2013 Income Transaction fees 186.10 264.08 349.54 386.82 518.34 673.84 Membership Admission fees 10.52 6.96 3.51 4.14 5.14 7.70 Annual subscription fees 13.59 13.62 13.47 9.88 13.34 18.01 Terminal charges 2.24 2.72 2.36 1.50 2.00 2.70 Income from Operations 212.45 287.38 368.89 402.33 538.81 702.25 Growth 35.3% 28.4% 46.1% 30.3% Expenditure Staff costs 25.43 21.75 26.43 20.14 27.65 37.52 Administration and other operating expenses 110.61 124.08 150.70 121.68 168.33 235.66 Total Expenditure 136.04 145.83 177.13 141.82 195.98 273.18 EBITDA 76.41 141.56 191.76 260.52 342.83 429.07 Other Income 153.40 206.32 78.67 72.17 92.64 100.05 Interest 0.18 0.04 0.02 0.00 0.00 0.00 Profit before Depreciation & Tax 229.62 347.83 270.41 332.68 435.47 529.12 Depreciation/ Amortisation 19.96 24.74 24.66 20.44 27.44 33.44 Net profit before tax 209.67 323.09 245.75 312.24 408.03 495.68 Provision for tax -Current tax 45.27 100.43 70.35 91.44 -Prior period tax 0.00 0.00 0.20 -2.72 -Deferred tax 6.31 1.91 2.08 2.98 -Wealth tax 0.03 0.03 0.02 0.02 -Fringe benefit tax 0.64 0.00 0.00 0.00 Total Tax 52.25 102.37 72.65 91.71 122.41 148.70 Net Profit after Tax before Share of Profit of 157.42 220.73 173.10 220.53 285.62 346.97 Associate Share of Profit of Associate 0.04 0.30 0.26 0.14 0.20 0.20 Net Profit after Tax 157.46 221.02 173.36 220.67 285.82 347.17 Impact of prior period adjustments 1.38 -0.21 2.92 -2.72 -2.72 -2.00 Net Profit, as restated 158.84 220.81 176.27 217.95 283.10 345.17 Growth 39.0% -20.2% 60.6% 21.9% EPS (`) 31.44 43.29 34.56 42.74 55.51 67.68 CEPS (`) 43.48 60.17 38.78 47.25 60.89 74.24 Book value (`) 121.00 170.79 166.44 210.57 218.35 277.90
- 23. Consolidated P&L Statements for period ending, 31-3-2009 31-3-2010 31-3-2011 31-12-2011 31-3-2012 31-3-2013 Cap Price 1032 1032 1032 1032 1032 P/e (x) 18.6 15.2 P/b (x) 4.7 3.7 P/s (x) 9.8 7.5 Floor Price 860 860 860 860 860 P/e (x) 15.5 12.7 P/b (x) 3.9 3.1 P/s (x) 10.2 7.8 EBITDA margin 36.0% 49.3% 52.0% 64.8% 63.6% 61.1% Staff costs / Income from Operations 12.0% 7.6% 7.2% 5.0% 5.1% 5.3% Administration & other op. exps. / Income from Operations 52.1% 43.2% 40.9% 30.2% 31.2% 33.6% Total Expenditure / Income from Operations 64.0% 50.7% 48.0% 35.2% 36.4% 38.9% Other Income / Sales 72.2% 71.8% 21.3% 17.9% 17.2% 14.2% Other Income / PBT 73.2% 63.9% 32.0% 23.1% 22.7% 20.2% Depreciation / Average Net Block 12.3% 12.7% 14.2% 17.5% Tax / PBT 24.9% 31.7% 29.6% 29.4% 30.0% 30.0% PAT/ Income from Operations 74.8% 76.8% 47.8% 54.2% 52.5% 49.2% ROE 29.7% 29.9% 19.6% 19.4% 24.3% 23.5% ROCE 11.2% 16.5% 19.4% 22.0% 27.9% 27.5% Payout Ratio 15.0% 10.8% 16.8% 0.0% 10.5% 12.0% Revenue Breakup Transaction fees 87.6% 91.9% 94.8% 96.1% 96.2% 96.0% Membership Admission fees 5.0% 2.4% 1.0% 1.0% 1.0% 1.1% Annual subscription fees 6.4% 4.7% 3.7% 2.5% 2.5% 2.6% Terminal charges 1.1% 0.9% 0.6% 0.4% 0.4% 0.4% Income from Operations 100.0% 100.0% 100.0% 100.0% 100.0% 100.0% Balance brought forward from previous year, as restated 89.02 208.02 382.86 512.10 Profit before appropriation, as restated 247.86 428.83 559.13 730.05 Appropriations: Proposed dividend 20.40 20.40 25.50 0.00 25.50 35.70 Final dividend of earlier year 0.13 0.00 0.00 0.00 0.00 0.00 Corporate dividend tax 3.49 3.39 4.14 0.00 4.14 5.79 16.22% 16.22% 16.22% EBIT 56.45 116.81 167.10 240.08 315.39 395.63 EBIT margin 26.6% 40.6% 45.3% 59.7% 58.5% 56.3%
- 24. Multi Commodity Exchange of India Ltd. (`Cr) Consolidated Balance Sheets as at, 31-3-2009 31-3-2010 31-3-2011 31-12-2011 2012E 2013E Sources of Funds Shareholders' funds Paid-up Equity Share Capital 40.80 40.80 51.00 51.00 51.00 51.00 Stock Option Outstanding Account 0.02 0.00 0.00 0.00 0.00 0.00 Reserves and Surplus -Securities Premium 226.47 227.04 216.84 216.84 216.84 216.84 -Amount recoverable from MCX ESOP Trust -22.10 -16.53 -11.13 -4.05 0.00 0.00 -Settlement Guarantee Fund 1.51 1.63 1.75 1.87 1.87 1.87 -General Reserves 38.93 61.01 78.29 78.29 78.29 78.29 -Balance in Profit and Loss Account 208.02 382.86 512.10 729.93 765.56 1069.24 493.65 696.81 848.85 1073.88 1113.56 1417.24 Minority interest 0.00 0.00 0.00 0.05 0.05 0.05 Deferred tax liability (net) 8.72 10.63 12.71 15.69 15.69 20.69 Total Liabilities 502.37 707.44 861.56 1089.61 1129.25 1437.93 Applications of Funds Fixed Assets Gross Block 259.48 267.88 291.65 309.54 314.54 339.54 Less: Depreciation 50.89 75.36 96.36 116.54 122.80 148.98 Net Block 208.59 192.52 195.30 193.01 191.75 190.57 Capital Work-in-progress 0.27 0.27 0.05 0.04 2.00 2.00 Net Fixed Assets 208.86 192.79 195.35 193.05 193.75 192.57 Investments 469.82 617.02 823.74 1095.81 1145.81 1245.81 Current Assets, Loans and Advances Sundry Debtors 26.90 30.38 48.87 49.40 61.09 74.10 Cash and Bank Balances 405.85 270.05 331.17 228.57 279.99 666.78 Other Current Assets 9.17 7.83 11.31 9.67 12.59 7.79 Loans and Advances 45.24 110.79 89.66 96.09 99.00 113.85 Total Current Assets 487.17 419.06 481.01 383.73 452.67 862.53
- 25. Consolidated Balance Sheets as at, 31-3-2009 31-3-2010 31-3-2011 31-12-2011 2012E 2013E Current Liabilities and Provisions Current liabilities and provisions 663.48 521.42 638.55 582.98 662.98 862.98 Net Current Assets -176.31 -102.36 -157.53 -199.25 -210.31 -0.45 Total Assets 502.37 707.44 861.56 1089.61 1129.25 1437.93 Check 0.00 0.00 0.00 0.00 0.00 0.00 Incremental Capex (`Cr) 8.40 23.56 17.89 6.96 25.00 Current Ratio 0.73 0.80 0.75 0.66 0.68 1.00 Fixed Assets turn (x) 0.82 1.07 1.26 1.30 1.71 2.07 Receivables turnover (days) 52.75 41.99 51.03 46.62 43.01 40.14
- 26. Multi Commodity Exchange of India Ltd. (`Cr) Cash Flow Statements for period ended 31-3-2009 31-3-2010 31-3-2011 31-12-2011 31-3-2012 31-3-2013 Cash Flow from Operating Activities Net profit before tax, as restated 210.91 323.09 245.75 312.24 408.03 495.68 Adjustments for: Depreciation/Amortization 19.96 24.74 24.66 20.44 27.44 33.44 Interest expense 0.18 0.04 0.02 0.00 0.00 0.00 Dividend from investments -26.02 -14.44 -32.27 -30.87 -36.87 -40.56 Diminution in value of investments 7.20 0.63 0.00 0.34 0.00 0.00 Profit on sale of investments (net) -91.37 -147.26 -5.63 -8.16 -9.16 -14.16 Loss on sale of assets or assets scrapped (net) 0.29 0.07 1.34 0.14 0.20 0.50 Advertisement expense (service tax set off availed) 0.00 0.56 0.00 0.00 0.00 0.00 Interest income -17.12 -22.05 -17.36 -14.04 -20.86 -25.03 Operating profit before working capital changes 104.03 165.39 216.52 280.09 368.78 449.87 Adjustments for: (Increase)/decrease in trade and other receivables -17.64 -56.60 -5.56 11.86 -12.22 -13.02 (Decrease)/increase in trade payables and provisions 224.48 -145.32 113.57 -46.19 24.43 200.00 Cash generated from / (used in) operations 310.86 -36.53 324.53 245.76 380.99 636.85 Tax paid -25.55 -55.35 -54.57 -82.06 -122.41 -148.70 Net Cash generated from / (used in) Operating Activities 285.31 -91.87 269.96 163.70 258.59 488.15 Cash Flow from Investing Activities Additions to fixed assets -75.75 -9.63 -31.22 -18.74 -5.00 -25.00 Deletion / Adjustment to Fixed Assets 3.38 0.90 2.66 0.46 0.50 0.50 Purchase of investments -11,090.74 -9,934.56 -10,926.86 -10,544.67 -50.00 -100.00 Redemption/sale of investments 11,014.53 9,942.09 10,678.41 10,369.94 Dividend from investments 26.02 14.44 32.27 30.87 36.87 40.56 Interest received 9.70 23.39 13.87 15.68 20.86 25.03 Cash generated from / (used in) investing activities -112.86 36.62 -230.86 -146.46 3.23 -58.91 Tax Paid -24.22 -48.90 -1.77 -0.87 -1.00 -1.00 Net Cash generated from / (used in) Investing Activities -137.08 -12.27 -232.63 -147.33 2.23 -59.91
- 27. Cash Flow Statements for period ended 31-3-2009 31-3-2010 31-3-2011 31-12-2011 31-3-2012 31-3-2013 Cash Flow from Financing Activities Proceeds from: -Equity share capital 1.56 0.00 0.00 0.00 0.00 0.00 -Securities premium 21.26 0.01 0.00 0.00 0.00 0.00 -Minority Shareholders of Subsidiary Company 0.00 0.00 0.00 0.05 0.05 0.05 Share issue exps adj. in Securities Premium Account -6.30 0.00 0.00 0.00 0.00 0.00 Dividend paid (including tax thereon) -4.74 -23.86 -23.79 -29.64 -29.64 -41.49 Interest paid -0.18 0.00 -0.02 0.00 0.00 0.00 Net Cash generated from / (used in) Financing Activities 11.59 -23.85 -23.81 -29.59 -29.59 -41.45 Net cash (outflow) / inflow during the year 159.82 -128.00 13.52 -13.22 231.22 386.79 Cash and cash equivalents (opening balance) 16.65 176.47 48.47 61.99 48.77 279.99 Cash and cash equivalents (closing balance) 176.47 48.47 61.99 48.77 279.99 666.78 Net Increase/ (Decrease) in Cash and Cash Equivalents 159.82 -128.00 13.52 -13.22 231.22 386.79
- 28. Multi Commodity Exchange of India Ltd. DCF Workings (`Cr) FY10 FY11 FY12E FY13E FY14E FY15E FY16E FY17E FY18E FY19E FY20E FY21E Revenues 287.38 368.89 538.81 702.25 877.81 1053.37 1264.04 1453.65 1671.70 1838.87 2022.76 2225.03 2447.53 Growth 28.4% 46.1% 30.3% 25.0% 20.0% 20.0% 15.0% 15.0% 10.0% 10.0% 10.0% 10.0% EBIT 116.81 167.10 315.39 395.63 438.90 526.69 568.82 654.14 752.26 735.55 809.10 890.01 979.01 EBIT Margin 40.6% 45.3% 58.5% 56.3% 50.0% 50.0% 45.0% 45.0% 45.0% 40.0% 40.0% 40.0% 40.0% Depreciation 24.74 24.66 27.44 33.44 36.11 39.00 42.12 45.49 49.13 53.06 57.31 61.89 66.84 Fixed Assets Investment -9.63 -31.22 -5.00 -25.00 -25.00 -25.00 -25.00 -25.00 -25.00 -25.00 -25.00 -25.00 -25.00 NWC Change -201.91 108.01 12.21 186.98 196.33 206.15 216.45 227.28 238.64 250.57 263.10 276.26 290.07 FCFF -69.99 268.56 350.04 591.05 646.35 746.83 802.40 901.91 1015.04 1014.18 1104.51 1203.16 1310.93 WACC 14.3% 14.3% 14.3% 14.3% 14.3% 14.3% 14.3% 14.3% 14.3% 14.3% Projection Year 1 2 3 4 5 6 7 8 9 10 Discount Factor 0.87 0.77 0.67 0.59 0.51 0.45 0.39 0.34 0.30 0.26 PV of Free Cash Flows 306.20 452.25 432.61 437.26 410.94 404.05 397.76 347.65 331.18 315.57 3037.45 Intrinsic Value Sum of PV of FCFF (Explicit Forecast) 3,835 WACC 14.3% Terminal Growth Rate 3% PV of Terminal Cash Flow 3,037 Enterprise Value (EV) 6,873 Less: Total Debt 0 Add: Cash & Cash Equivalent 331 Intrinsic Value (`Cr) 7,204 No. of Shares (Cr) 5.0998 Fair Value per Share (`) 1,413 Current Price (`) 1,032 Under/(Over) Valued 36.9% Risk-free rate 8.2% Cost of Debt 13.0% Beta 0.9 Effective tax rate 30.0% Market rate of return 15.0% C(E) 14.3% Net Cost of Debt 9.1% W(E) 100.0% W(D) 0.0% WACC 14.3% Perpetual Growth 3.0% Weights Total Debt 0.00 Total Shareholder's Equity 1,113.56 We 100.0% Wd 0.0%
- 29. Multi Commodity Exchange of India Ltd. Valuations based on cap and floor price of the IPO Particulars FY12E FY12E FY13E FY13E Cap/Floor price (`) 1032 860 1032 860 Consolidated PAT (`Cr) 283.10 283.10 345.17 345.17 EPS (`) 55.51 55.51 67.68 67.68 Book-value (`) 218.35 218.35 277.90 277.90 P/e (x) 18.6 15.5 15.2 12.7 P/b (x) 4.7 3.9 3.7 3.1 FY12E FY13E EV Market Cap 5263.03 5263.03 Debt 0.00 0.00 Cash 279.99 666.78 EV 4983.04 4596.25 EBITDA 342.83 429.07 EV/EBITDA (x) 14.5 10.7
- 30. Multi Commodity Exchange of India Ltd. Global Peer Comparion Inter Figures in $bn, except as NYSE CBOE CME Group continental NASDAQ OMX MCX stated otherwise Euronext Holdings Exchange Ticker CME ICE NYX NDAQ CBOE MCX 49.232 Price ($) [Feb-22-2012] 290 133 29 27 27 21 52-wk High / Low 317 / 225 135 / 103 42 / 22 30 / 20 30 / 22 Market Cap ($bn) 19.2 9.7 7.7 4.7 2.4 1.1 Sales ttm 3.28 1.33 4.18 3.44 0.51 0.08 EBITDA ttm 2.28 0.91 1.25 0.88 0.28 0.05 PAT ttm 1.81 0.51 0.62 0.39 0.14 0.04 Diluted EPS ($) ttm 17.03 6.90 2.36 2.15 1.52 0.87 Book value ($) ttm 325.93 43.10 25.53 28.43 2.66 4.28 P/e ttm (x) 17.0 19.3 12.3 12.6 17.8 24.1 P/b ttm (x) 0.9 3.1 1.1 0.9 10.2 4.9 Sales CY12E 3.34 1.44 2.62 1.77 0.53 0.14 EPS ($) CY12E 17.77 8.01 2.61 2.72 1.65 1.37 P/e (x) 16.3 16.6 11.1 9.9 16.4 15.2 P/s (x) 5.7 6.7 2.9 2.6 4.6 7.5 EV ($bn) 20.5 9.8 9.3 9.8 2.3 1.0 EV/EBITDA ttm (x) 9.0 10.8 7.4 11.1 8.4 19.3 EBITDA margin ttm 69.5% 68.3% 29.9% 25.5% 54.3% 64.8% Dividend Payout ratio 21.0% - 51.0% - 28.0% 16.8% Notes: MCX financials are for the period of 9 months ended December 31, 2011; earnings not annualized Estimates for companies other than MCX: Street consensus estimates (source: internet) * MCX estimates are for FY13E (source: Nitin Khandkar Institutional Research) Domestic Market Share Data by Trading Volumes Exchange FY10 FY11 9 mths to Dec-31-11 Turnover Market Turnover Market Turnover Market (`Cr) Share (%) (`Cr) Share (%) (`Cr) Share (%) MCX 6,393,303 82.30% 9,841,503 82.40% 11,980,689 87.30% NCDEX 917,585 11.80% 1,410,602 11.80% 1,287,554 9.40% NMCE 227,902 2.90% 218,411 1.80% 120,633 0.90% ICEX 136,425 1.80% 377,730 3.20% 197,741 1.40% ACE* 5,979 0.10% 30,060 0.30% 99,128 0.70% Others 83,561 1.10% 70,637 0.60% 37,110 0.30% TOTAL 7,764,755 100.00% 11,948,942 100.00% 13,722,855 100.00%
- 31. Multi Commodity Exchange of India Ltd. Disclaimer This is an independent research report, meant for private circulation within, and use by Qualified Institutional Investors only. This report should not be read or used by any person other than the direct recipient. Not meant for non-institutional investors or the public at large. The report is based mainly on information publicly available, including the red herring prospectus (RHP), published financial results, annual reports, etc. Investors should refer the RHP for a complete listing of risk factors. The analyst has not had a first-hand interaction with the management of the companies covered herein. The analyst does not claim to have any inside information, or any information not already included in this report, to back his opinions and estimates, if any, as may be contained in this report. This report is not meant to be a solicitation to buy, or sell the securities named herein. The analyst does not claim accuracy of his opinions and estimates as contained in this report. While reasonable care has been taken to avoid errors or misstatements of facts, the analyst does not accept responsibility, if any are inadvertently included in this report. In any case, the analyst will not be liable for any losses, if any, arising from the use of this report. Analyst Certification / Disclosures Opinions and estimates, if any, contained in this report are the personal opinions of the analyst, unless stated otherwise, as of the report date. However, these may be reviewed periodically and may therefore change materially, going forward. The analyst has no investment banking, broking or other commercial relationship with any of the companies covered in this report, as of the report date. The analyst does not own shares in any of the companies covered in this report, as of the report date. However, the analyst has subscribed to the IPO of the company under coverage. © All rights reserved. Content from this report may not be copied, used, reproduced or distributed, without the express prior written consent of the author. This report, in whole or in part, may not be hosted on any website, without express prior written consent of the author.