2008 Q4: The Impact of the Global Financial and Economic Crisis on Botswana...
2010 Q2
1. Bifm Economic Review 2nd Quarter 2010
Economic Review
Dr. Keith Jefferis
Chairman of Bifm Investment Committee
Introduction
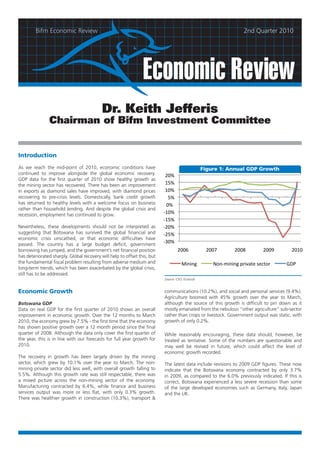
As we reach the mid-point of 2010, economic conditions have Figure 1: Annual GDP Growth
continued to improve alongside the global economic recovery. 20%
GDP data for the first quarter of 2010 show healthy growth as
the mining sector has recovered. There has been an improvement 15%
in exports as diamond sales have improved, with diamond prices 10%
recovering to pre-crisis levels. Domestically, bank credit growth 5%
has returned to healthy levels with a welcome focus on business 0%
rather than household lending. And despite the global crisis and
recession, employment has continued to grow. -10%
-15%
Nevertheless, these developments should not be interpreted as -20%
suggesting that Botswana has survived the global financial and -25%
economic crisis unscathed, or that economic difficulties have
passed. The country has a large budget deficit, government
-30%
borrowing has jumped, and the government’s net financial position 2006 2007 2008 2009 2010
has deteriorated sharply. Global recovery will help to offset this, but
the fundamental fiscal problem resulting from adverse medium and Mining Non-mining private sector GDP
long-term trends, which has been exacerbated by the global crisis,
still has to be addressed.
Source: CSO, Econsult
Economic Growth communications (10.2%), and social and personal services (9.4%).
Agriculture boomed with 45% growth over the year to March,
Botswana GDP although the source of this growth is difficult to pin down as it
Data on real GDP for the first quarter of 2010 shows an overall mostly emanated from the nebulous “other agriculture” sub-sector
improvement in economic growth. Over the 12 months to March rather than crops or livestock. Government output was static, with
2010, the economy grew by 7.5% - the first time that the economy growth of only 0.2%.
has shown positive growth over a 12 month period since the final
quarter of 2008. Although the data only cover the first quarter of While reasonably encouraging, these data should, however, be
the year, this is in line with our forecasts for full year growth for treated as tentative. Some of the numbers are questionable and
2010. may well be revised in future, which could affect the level of
economic growth recorded.
The recovery in growth has been largely driven by the mining
sector, which grew by 10.1% over the year to March. The non- The latest data include revisions to 2009 GDP figures. These now
mining private sector did less well, with overall growth falling to indicate that the Botswana economy contracted by only 3.7%
5.5%. Although this growth rate was still respectable, there was in 2009, as compared to the 6.0% previously indicated. If this is
a mixed picture across the non-mining sector of the economy. correct, Botswana experienced a less severe recession than some
Manufacturing contracted by 6.4%, while finance and business of the large developed economies such as Germany, Italy, Japan
services output was more or less flat, with only 0.3% growth. and the UK.
There was healthier growth in construction (10.3%), transport &
2. 2 Economic Review
Figure 2: Sectoral Output Growth Notwithstanding the improvement in confidence, other results
from the survey suggest that private sector expectations are more
Agriculture 45% pessimistic than official forecasts:
Construction
Transp. & comms • Businesses expect GDP growth of 2.7% in 2010 and 3.3% in
2011; this compares with a forecast of 5% for 2010/11 in the
Mining
2010 Budget Speech, and IMF forecasts of 6.3% in 2010 and
Personal+,-./0'1"2,3%22'45367%38%'937%:'
serv
5.1% in 2011;
-."/0"1234"25678"9:22;7<"=:4>7;44"9/7?>6/74"
Water & elec
!#," Total 4564059</2@A" • Businesses expect inflation to average 8.8% in 2010 and 9.5%
Trade & Tourism
!#+" in 2011; this compares with the Bank of Botswana’s inflation
!#*" & bus. serv.
Fin. forecasts of around 6.5% in 2010 and 5% in 2011 given in
!#)" Government the 2010 Monetary Policy Statement.
!#("
Manufacturing • There is no expectation of significant employment growth over
!#'"
the next 12 months.
!#&"
!#%" -10% -5% 0% 5% 10% 15%
!#$" The overall impression from the survey is of improving, but still
!" Growth in year to March 2010 difficult, business conditions.
Source: CSO
International Developments
!"#$%&'()*%'
Business Expectations
BCD/2<;24" E/7F;CD/2<;24" GHH"
Botswana’s economic recovery is in line with international
developments, as would be expected for an economy that is highly
The improved growth environment is reflected in the results of the dependent upon international trade. The global economy continues
Bank of Botswana’s latest Business Expectations survey, carried out to show robust growth. However the divergence between growth
in March/April 2010. Overall confidence – the proportion of firms in developed countries and emerging markets has become broader,
considering current business conditions to be satisfactory – rose to with the latter showing much higher growth.
55%, compared to 47% in September 2009, although it remains
much lower than in the more bullish years of 2007 and 2008.
There is also a strong anticipation that the economic environment Figure 4: Global Growth Forecasts
will be much better in 2011, with 71% optimistic about business
conditions then.
Real GDP, % Change on previous period,
10 Forecasts
8
6
Figure 3: Business Confidence Index 4
(% of firms rating current business conditions 2
100% satisfactory) 0
saar
90% -2
80% -4
70%
-6
60%
-8
50%
40% -10
30%
20%
10%
0 Emerging markets World Developed Countries
Source: JP Morgan
Survey Date
Exporters Non-exporters All Over the past few months, however, the risks surrounding the
global economic recovery have risen, and in particular there are
greater concerns regarding downside risks that could undermine
Source: Bank of Botswana that recovery and possibly lead to a “double dip” recession. It has
long been known that policymakers would face major challenges
3. 3 Economic Review
in managing the recovery, in particular attaining the appropriate While the IMF has slightly raised its projections of global growth in
balance between the withdrawal of fiscal stimulus and containing its most recent forecasts – to 4.6% for 2010 – it points to a range
public debt levels. Premature cutting of government spending of risks that could hinder the recovery. These include the above
runs the risk of undermining the recovery, while delayed cutting points (reduced bank lending due to new financial regulations
runs the risk of accumulating unsustainable debts. A second major and concerns about government debt; reduced consumer and
uncertainty relates to the soundness of banks and other financial business confidence; and the impact of deficit cutting and reduced
institutions, and to what extent the global financial crisis and government spending). In addition, the IMF considers that American
proposed regulatory changes has impacted on the banks. property prices could fall further, and that exchange rates could be
quite unstable, adding further to global economic uncertainty. All
Both of these issues have been evolving in a negative direction. in all, the IMF sees only downside risks to global growth, despite
The debt crisis in parts of the eurozone – notably Greece but with the upward revision in the global growth forecast.
contagion to Portugal, Spain, and Italy - has pushed policymakers
towards greater concern with debt sustainability, and a greater
readiness to cut spending earlier, which will slow down growth, at Foreign Trade and Exchange Rates
least in the short-term. But the debt crisis has wider implications.
The European Central Bank has had to bail out governments Exports, Imports and the Trade Balance
- contrary to the intentions of the designers of the eurozone - Exports have continued to recover in 2010, in line with the growth
which may undermine monetary policy credibility. Sovereign debt of the global economy and world trade. In the first three months of
problems have also led to concerns about the stability of European 2010, exports averaged P2.6 billion per month, compared to only
banks, which have exposure to government borrowing, and which P1.3 billion in the first quarter of 2009. This compares well with
may impact on their ability to extend credit to finance economic pre-crisis monthly average exports of around P2.7 billion in 2007
recovery. More generally, the Greek crisis has raised serious and 2008.
concerns regarding the stability of the European Monetary Union,
which adds to economic uncertainty. As a result, economic growth The recovery has been most striking in respect of diamond exports,
in Europe is likely to remain very weak. which of course fell to very low levels in the first months of 2009
– so that recovery is off a low base. The recovery reflects higher
Conditions in the USA are somewhat better, but the recovery in diamond production and sales volumes, as well as a strong recovery
consumer confidence has been sporadic and unemployment in diamond prices. There has also been good export performance –
remains high. Both factors will weigh down on growth. Emerging compared to the first quarter of 2009 – for a range of other exports
markets do not really face the same problems, as they have much including meat, gold, vehicle parts, and machinery & equipment.
healthier public finances and more sound financial institutions. The main problem area has been textile & garment exports, which
There, the problem is more related to potential overheating –as in fell by 55% in the first quarter of 2010 compared to the same
China’s property market - as economies recover, requiring measures period in 2009. This follows the closure of Botswana’s largest
such as higher interest rates to contain inflationary pressures. garment manufacturer and exporter, Caratex, and problems faced
by other exporters.
Although exports have picked up, this does not mean that all is
well on the foreign trade front. Exports have recovered from the
low of early 2009, but in the meantime imports have been growing
steadily. For most of 2007-8, monthly exports of P2.7 billion
comfortably exceeded imports, but by the first quarter of 2010,
monthly imports averaged well over P3 billion. The last time that
exports exceeded imports was September 2008. Notwithstanding
the export recovery, therefore, the balance of trade has remained
in substantial deficit.
The main drivers of increased imports appear to have been
diamonds, as cutting and polishing activity has resumed, and fuel
Source: IMF World Economic Outlook
costs, given the large quantities of diesel required for emergency
electrical generation capacity.
Source: IMF World Economic Outlook
4. 4 Economic Review
Figure 6: Exports & Imports against the pula. The apparent weakening of the pula is, therefore,
largely a consequence of a strong rand.
4,000
P million (3 months moving average)
3,500
3,000 Figure 8: Pula Exchange Rates vs ZAR and USD
2,500 0.24 2.0
2,000 USD
1.9
1,500 0.22 ZAR 1.8
1,000
1.7
500 0.20
USD per Pula
ZAR per Pula
1.6
0
0.18 1.5
2006 2007 2008 2009 2010
1.4
0.16
Imports Exports 1.3
1.2
0.14
1.1
Source: CSO, Econsult
0.12 1.0
2004 2005 2006 2007 2008 2009 2010
Figure 7: Trade Balance (quarterly)
5,000
Source: Bank of Botswana
4,000
3,000
2,000 In the longer-term, however, the exchange rate policy governing
1,000 the pula basket mechanism – such as the current crawling peg –
P million
0 probably has more influence on the value of the pula than bilateral
-1,000 cross exchange rates. As Figure 9 shows, the crawling peg has led
-2,000 to a gradual depreciation of the nominal effective exchange rate
-3,000 (NEER - the value of the pula against the basket) over the past five
-4,000 years.
-5,000
-6,000
Figure 9: Nominal Effective Exchange Rate
2005 2006 2007 2008 2009 2010
110
Source: CSO 105
100
95
Exchange Rates 90
Index
85
In recent months one of the main topics of discussion with regard 80
to the exchange rate has been the weakening of the pula against
the rand. The rand/pula exchange rate has been below R1.10 for 75
much of 2010, a level that is almost unprecedented over the past 30 70
years. The apparent weakening of the pula has raised concerns that 65
this will push import prices and inflation, and that the exchange 60
rate will soon approach parity.
2004 2005 2006 2007 2008 2009 2010
As Figure 8 shows, in the short term, the pula/rand exchange Source: Econsult
rate tends to move in the opposite direction to the pula/US dollar
exchange rate (a weakening of the pula against the rand tends
to be associated with a strengthening against the US dollar, and What are the implications of this? The rand/pula exchange rate is
vice versa). This is because of the operation of the pula basket determined by a combination of bilateral rates (especially the rand/
mechanism, under which movement in the rand/US dollar dollar rate, but also, to a lesser extent, the exchange rates of the
exchange rate is a major determinant of the exchange rate of the euro, yen and pound) and the crawling peg. In the coming years,
pula against each of these currencies, especially in the short-term. these influences are likely to be pulling in opposite directions. With
For most of the period since the beginning of 2009, the rand has regard to the rand, there is a widespread view that the currency
been strengthening against the US dollar, and also strengthening is overvalued, and that a weaker rand would be beneficial for the
5. 5 Economic Review
South African economy. If the rand does weaken in the medium Despite this increase, underlying inflationary pressures remain
term, which we consider likely, this will tend to push the value of low. Internationally, inflation in the major developed economies
the pula up against the rand. However, the crawling peg, assuming is forecast to remain below 1.5% during 2010 and 2011, while
that it continues at something around current rates, will tend to in South Africa inflation is forecast to remain within the country’s
push the value of the pula down against all currencies, including the inflation target range of 3-6%. Hence import price pressures should
rand. On its own, the crawling peg would indeed move the pula/ remain modest over the next 18 months. Botswana’s crawling peg
rand exchange rate towards parity. Our view is that the balance exchange rate regime will add slightly to imported inflation, but
of these pressures will probably cause the pula to weaken further even so, imported inflation in pula terms should remain below
against the rand over the next 6-9 months, but that it will not reach 6%. Domestically, demand pressures from households, firms and
parity. Eventually the rand will weaken, and this will cause the pula government are likely to remain subdued, and are unlikely to add
to strengthen against the rand, and most likely recover to above to inflation. The main risk to inflation comes from potential cost
R1.10 by the end of 2011. pressures, which could include wage increases, further increases
in electricity tariffs, and international fuel prices. On balance,
What will the impact of this be on inflation? A weaker pula against Botswana inflation is likely to remain around 7.5-8% for the next
the rand adds to the inflation imported from South Africa. But 12 months, but should fall back below 6% by the middle of 2011.
as noted earlier, this tends to be offset by the strengthening of
the pula against the US dollar, which therefore tends to subtract
from the inflation imported from the rest of the world. As the pula Monetary Policy
has strengthened against the US dollar, we have therefore been
spared some of the impact of rising international oil prices (which After an aggressive period of rate cutting between late 2008 and
are denominated in US dollars). It is the crawling peg that adds to the end of 2009 – during which the Bank Rate came down by 5.5%
imported inflation on a consistent basis, not movements in bilateral - the Bank of Botswana has kept interest rates on hold during the
exchange rates such as the pula/rand. And at current rates of crawl, past six months. There may have been some expectations that rates
this impact is fairly modest. would increase as inflation picked up, but this was always unlikely.
The BoB’s monetary policy framework makes it clear that it is the
Inflation and Monetary Policy expected medium-term path of inflation relative to the monetary
policy objective that determines the stance of monetary policy,
Inflation not short-term movements in inflation. The mid-year review of
Inflation has been rising in recent months, driven by cost pressures the Monetary Policy Statement will make it clear whether BoB has
relating to the 2% increase in VAT in April, and higher electricity revised its expectations regarding inflation through 2010 and 2011.
and fuel prices. During the second quarter of 2010, inflation rose However, we doubt that forecast inflation will have changed much
from 5.9% to 7.7%. Whereas inflation fell within the Bank of from that presented in the 2010 MPS in February. Our own forecasts
Botswana’s inflation objective range of 3-6% for a few months support BoB’s expectations that inflation will fall back within the
at the end of 2009 and early 2010, it has since risen significantly inflation objective range by mid-2011. Unless there are any major
above the upper end of this range. shocks to inflation (such as from large increases in international fuel
or food prices), we consider it likely that interest rates will remain
on hold for the foreseeable future. With uncertainties regarding the
Figure 10: Inflation and Forecasts strength of domestic economic activity as government spending
16% is cut back to restore fiscal balance, it is clearly appropriate for
monetary policy to keep interest rates relatively low to support the
14% economic recovery.
12%
10% Financial Sector
8%
The GDP data show that the financial sector experienced a severe
6% growth slowdown in 2009, after many years in which Finance and
4% Business Services had been one of the fastest growing sectors of
the economy. The slowdown mainly affected the banks but also
2% extended to other financial activities such as insurance – presumably
0% because the squeeze on household incomes has put pressure on
2003 2004 2005 2006 2007 2008 2009 2010 2010 resources available for premiums, while the global recession has
reduced the value of financial assets such as pensions.
Source: CSO, Econsult There are some signs of recovery in the first half of 2010, however.
Credit growth has been rising and continues to show steady
recovery. The recovery has largely been driven by renewed lending
to the private business sector, while the banks are being much more
cautious regarding lending to households.
6. 6 Economic Review
This is not surprising: arrears on household lending remain much A further key development in the banking sector will be the
higher than on lending to businesses, indicating the risks of lending government decision regarding the proposed privatisation of the
to households while real incomes remain squeezed and many National Development Bank (NDB), which is expected in the near
households are over-borrowed. Increased lending to businesses future. A privatisation proposal has been submitted by the Public
rather than households is also preferable from an economic Enterprises Evaluation and Privatisation Agency (PEEPA). While
development perspective. While arrears on bank lending to there are various possible options, a phased process whereby a
households remains a major concern, a positive development in the strategic equity partner is brought in to restructure the bank prior
first quarter of 2010 is that the arrears rate has fallen (marginally, to a subsequent IPO and flotation on the BSE would probably make
from 7.5% to 7.1% of credit overall, and from 10.2% to 10.0% the most sense.
on household loans). If this trend continues, it will be an indication
that credit problems in the banking sector have peaked, and that
economic conditions are steadily improving. Outlook
Following the recession of 2009, it is anticipated that economic
Figure 11: Credit Growth growth will experience a robust recovery during 2010, with growth
forecasts in the range of 6-8%. We expect mining to be the main
70% driver of the growth recovery, while non-mining sector growth will
Growth (qoq, annualised)
60% remain sluggish as a result of reduced government spending and
50% ongoing pressure on household incomes and balance sheets.
40%
30% IMF forecasts indicate expected growth in the range of 5-6%
20% over the next five years. More detail of the thinking behind these
forecasts should be available when the IMF’s 2010 Article IV report
10%
on Botswana is published, following the visit of the IMF assessment
0% mission to Botswana in June. In a press release published at the end
-10% of the visit, the IMF made it clear that one of their main concerns
-20% related to long-term fiscal sustainability. The IMF reinforced the need
2005 2006 2007 2008 2009 2010 to improve the management of public finances and “to do more
with less”. Central to this is the need to reform budget formulation
Total HH Priv. bus. and management, with greater emphasis on prioritizing spending
NB: adjusted for changes in definitions and coverage and delivering results. This is complemented by an ongoing Public
Expenditure Review being undertaken by the World Bank, which
is likely to propose widespread reform and modernisation of the
Source: Bank of Botswana, Econsult
budgeting and National Development Planning (NDP) framework,
and the adoption of a medium-term budgeting framework that is
In other developments related to the financial sector, the Bank of more in keeping with international best practice. Improved planning
Namibia has blocked the proposed takeover of Capricorn Investment and budgeting will help to offset the negative economic impact of
Holdings (CIH), the parent company of Bank Windhoek and Bank the inevitable slowdown in total government spending.
Gaborone, by ABSA of South Africa, part of the Barclays group. This
outcome is not surprising, and reflects the BoN’s desire to maintain Similar fiscal sustainability concerns are likely to dominate the
a spread of ownership in the Namibian banking system, rather than annual reviews conducted by the credit rating agencies Moody’s
having all banks as subsidiaries of South African banking groups. and Standard & Poors. Botswana’s credit ratings have taken a
The outcome is also relevant for Botswana. A successful takeover of knock, with a downgrade from Standard & Poors and a negative
CIH by ABSA would have resulted in either the absorption of Bank outlook from Moody’s earlier in the year, as a result of rising
Gaborone by Barclays Botswana, or (more likely) the sale of Bank budget deficits. However, a strong commitment by government
Gaborone to a third party. The way is now clear for Bank Gaborone to undertake effective public finance reform, combined with the
to remain under current ownership. commitment in the 2010 Budget to achieve a balanced budget by
2012, should help to improve the ratings outlook.
Bifm Botswana Limited
Asset Management, Property Management, Private Equity, Corporate Advisory Services.
Private Bag BR 185, Broadhurst, Botswana, Tel: +(267) 395 1564, Fax: +(267) 390 0358, www.bifm.co.bw
Dynamic Wealth Management Disclaimer: The views expressed in this publication are those of the author and do not necessarily reflect those of Bifm