
Recomendados
Más contenido relacionado
Similar a 8 Urban Growth Intro To Informal Case Study Intro
Similar a 8 Urban Growth Intro To Informal Case Study Intro (20)
Más de Ecumene
Más de Ecumene (20)
Último
Último (20)
8 Urban Growth Intro To Informal Case Study Intro
- 5. There has been examples of more recent rapid urban growth in MEDCs. Japan has been rich enough to invest in the provision of urban services and the development of infrastructure to cope with this growth. Also the population of Tokyo have in general had enough private disposable income to address their needs.
- 7. Latin America city growth 1950 1990 15,183,612a 12,183,634 7,866,659 4,005,631 2,333,346 São Paulo 4,676,174a 3,937,277 2,871,060 2,133,252 1,509,169 Santiago 9,600,528a 8,619,559 6,685,703 4,392,067 2,885,165 Rio de Janeiro 15,047,685 13,811,946 8,900,513 5,173,549 3,145,351 Mexico City 6,422,875 4,608,010 3,302,523 1,845,910 645,172 Lima 2,989,601 2,641,844 2,174,759 1,346,708 683,659 Caracas 10,886,163 9,723,966 8,314,341 6,739,045 4,622,959 Buenos Aires 4,851,000 4,122,978 2,892,668 1,682,667 647,429 Bogotá 1990 1980 1970 1960 1950 City
- 10. TO BE MEGA-CITIES IN 2015 Country Urban agglomeration 1950 1975 2000 2015 Japan............................ Tokyo 6 920 19 771 26 444 27 190 Bangladesh .................. Dhaka 417 2 173 12 519 22 766 India ............................ Mumbai (Bombay) 2 981 7 347 16 086 22 577 Brazil........................... São Paulo 2 528 10 333 17 962 21 229 India ............................ Delhi 1 391 4 426 12 441 20 884 Mexico......................... Mexico City 2 883 10 691 18 066 20 434 United States ............... New York 12 339 15 880 16 732 17 944 Indonesia ..................... Jakarta 1 452 4 814 11 018 17 268 India ............................ Calcutta 4 446 7 888 13 058 16 747 Pakistan ....................... Karachi 1 028 3 990 10 032 16 197 Nigeria......................... Lagos 288 1 890 8 665 15 966 United States ............... Los Angeles 4 046 8 926 13 213 14 494 China ........................... Shanghai 5 333 11 443 12 887 13 598 Argentina..................... Buenos Aires 5 042 9 144 12 024 13 185 Philippines................... Metro Manila 1 544 5 000 9 950 12 579 China ........................... Beijing 3 913 8 545 10 839 11 671 Brazil........................... Rio de Janeiro 2 965 7 963 10 652 11 543 Egypt ........................... Cairo 2 410 6 079 9 462 11 531 Turkey ......................... Istanbul 1 077 3 601 8 953 11 362 Japan............................ Osaka 4 147 9 844 11 013 11 013 China ........................... Tianjin 2 374 6 160 9 156 10 319
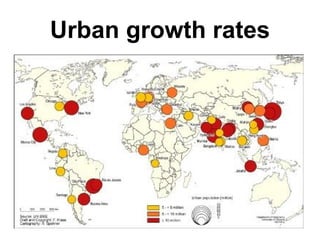
- 11. Urban growth in LEDC’s and NICs The highest levels of urban growth are in LEDC’s and NIC’s because of high natural increase and rural to urban migration. Don’t forget there are many large cities in the world of over 2 or 3 million inhabitants. Don’t just think, mega cities. These cities face the same problems that cities in the UK faced in the nineteenth century. BUT they are not in the same position that the UK was to face the challenge.
- 13. So what’s the point of all this…? This whole process of urbanisation and urban growth is a sum of millions of people’s individual decisions, aspirations, hopes and desire to provide for their loved ones. As the governments are unable to provide solutions, then these individuals, faced with these problems are struggling to find their own solutions. This is why the informal sector plays such a vital role in the process of urban growth we are witnessing now in the world.
- 14. Is it possible that spontaneous settlements, shanty towns, bustees, favelas, slums are part of the solution? Or perhaps is it true that they are a potent symbol of the failure of society to address the basic needs of the majority and it must be the responsibility of the public sector to provide housing for its citizens?