SlideShare una empresa de Scribd logo
1 de 126
Descargar para leer sin conexión
CONGRESS OF THE UNITED STATES
CONGRESSIONAL BUDGET OFFICE

CBO
The 2013
Long-Term
Budget Outlook
Percentage of GDP
120

Actual

Projected

100

80

60

Federal Debt
Held by the Public
40

Federal Spending
20

Federal Revenues
0
2000

2004

2008

2012

2016

2020

SEPTEMBER 2013

2024

2028

2032

2036
Notes
Unless otherwise indicated, the years referred to in most of this report are federal fiscal years
(which run from October 1 to September 30). In Chapters 6 and 7, budgetary values, such as
the ratio of debt or deficits to gross domestic product (GDP), are presented on a fiscal year
basis, whereas economic variables, such as gross national product (GNP) or interest rates, are
presented on a calendar year basis.
In this report, historical values for GDP and GNP and budget figures expressed as ratios to
GDP reflect revised data from the national income and product accounts that were released by
the Bureau of Economic Analysis on July 31, 2013. In addition, all projections reflect CBO’s
extrapolation of those revisions to projected future GDP and GNP. Because historical values
for GDP have been increased but no changes have been made to budget data, budget figures
expressed as ratios to GDP are lower than they were before the revisions. For more information, see Congressional Budget Office, “Updated Historical Budget Data Following BEA’s
Recent Update of the National Income and Product Accounts,” CBO Blog (August 12, 2013),
www.cbo.gov/publication/44508.
Numbers in the text, tables, and figures of this report may not add up to totals because of
rounding.
The Affordable Care Act comprises the Patient Protection and Affordable Care Act; the health
care provisions of the Health Care and Education Reconciliation Act of 2010; and, in the case
of this report, the effects of subsequent related judicial decisions, statutory changes, and
administrative actions.
The figure on the cover shows federal revenues, spending, and debt held by the public under
the Congressional Budget Office’s (CBO’s) extended baseline. That baseline generally adheres
closely to current law, following CBO’s 10-year baseline budget projections through 2023 and
then extending the baseline concept for the rest of the long-term projection period.
Additional data—including the data underlying the figures in this report, supplemental budget projections, the economic variables underlying those projections, and projections of the
total U.S. population—are posted along with the report on CBO’s website (www.cbo.gov/
publication/44521).
Many of the terms used in the report are defined in a glossary available on the website
(www.cbo.gov/publication/42904).

CBO

Pub. No. 4713
Contents
Summary

1

1

The Long-Term Outlook for the Federal Budget

7

The Budget Outlook for the Next 10 Years
The Long-Term Budgetary Imbalance
Consequences of Large and Growing Federal Debt
CBO’s Assumptions About Spending and Revenue Policies
CBO’s Projections of Demographic and Economic Trends
Projected Spending Through 2038
BOX 1-1. CAUSES OF PROJECTED GROWTH IN FEDERAL SPENDING FOR
MAJOR HEALTH CARE PROGRAMS AND SOCIAL SECURITY

7
8
13
15
15
21

Projected Revenues Through 2038
Changes From Last Year’s Long-Term Budget Outlook

2

24
26
26

The Long-Term Outlook for Major Federal Health Care Programs

29

Overview of Major Government Health Care Programs
The Historical Growth of Health Care Spending
CBO’s Methodology for Long-Term Projections of Federal
Health Care Spending
Long-Term Projections of Spending for Major Health Care Programs

30
35

BOX 2-1. NATIONAL SPENDING ON HEALTH CARE

38
42
44

3

The Long-Term Outlook for Social Security

49

How Social Security Works
The Outlook for Social Security Spending and Revenues

49
51

4

The Long-Term Outlook for Other Federal Noninterest Spending

57

Other Federal Noninterest Spending Over the Past Four Decades
Long-Term Projections of Other Federal Noninterest Spending

57
58

CBO
II

THE 2013 LONG-TERM BUDGET OUTLOOK

5

SEPTEMBER 2013

The Long-Term Outlook for Federal Revenues

63

Revenues Over the Past 40 Years
Revenue Projections Under CBO’s Extended Baseline

64
65

BOX 5-1. IMPACT OF THE AMERICAN TAXPAYER RELIEF ACT OF 2012 ON
REVENUES

Structural Features of the Individual Income Tax System
Tax Provisions Enacted in the Affordable Care Act
Long-Term Implications for Tax Rates and the Tax Burden

66
67
68
70

6

The Economic and Budgetary Effects of Alternative Budget Policies

75

Long-Term Effects of the Fiscal Policies Underlying the Extended Baseline
Long-Term Effects of an Alternative Fiscal Scenario With Larger Deficits
Long-Term Effects of Two Illustrative Scenarios With Smaller Deficits
Short-Term Effects of the Three Additional Fiscal Scenarios

76
83
85
89

7

The Uncertainty of Long-Term Budget Projections

93

103

New Legislation and Changes in Assumptions and Methods

103
106
108

Budget Projections Through 2088

113

119

About This Document

CBO

Changes in CBO’s Long-Term Projections Since June 2012

List of Tables and Figures

B

93
99
102

Changes in Projections Under the Extended Baseline

A

The Long-Term Budgetary Effects of Differences in Productivity,
Interest Rates, and Federal Spending on Health Care
Other Risks to the Long-Term Budget Outlook
Implications of Uncertainty for the Design of Fiscal Policy

121

BOX A-1. WHY CBO CHANGED ITS APPROACH TO PROJECTING MORTALITY
Summary

B

etween 2009 and 2012, the federal government
recorded the largest budget deficits relative to the size of
the economy since 1946, causing federal debt to soar.
Federal debt held by the public is now about 73 percent
of the economy’s annual output, or gross domestic product (GDP). That percentage is higher than at any point
in U.S. history except a brief period around World War
II, and it is twice the percentage at the end of 2007. If
current laws generally remained in place, federal debt
held by the public would decline slightly relative to GDP
over the next several years, the Congressional Budget
Office (CBO) projects. After that, however, growing
deficits would ultimately push debt back above its current
high level. CBO projects that federal debt held by the
public would reach 100 percent of GDP in 2038,
25 years from now, even without accounting for the
harmful effects that growing debt would have on the
economy (see Summary Figure 1). Moreover, debt would
be on an upward path relative to the size of the economy,
a trend that could not be sustained indefinitely.

Budget Projections for the
Next 10 Years
The economy’s gradual recovery from the 2007–2009
recession, the waning budgetary effects of policies
enacted in response to the weak economy, and other
changes to tax and spending policies have caused the
deficit to shrink this year to its smallest size since 2008:
roughly 4 percent of GDP, compared with a peak of
almost 10 percent in 2009. If current laws governing
taxes and spending were generally unchanged—an
assumption that underlies CBO’s 10-year baseline budget
projections—the deficit would continue to drop over the
next few years, falling to 2 percent of GDP by 2015. As a
result, by 2018, federal debt held by the public would
decline to 68 percent of GDP.1
However, budget deficits would gradually rise again
under current law, CBO projects, mainly because of

increasing interest costs and growing spending for Social
Security and the government’s major health care programs (Medicare, Medicaid, the Children’s Health Insurance Program, and subsidies to be provided through
health insurance exchanges). CBO expects interest rates
to rebound in coming years from their current unusually
low levels, sharply raising the government’s cost of borrowing. In addition, the pressures of an aging population,
rising health care costs, and an expansion of federal subsidies for health insurance would cause spending for some
of the largest federal programs to increase relative to
GDP. By 2023, CBO projects, the budget deficit would
grow to almost 3½ percent of GDP under current law,
and federal debt held by the public would equal 71 percent of GDP and would be on an upward trajectory.

Budget Projections for the Long Term
Looking beyond the 10-year period covered by its regular
baseline projections, CBO produced an extended baseline
for this report that extrapolates those projections through
2038 (and, with even greater uncertainty, through later
decades). Under the extended baseline, budget deficits
would rise steadily and, by 2038, would push federal debt
held by the public close to the percentage of GDP seen
just after World War II—even without factoring in the
harm that growing debt would cause to the economy.

1. For details about CBO’s most recent 10-year baseline, see
Congressional Budget Office, Updated Budget Projections: Fiscal
Years 2013 to 2023 (May 2013), www.cbo.gov/publication/
44172. In July 2013, the Bureau of Economic Analysis (BEA)
revised upward the historical values for GDP; CBO extrapolated
those revisions for this report when projecting outcomes as a percentage of future GDP. Although CBO’s projections of revenues,
outlays, deficits, and debt over the 2013–2023 period have not
changed since the baseline projections issued in May, those
amounts measured as a percentage of GDP are now lower as a
result of BEA’s revisions. In this summary, budgetary values presented as a percentage of GDP have been rounded to the nearest
one-half percent.

CBO
2

THE 2013 LONG-TERM BUDGET OUTLOOK

SEPTEMBER 2013

Summary Figure 1.

Debt, Spending, and Revenues Under CBO’s Extended Baseline
(Percentage of gross domestic product)
Federal Debt Held by the Public
120

Actual

120

Projected

80

80

40

40

0
0
2000 2002 2004 2006 2008 2010 2012 2014 2016 2018 2020 2022 2024 2026 2028 2030 2032 2034 2036 2038
Total Spending and Revenues
30

Actual

30

Projected

Spending

20

20

Revenues

10

10

0
0
2000 2002 2004 2006 2008 2010 2012 2014 2016 2018 2020 2022 2024 2026 2028 2030 2032 2034 2036 2038
Components of Total Spending
16

12

Actual
Other
Noninterest
Spending

16

Projected
Federal Spending on
a
Major Health Care Programs

8

12

8
Social Security

4

4
Net Interest

0
0
2000 2002 2004 2006 2008 2010 2012 2014 2016 2018 2020 2022 2024 2026 2028 2030 2032 2034 2036 2038

Source: Congressional Budget Office.
Notes: The extended baseline generally adheres closely to current law, following CBO’s 10-year baseline budget projections through 2023 and
then extending the baseline concept for the rest of the long-term projection period. These projections do not reflect the economic
effects of the policies underlying the extended baseline. (For an analysis of those effects and their impact on debt, see Chapter 6.)
These data reflect recent revisions by the Bureau of Economic Analysis to estimates of GDP in past years and CBO’s extrapolation of
those revisions to projected future GDP
.
a. Spending on Medicare (net of offsetting receipts), Medicaid, the Children’s Health Insurance Program, and subsidies offered through new
health insurance exchanges.

CBO
SUMMARY

By 2038, CBO projects, federal spending would increase
to 26 percent of GDP under the assumptions of the
extended baseline, compared with 22 percent in 2012
and an average of 20½ percent over the past 40 years.
That increase reflects the following projected paths for
various types of federal spending if current laws generally
remain in place:
 Federal spending for the major health care programs
and Social Security would increase to a total of 14 percent of GDP by 2038, twice the 7 percent average of
the past 40 years.
 In contrast, total spending on everything other than
the major health care programs, Social Security, and
net interest payments would decline to 7 percent of
GDP, well below the 11 percent average of the past
40 years and a smaller share of the economy than at
any time since the late 1930s.
 The federal government’s net interest payments would
grow to 5 percent of GDP, compared with an average
of 2 percent over the past 40 years, mainly because
federal debt would be much larger.

Federal revenues would equal 19½ percent of GDP by
2038 under current law, CBO projects, compared with
an average of 17½ percent over the past four decades.
Revenues are projected to rise from 15 percent of GDP
last year to 17½ percent in 2014, spurred by the ongoing
economic recovery and changes in provisions of tax law
(including the expiration of lower income tax rates for
high-income people, the expiration of a temporary cut in
the Social Security payroll tax, and the imposition of new
taxes). After 2014, revenues would increase gradually relative to GDP, largely because growth in income beyond
that attributable to inflation would push taxpayers into
higher income tax brackets over time.
The gap between federal spending and revenues would
widen steadily after 2015 under the assumptions of the
extended baseline, CBO projects. By 2038, the deficit
would be 6½ percent of GDP, larger than in any year
between 1947 and 2008, and federal debt held by the
public would reach 100 percent of GDP, more than in
any year except 1945 and 1946. With such large deficits,
federal debt would be growing faster than GDP, a path
that would ultimately be unsustainable.

THE 2013 LONG-TERM BUDGET OUTLOOK

3

long-term budget outlook. The increase in debt relative
to the size of the economy, combined with an increase in
marginal tax rates (the rates that would apply to an additional dollar of income), would reduce output and raise
interest rates relative to the benchmark economic projections that CBO used in producing the extended baseline.
Those economic differences would lead to lower federal
revenues and higher interest payments. With those effects
included, debt under the extended baseline would rise to
108 percent of GDP in 2038.

Harmful Effects of Large and
Growing Debt
How long the nation could sustain such growth in federal
debt is impossible to predict with any confidence. At
some point, investors would begin to doubt the government’s willingness or ability to pay U.S. debt obligations,
making it more difficult or more expensive for the government to borrow money. Moreover, even before that
point was reached, the high and rising amount of debt
that CBO projects under the extended baseline would
have significant negative consequences for both the
economy and the federal budget:
 Increased borrowing by the federal government would
eventually reduce private investment in productive
capital, because the portion of total savings used to
buy government securities would not be available to
finance private investment. The result would be a
smaller stock of capital and lower output and income
in the long run than would otherwise be the case.
Despite those reductions, however, the continued
growth of productivity would make real (inflationadjusted) output and income per person higher in
the future than they are now.
 Federal spending on interest payments would rise,
thus requiring larger changes in tax and spending
policies to achieve any chosen targets for budget
deficits and debt.
 The government would have less flexibility to use
tax and spending policies to respond to unexpected
challenges, such as economic downturns or wars.
 The risk of a fiscal crisis—in which investors
demanded very high interest rates to finance the
government’s borrowing needs—would increase.

Incorporating the economic effects of the federal
policies that underlie the extended baseline worsens the
CBO
4

THE 2013 LONG-TERM BUDGET OUTLOOK

The Consequences of Alternative
Fiscal Policies
Most of the projections in this report are based on the
assumption that federal tax and spending policies will
generally follow current law—not because CBO expects
laws to remain unchanged but because the budgetary
implications of current law are a useful benchmark for
policymakers when they consider changes in laws. If tax
and spending policies differed significantly from those
specified in current law, budgetary outcomes could differ
substantially as well. To illustrate the extent of that
difference, CBO analyzed the effects of some additional
sets of fiscal policies.
Under one set of alternative policies, referred to as the
extended alternative fiscal scenario, certain policies that
are now in place but that are scheduled to change under
current law would continue instead, and some provisions
of current law that might be difficult to sustain for a long
period would be modified. With those changes to current
law, deficits (excluding the government’s interest costs)
would be a total of about $2 trillion higher over the next
decade than in CBO’s baseline; in subsequent years, such
deficits would exceed those projected in the extended
baseline by rapidly growing amounts. The harmful effects
on the economy from the resulting increase in federal
debt would be partly offset by lower marginal tax rates.
Nevertheless, in the long run, output would be lower and
interest rates would be higher under that set of policies
than under the extended baseline. With those economic
changes incorporated, federal debt held by the public
would reach about 190 percent of GDP by 2038, CBO
projects.
In a different illustrative scenario, deficit reduction would
be phased in such that deficits excluding interest costs
would be a total of $2 trillion lower through 2023 than
in the baseline, and the reduction in the deficit as a percentage of GDP in 2023 would be continued in later
years. In that case, output would be higher and interest
rates would be lower over the long run than in the
extended baseline. Factoring in the effects of those economic changes on the budget, CBO projects that federal
debt held by the public would be 67 percent of GDP in
2038, close to its percentage in 2012. Under a third scenario, with twice as much deficit reduction—a $4 trillion
reduction in deficits excluding interest costs through
2023—CBO projects that federal debt held by the public

CBO

SEPTEMBER 2013

would fall to 31 percent of GDP by 2038, slightly below
its percentage of GDP in 2007 (35 percent) and its
average percentage over the past 40 years (38 percent).
Those different scenarios for fiscal policy would also have
different effects on the economy in the short term. During the next several years—when the nation’s economic
output will probably remain below its potential, or maximum sustainable, level—the spending increases and tax
reductions in the alternative fiscal scenario (relative to
what would happen under current law) would increase
the demand for goods and services and thereby raise output and employment. The reductions in deficits under
the other illustrative scenarios, by contrast, would
decrease the demand for goods and services and thereby
reduce output and employment.

The Uncertainty of Long-Term
Budget Projections
Even if the tax and spending policies specified in current
law continue, budgetary outcomes will undoubtedly
differ from CBO’s current projections as a result of
unexpected changes in the economy, demographics, and
other factors. Because the uncertainty of budget projections increases the farther the projections extend into the
future, this report focuses on the next 25 years.
To illustrate the uncertainty of those projections, CBO
examined how altering its assumptions about future productivity, interest rates, and federal spending on health
care would affect the projections in the extended baseline.
Under those alternative assumptions—which do not
cover the full range of possible outcomes—federal debt
held by the public in 2038 could range from as low as
65 percent of GDP (still elevated by historical standards)
to as high as 156 percent of GDP, compared with the
108 percent of GDP projected under the extended baseline with the economic effects of fiscal policy included.
Those calculations do not address other sources of uncertainty, such as the risk of an economic depression or
major war or the possibility of unexpected changes in
birth rates, life expectancy, immigration, or labor force
participation. Nonetheless, CBO’s analysis shows that
under a wide range of possible assumptions about some
key factors that influence federal spending and revenues,
the budget is on an unsustainable path.
SUMMARY

Choices for the Future
The unsustainable nature of the federal government’s current tax and spending policies presents lawmakers and the
public with difficult choices. Unless substantial changes
are made to the major health care programs and Social
Security, those programs will absorb a much larger share
of the economy’s total output in the future than they have
in the past. Even with spending for all other federal activities on track, by the end of this decade, to represent the
smallest share of GDP in more than 70 years, total federal
noninterest spending would be larger relative to the size
of the economy than it has been, on average, over the past
40 years. The structure of the federal tax code means that
revenues would also represent a larger percentage of GDP
in the future than they have, on average, in the past few
decades—but not large enough to keep federal debt held
by the public from growing faster than the economy
starting in the next several years. Moreover, because federal debt is already unusually high relative to GDP, further increases in debt could be especially harmful. To put
the federal budget on a sustainable path for the long
term, lawmakers would have to make significant changes
to tax and spending policies—letting revenues rise more
than they would under current law, reducing spending
for large benefit programs below the projected levels, or
adopting some combination of those approaches.
The size of such changes would depend on the amount of
federal debt that lawmakers considered appropriate. For

THE 2013 LONG-TERM BUDGET OUTLOOK

5

example, bringing debt back down to 39 percent of GDP
in 2038—as it was at the end of 2008—would require a
combination of increases in revenues and cuts in noninterest spending (relative to current law) totaling 2 percent of GDP for the next 25 years. (In 2014, 2 percent of
GDP would equal about $350 billion.) If those changes
came entirely from revenues, they would represent an
increase of 11 percent relative to the amount of revenues
projected for the 2014–2038 period; if the changes came
entirely from spending, they would represent a cut of
10½ percent in noninterest spending from the amount
projected for that period.
In deciding how quickly to carry out policy changes to
make the size of the federal debt more sustainable, lawmakers face other trade-offs. On the one hand, waiting to
cut federal spending or raise taxes would lead to a greater
accumulation of debt and would increase the size of the
policy adjustments needed to put the budget on a sustainable course. On the other hand, implementing spending cuts or tax increases quickly would weaken the economy’s current expansion and would give people little time
to plan for and adjust to the policy changes. The negative
short-term effects that deficit reduction has on output
and employment would be especially large now, because
output is so far below its potential level that the Federal
Reserve is keeping short-term interest rates near zero and
could not lower those rates further to offset the impact of
changes in spending and tax policies.

CBO
CHAPTER

1
The Long-Term Outlook for the
Federal Budget

T

he federal budget deficit has shrunk noticeably in
fiscal year 2013, and it is projected to continue to decline
for the next few years. As a result, under current law, federal debt held by the public would be smaller relative to
the size of the economy in 2018 than it is now, according
to CBO’s projections.
The long-term budget outlook is much less positive,
however. The aging of the baby-boom generation,
together with growth in health care spending per person
and an expansion of federal subsidies for health insurance, is expected to steadily boost the government’s
spending for Social Security and major health care programs. Barring changes to current law, that additional
spending would contribute to rising budget deficits starting in a few years, causing federal debt to swell from a
level that is already very high relative to the size of the
economy. In this report, the Congressional Budget Office
(CBO) presents projections of federal revenues, outlays,
deficits, and debt for the next several decades—under the
assumption that laws governing taxes and spending
remain largely unchanged—and discusses the possible
consequences of such budgetary outcomes.

The Budget Outlook for the
Next 10 Years
The budget deficit is expected to decline this year to its
smallest size since 2008: roughly 4 percent of the nation’s
economic output, or gross domestic product (GDP), less
than half of its peak of nearly 10 percent in 2009. That
decline reflects the economy’s gradual recovery from the
2007–2009 recession, the waning budgetary effects of
policies enacted in response to the recession, and other
changes to tax and spending policies. In CBO’s 10-year
baseline budget projections, which incorporate the
assumption that current laws generally remain in place,

the deficit is projected to continue to drop over the next
few years, falling to 2 percent of GDP by 2015. As a
result, by 2018, federal debt held by the public would
decline to 68 percent of GDP from its current level of
73 percent.1
Thereafter, deficits would gradually rise again under current law, CBO projects. Interest rates are expected to
rebound from their current unusually low levels, sharply
increasing the cost of paying interest on the government’s
debt. Moreover, the pressures of an aging population,
rising health care costs, and an expansion of federal subsidies for health insurance would cause mandatory spending to rise as a percentage of GDP after 2018.2 In addition, CBO projects, revenues would decline relative to
GDP for several years after 2015 as receipts from corporate income taxes and remittances from the Federal
Reserve diminished as a share of the economy. By 2023,
under current law, the budget deficit would grow to
almost 3½ percent of GDP. In that year, federal debt
would equal 71 percent of GDP and would be on the rise
relative to the size of the economy.

1. For details about CBO’s most recent 10-year baseline, see Congressional Budget Office, Updated Budget Projections: Fiscal Years
2013 to 2023 (May 2013), www.cbo.gov/publication/44172.
Since the publication of that report, the Bureau of Economic
Analysis has revised upward its estimates of gross domestic product in past years. The numbers shown in this report for budget
amounts as a percentage of GDP reflect those revisions to the
historical data and CBO’s extrapolation of those revisions to
projected future GDP.
2. Lawmakers generally determine spending for mandatory programs by setting eligibility rules, benefit formulas, and other
parameters rather than by appropriating specific amounts each
year. In that way, mandatory spending differs from discretionary
spending, which is controlled by annual appropriation acts.

CBO
8

THE 2013 LONG-TERM BUDGET OUTLOOK

SEPTEMBER 2013

CBO’s long-term projections extend beyond the usual
10-year budget window, focusing on the 25-year period
ending in 2038. They generally adhere closely to current
law, following the agency’s May 2013 baseline budget
projections through 2023 and then extending the baseline concept into later years; hence, they are referred to
as the extended baseline (for details of the assumptions
underlying those projections, see Table 1-1).

continued to rise relative to GDP, at some point investors
would begin to doubt the government’s willingness or
ability to pay its debt obligations. Such doubts would
make it more difficult or more expensive for the government to borrow money, thus forcing the government to
cut spending, raise taxes, or pursue some combination
of the two approaches. For that reason, the amount of
federal debt held by the public relative to the nation’s
annual economic output is an important barometer of
the government’s financial position.

CBO’s 10-year and extended baselines are meant to serve
as benchmarks for measuring the budgetary effects of
proposed changes to federal revenues or spending. They
are not meant to be predictions of future budgetary outcomes; rather, they represent CBO’s best judgment of
how the economy and other factors would affect revenues
and spending if current law did not change. By generally
following current law, the baselines incorporate the
assumption that some policy changes that lawmakers
have routinely made in the past—such as preventing the
sharp cuts to Medicare’s payment rates for physicians
called for by law—will not be made again.

Federal debt held by the public stood at 39 percent of
GDP at the end of 2008, close to its average of the preceding several decades. Since then, large deficits have
caused debt held by the public to grow sharply—to a
projected 73 percent of GDP by the end of 2013. Debt
has exceeded 70 percent of GDP during only one other
period in U.S. history: from 1944 through 1950, when
it spiked because of a surge in federal spending during
World War II and peaked at 106 percent of GDP (see
Figure 1-1 on page 10).

The Long-Term Budgetary Imbalance

CBO’s extended baseline projections show a substantial
imbalance in the federal budget over the long run, with
annual revenues consistently falling short of annual outlays. Two measures offer complementary perspectives on
the size of that long-term imbalance: Projections of federal debt illustrate how the shortfall of revenues relative to
spending accumulates over time, and estimates of the
“fiscal gap” summarize the shortfall over a given period in
a single value. Both measures show that projected revenues would be insufficient to support projected spending
if current law remained largely unchanged.
In addition to the extended baseline, CBO has developed
an alternative long-term fiscal scenario, which incorporates several possible changes to current law that would
result in higher outlays and lower revenues (see Chapter 6
for details). Under that scenario, federal debt would grow
even faster than in the extended baseline, so larger policy
changes would be needed to close the fiscal gap.

The Accumulation of Federal Debt
Debt held by the public represents the amount that the
federal government has borrowed in financial markets (by
issuing Treasury securities) to pay for its operations and
activities.3 For a combination of federal spending and revenues to be sustainable over time, debt held by the public
must eventually grow no faster than the economy. If debt

CBO

CBO projects that, under current law, debt held by the
public would rise slightly relative to GDP in 2014 and
then, because of smaller deficits, decrease to 68 percent of
GDP by 2018. Around 2020, with deficits growing
again, debt would begin to rise faster than GDP. By 2038,
under the extended baseline, federal debt held by the
public would reach 100 percent of GDP (see Table 1-2
on page 11)—nearly equal to the percentage just after
World War II and almost triple the percentage in 2007—
and would be on an upward path. That trajectory for federal debt would ultimately be unsustainable.
Projections that far into the future are highly uncertain,
of course. Nevertheless, CBO projects that if current law
3. When the federal government borrows in financial markets, it
competes with other participants for financial resources and thus
can crowd out private investment, reducing economic output and
income. In contrast, federal debt held by trust funds and other
government accounts represents internal transactions of the government and has no direct effect on financial markets. (That
debt and debt held by the public together make up gross federal
debt.) For more discussion, see Congressional Budget Office,
Federal Debt and Interest Costs (December 2010), www.cbo.gov/
publication/21960. Several factors not directly included in the
budget totals also affect the government’s need to borrow from
the public. Those factors include increases or decreases in the government’s cash balance as well as the cash flows reflected in the
financing accounts used for federal credit programs. Changes in
those factors were not modeled for this analysis.
CHAPTER ONE

THE 2013 LONG-TERM BUDGET OUTLOOK

9

Table 1-1.

Assumptions About Spending and Revenues Underlying CBO’s Extended Baseline
Assumptions About Spending

Medicare

As scheduled under current law,a except that three policies that would restrain the growth of
Medicare spending are assumed to be in effect only through 2029:
– Ongoing reductions in payment updates for most providers in the fee-for-service program
(after 2029, those updates are assumed to grow with costs);
– The sustainable growth rate mechanism for payment rates for physicians; and
– Spending reductions from the process associated with the Independent Payment
Advisory Board.

Medicaid

As scheduled under current law

Children’s Health Insurance Program

As projected in CBO’s baseline through 2023; remaining constant as a percentage of GDP
thereafter

Exchange Subsidies

As scheduled under current law

Social Security

As scheduled under current lawa

Other Noninterest Spending

As projected in CBO’s baseline through 2023; thereafter, discretionary spending remains at its
2023 percentage of GDP, and “other mandatory spending” (total spending on mandatory
programs other than major health care programs and Social Security) is as scheduled under
current law. Specifically, refundable tax credits are estimated as part of revenue projections, and
the rest of other mandatory spending is assumed to decline as a percentage of GDP after 2023
at the same rate that it is projected to decline between 2018 and 2023.

Individual Income Taxes

As scheduled under current law

Payroll Taxes

As scheduled under current law

Corporate Income Taxes

As scheduled under current law through 2023; remaining constant as a percentage of GDP
thereafter

Excise Taxes

As scheduled under current law

Estate and Gift Taxes

As scheduled under current law

Other Sources of Revenues

As scheduled under current law through 2023; remaining constant as a percentage of GDP
thereafter

Assumptions About Revenues

Source: Congressional Budget Office.
Notes: The extended baseline generally adheres closely to current law, following CBO’s 10-year baseline budget projections through 2023 and
then extending the baseline concept for the rest of the long-term projection period.
For CBO’s most recent 10-year baseline projections, see Congressional Budget Office, Updated Budget Projections: Fiscal Years 2013

to 2023 (May 2013), www.cbo.gov/publication/44172.
GDP = gross domestic product.
a. Assumes the payment of full benefits as calculated under current law, regardless of the amounts available in the program’s trust funds.

CBO
10

THE 2013 LONG-TERM BUDGET OUTLOOK

SEPTEMBER 2013

Figure 1-1.

Federal Debt Held by the Public Under CBO’s Extended Baseline
(Percentage of gross domestic product)
120

Actual

Projected

World War II

80
Great
Depression

40

0
1790

World War I

Civil War

1806

1822

1838

1854

1870

1886

1902

1918

1934

1950

1966

1982

1998

2014

2030

Source: Congressional Budget Office. For details about the sources of data used for past debt held by the public, see Congressional Budget
Office, Historical Data on Federal Debt Held by the Public (July 2010), www.cbo.gov/publication/21728.
Notes: The extended baseline generally adheres closely to current law, following CBO’s 10-year baseline budget projections through 2023 and
then extending the baseline concept for the rest of the long-term projection period. The long-term projections of debt do not reflect
the economic effects of the policies underlying the extended baseline. (For an analysis of those effects and their impact on debt, see
Chapter 6.)
Data from 1929 onward reflect recent revisions by the Bureau of Economic Analysis to estimates of gross domestic product (GDP) in
past years and CBO’s extrapolation of those revisions to projected future GDP
.

generally stayed the same, federal debt would be quite
high in 2038 under a wide range of possible assumptions
about key factors that affect budgetary outcomes. (For a
discussion of the uncertainty of CBO’s long-term budget
projections and budgetary outcomes under alternative
assumptions about some of those factors, see Chapter 7.)

The Fiscal Gap
How much would policies have to change to avoid
increasing federal debt further relative to the size of the
economy? One answer comes from looking at the fiscal
gap, which measures the change in spending or revenues
that would be necessary to keep the ratio of debt to GDP
the same at the end of a given period as at the beginning
of the period. The fiscal gap is conceptually similar to the
actuarial balances that are commonly reported for the
trust funds for Part A of Medicare and Social Security (see
Table 2-2 on page 46 and Table 3-1 on page 53). All
three measures quantify a long-term shortfall or surplus
in present-value terms—that is, as a single number that
describes a flow of future revenues or outlays in terms of
an equivalent lump sum received or spent today—and all
three can be expressed as a percentage of GDP.4

CBO

The Size of Policy Changes to Close the Fiscal Gap. In
CBO’s extended baseline, the fiscal gap for 2014 to 2038
amounts to 0.8 percent of GDP. In other words, relative
to projections that generally follow current law, a permanent combination of cuts in spending and increases in
revenues totaling 0.8 percent of GDP beginning in
2014—about $145 billion in that year—would result
in debt that was equal to 73 percent of GDP 25 years
from now, the same as the current percentage. If those

4. The fiscal gap equals the present value of revenues over a given
period minus the present value of noninterest outlays over that
period, adjusted to keep federal debt at its current percentage of
GDP. Specifically, current debt is added to the outlay measure,
and the present value of the target end-of-period debt (which
equals GDP in the last year of the period multiplied by the ratio
of debt to GDP at the end of 2013) is added to the revenue measure. The present value of the projected stream of future revenues
is computed by taking the revenue estimate for each year, discounting it to 2014 dollars, and summing the resulting estimates.
The same method is applied to the projected stream of noninterest
outlays. CBO used a discount rate equal to the average real interest rate on federal debt held by the public, which was assumed to
be 2.7 percent over the long term, as explained below.
CHAPTER ONE

THE 2013 LONG-TERM BUDGET OUTLOOK

11

Table 1-2.

Projected Spending and Revenues in Selected Years Under CBO’s Extended Baseline
(Percentage of gross domestic product)
2013

2023

2038

3.0
1.7
4.9
10.0
___

3.3
2.6
5.3
7.6
___

4.9
3.2
6.2
7.1
___

19.5

18.8

21.3

1.3
___
20.8

3.1
___
21.8

4.9
___
26.2

Revenues

17.0

18.5

19.7

Deficit (-)
Excluding net interest
Total

-2.5
-3.9

-0.3
-3.3

-1.6
-6.4

73

71

100

3.5

4.0

5.8

Spending
Noninterest
Medicare (Net of offsetting receipts) a
Medicaid, CHIP, and exchange subsidies
Social Security
Other
Subtotal
Net interest
Total Spending

Debt Held by the Public at the End of the Year
Memorandum:

Gross Medicare Spending a
Source: Congressional Budget Office.

Notes: The extended baseline generally adheres closely to current law, following CBO’s 10-year baseline budget projections through 2023 and
then extending the baseline concept for the rest of the long-term projection period.
The numbers shown here for 2013 and 2023 differ from those published in Congressional Budget Office, Updated Budget Projections:
Fiscal Years 2013 to 2023 (May 2013), www.cbo.gov/publication/44172, because of recent revisions by the Bureau of Economic
Analysis to estimates of gross domestic product (GDP) in past years and CBO’s extrapolation of those revisions to projected future GDP
.
CHIP = Children’s Health Insurance Program.
a. Medicare spending net of offsetting receipts reflects premium payments by beneficiaries and certain other receipts used to offset a
portion of spending for the Medicare program; gross Medicare spending does not include those offsetting receipts.

permanent changes came entirely from revenues or
entirely from spending, they would amount to roughly a
4½ percent increase in revenues or a 4½ percent cut in
noninterest spending relative to the amounts projected
for the 2014–2038 period.5
Increases in revenues or cuts in noninterest spending
would have to be larger to reduce debt to percentages of
GDP more typical of recent decades. For example, bringing debt back down to 39 percent of GDP in 2038—as
it was at the end of 2008—would require a combination
of revenue increases and cuts in noninterest spending
(relative to current-law projections) totaling 2.0 percent
of GDP for the next 25 years. (In 2014, 2.0 percent of
5. Those figures do not reflect the economic effects of the policies
underlying the extended baseline. (For analysis of those effects, see
Chapter 6.)

GDP would be about $350 billion.) If those changes
came entirely from revenues, they would represent an
increase of 11 percent relative to the amount projected
for the 2014–2038 period; if they came entirely from
spending, they would represent a cut of 10½ percent in
noninterest spending from the amount projected for
that period.
The Timing of Policy Changes to Close the Fiscal Gap. In
deciding how quickly to implement policies to put federal debt on a sustainable path, lawmakers face trade-offs.
On the one hand, waiting to reduce federal spending or
increase taxes would lead to a greater accumulation of
debt and would increase the size of the policy adjustments needed to put the budget on a sustainable course.
To illustrate the impact of delay, CBO simulated the
effects of closing the fiscal gap beginning in 2015, 2020,
or 2025. For example, if lawmakers wanted to keep debt

CBO
12

THE 2013 LONG-TERM BUDGET OUTLOOK

SEPTEMBER 2013

Figure 1-2.

Size of the Reductions in Noninterest
Spending or Increases in Revenues Needed to
Close the Fiscal Gap Through 2038, Starting
in Various Years
(Percentage of gross domestic product)
2.0

1.5

1.0

0.5

0
2015

2020

2025

Year Actions Begin

Source: Congressional Budget Office.
Note: The fiscal gap is a measure of the difference between
projected federal noninterest spending and revenues over a
given period. It represents the extent to which the government would need to immediately and permanently raise tax
revenues or cut spending—or do both, to some degree—to
make the government’s debt the same size (relative to gross
domestic product) at the end of the period that it is at the
end of 2013.

at 73 percent of GDP in 2038 but did not begin making
policy changes until 2020, the combination of increases
in revenues and reductions in spending over that period
would have to equal 1.3 percent of GDP, rather than the
0.8 percent needed to close the fiscal gap starting in 2014
(see Figure 1-2). If lawmakers waited until 2025 to take
actions to accomplish that objective, the policy changes
over the 2025–2038 period would have to amount to
1.9 percent of GDP. Those simulations omit the effects
that deficits and debt would have on economic growth
and interest rates in the intervening years; incorporating
such effects would make the impact of delaying policy
changes even larger.
On the other hand, implementing spending cuts or tax
increases quickly would weaken the current economic
expansion and would give people little time to plan and
adjust to the policy changes. The negative short-term
effects of deficit reduction on output and employment

CBO

would be especially strong now, because output is so far
below its potential (or maximum sustainable) level that
the Federal Reserve is keeping short-term interest rates
near zero and could not lower them further to offset the
impact of changes in fiscal policy. By contrast, reductions
in federal spending or increases in taxes a few years from
now would have a smaller effect on output and employment because short-term interest rates would probably be
well above zero at that time, so the Federal Reserve could
adjust those rates in response to changes in fiscal policy.
Even if policy changes were not implemented for a few
years, however, making decisions about those changes
quickly would give people more time to plan and would
tend to increase output and employment in the next
few years by holding down longer-term interest rates,
reducing uncertainty, and enhancing businesses’ and
consumers’ confidence.
Another trade-off confronting policymakers about the
timing of deficit reduction involves the effects on different generations. Reducing deficits sooner would require
more sacrifices from older workers and retirees for the
benefit of younger workers and future generations. In a
previous analysis, CBO assessed the economic impact of
waiting a decade to resolve the long-term imbalance in
the federal budget.6 CBO compared economic outcomes
under a policy that would stabilize the ratio of debt to
GDP starting in 2015 with outcomes under a policy that
would delay stabilizing that ratio until 2025. The analysis
suggested that generations born after about 2015 would
be worse off if action to stabilize the debt-to-GDP ratio
was postponed from 2015 to 2025. People born before
1990, however, would be better off if action was
delayed—largely because they would partly or wholly
avoid the policy changes needed to stabilize the debt—
and generations born between 1990 and 2015 could
either gain or lose from a delay, depending on the details
of the policy changes used to keep the debt stable.7

6. Congressional Budget Office, Economic Impacts of Waiting to
Resolve the Long-Term Budget Imbalance (December 2010),
www.cbo.gov/publication/21959. That analysis was based on
slower growth in debt than CBO now projects, so the effects of a
similar policy today would not be exactly the same, although they
would be qualitatively similar.
7. Those conclusions do not incorporate the possible negative effects
stemming from a potential fiscal crisis and from the government’s
reduced flexibility to respond to unexpected challenges. Such negative effects, which are discussed in the next section, were not
incorporated in that earlier analysis.
CHAPTER ONE

Consequences of Large and
Growing Federal Debt
The high and rising amounts of federal debt held by the
public that CBO projects for coming decades under the
extended baseline would have significant negative consequences for both the economy and the federal budget.
Those consequences include reducing the total amounts
of national saving and income; increasing the government’s interest payments, thereby putting more pressure
on the rest of the budget; limiting lawmakers’ flexibility
to respond to unexpected events; and increasing the
likelihood of a fiscal crisis.

Less National Saving and Future Income
Large federal budget deficits over the long term would
reduce investment, resulting in lower national income
and higher interest rates than would otherwise occur. The
reason is that increased government borrowing would
cause a larger share of the savings potentially available for
investment to be used for purchasing government securities, such as Treasury bonds. Those purchases would
“crowd out” investment in capital goods, such as factories
and computers, which make workers more productive.
Because wages are determined mainly by workers’ productivity, the reduction in investment would also reduce
wages, lessening people’s incentive to work. In addition,
both private borrowers and the government would have
to pay higher interest rates to compete for savings, and
those higher rates would strengthen people’s incentive
to save. However, the rise in private saving would be a
good deal smaller than the increase in federal borrowing
represented by the change in the deficit, so national
saving would decline, as would private investment.
(For a detailed analysis of those economic effects, see
Chapter 6.)
In the short run, though, large federal budget deficits
would tend to boost demand, thus increasing output and
employment relative to what they would be with smaller
deficits. That is especially the case under conditions like
those now prevailing in the United States—with substantial unemployment and underused factories, offices, and
equipment—which have led the Federal Reserve to push
short-term interest rates down almost to zero. The effects
of the higher demand would be temporary because stabilizing forces in the economy tend to move output back
toward its potential level. Those forces include the

THE 2013 LONG-TERM BUDGET OUTLOOK

13

response of prices and interest rates to higher demand, as
well as (in normal times) actions by the Federal Reserve.

Pressure for Larger Tax Increases or
Spending Cuts in the Future
Large amounts of federal debt ordinarily require the government to make large interest payments to its lenders,
and growth in the debt causes those interest payments to
increase. (Net interest payments are currently fairly small
relative to the size of the federal budget because interest
rates are exceptionally low, but CBO projects that those
payments will increase considerably as rates return to
more normal levels.)
Higher interest payments would consume a larger portion of federal revenues, resulting in a larger gap between
the remaining revenues and the amount that would be
spent on federal programs under current law. Hence, if
lawmakers wanted to maintain the benefits and services
that the government is scheduled to provide under current law, while not allowing deficits to increase as interest
payments grew, revenues would have to rise as well. Additional revenues could be raised in many different ways,
but to the extent that they were generated by boosting
marginal tax rates (the rates on an additional dollar of
income), the higher tax rates would discourage people
from working and saving, further reducing output and
income. Alternatively, lawmakers could choose to offset
rising interest costs, at least in part, by reducing benefits
and services. Those reductions could be made in many
ways, but to the extent that they came from cutting federal investments, future output and income would also be
reduced. As another option, lawmakers could respond to
higher interest payments by allowing deficits to increase
for some time, but that approach would require greater
deficit reduction later if lawmakers wanted to avoid a
long-term increase in debt relative to GDP.

Reduced Ability to Respond to Domestic and
International Problems
Having a relatively small amount of outstanding debt
gives a government the ability to borrow funds to address
significant unexpected events, such as recessions, financial crises, and wars. In contrast, having a large amount of
debt leaves a government with less flexibility to address
financial and economic crises, which in many countries

CBO
14

THE 2013 LONG-TERM BUDGET OUTLOOK

have been very costly.8 A large amount of debt could also
harm a country’s national security by constraining military spending in times of crisis or limiting the country’s
ability to prepare for such a crisis.
A few years ago, the size of the U.S. federal debt gave
the government the flexibility to respond to the financial
crisis and severe recession by increasing spending and
cutting taxes to stimulate economic activity, providing
public funding to stabilize the financial sector, and continuing to pay for other programs even as tax revenues
dropped sharply because of the decline in output and
income. If federal debt stayed at its current percentage of
GDP or grew further, the government would find it more
difficult to undertake similar policies in the future. As a
result, future recessions and financial crises could have
larger negative effects on the economy and on people’s
well-being. Moreover, the reduced financial flexibility
and increased dependence on foreign investors that
would accompany a rise in debt could weaken the United
States’ international leadership.

Greater Chance of a Fiscal Crisis
A large and continually growing federal debt would have
another significant negative consequence: It would
increase the probability of a fiscal crisis for the United
States.9 In such a crisis, investors become unwilling to
finance all of a government’s borrowing needs unless they
are compensated with very high interest rates; as a result,
the interest rates on government debt rise suddenly and
sharply relative to rates of return on other assets. That
increase in interest rates reduces the market value of outstanding government bonds, causing losses for investors
who hold them. Such a decline can precipitate a broader
financial crisis by creating losses for mutual funds,
8. See, for example, Carmen M. Reinhart and Kenneth S. Rogoff,
“The Aftermath of Financial Crises,” American Economic Review,
vol. 99, no. 2 (May 2009), pp. 466–472, http://dx.doi.org/
10.1257/aer.99.2.466; and Carmen M. Reinhart and Vincent R.
Reinhart, “After the Fall,” in Federal Reserve Bank of Kansas
City, Macroeconomic Challenges: The Decade Ahead (2011),
www.kansascityfed.org/publicat/sympos/2010/Reinhart_final.pdf
(1.6 MB). Also see Luc Laeven and Fabian Valencia, Systemic
Banking Crises Database: An Update, Working Paper 12-163
(International Monetary Fund, June 2012), www.imf.org/
external/pubs/ft/wp/2012/wp12163.pdf (1 MB).
9. For additional discussion, see Congressional Budget Office,
Federal Debt and the Risk of a Fiscal Crisis (July 2010),
www.cbo.gov/publication/21625.

CBO

SEPTEMBER 2013

pension funds, insurance companies, banks, and other
holders of government debt—losses that may be large
enough to cause some financial institutions to fail.
Unfortunately, there is no way to predict with any confidence whether or when such a fiscal crisis might occur in
the United States. In particular, there is no identifiable
tipping point of debt relative to GDP that indicates that a
crisis is likely or imminent. All else being equal, however,
the larger a government’s debt, the greater the risk of a
fiscal crisis.
The likelihood of such a crisis also depends on the economic environment, both domestic and international. If
investors expect continued economic growth, they are
generally less concerned about debt burdens; conversely,
high debt can reinforce more general concern about an
economy. In many cases around the world, fiscal crises
have begun during recessions and, in turn, have exacerbated them. In some instances, a crisis has been triggered
by news that a government would, for any number of
reasons, need to borrow an unexpectedly large amount
of money. Then, as investors lost confidence and interest
rates spiked, borrowing became more difficult and expensive for the government. That development forced policymakers to either cut spending and increase taxes immediately and substantially to reassure investors, or renege on
the terms of the country’s existing debt, or increase the
supply of money and boost inflation. In some cases, a fiscal crisis also made borrowing more expensive for privatesector borrowers because uncertainty about the government’s response to the crisis reduced confidence in the
viability of private-sector enterprises. Higher privatesector interest rates, combined with reductions in government spending and increases in taxes, have tended to
worsen economic conditions in the short term.
If a fiscal crisis occurred in the United States, policymakers would have only limited—and unattractive—
options for responding to it. In particular, the government would need to undertake some combination of
three approaches: restructuring its debt (that is, seeking
to modify the contractual terms of its existing obligations), pursuing inflationary monetary policy, and
adopting an austerity program of spending cuts and tax
increases. Thus, such a crisis would confront policymakers with extremely difficult choices and probably
have a very significant negative impact on the country.
CHAPTER ONE

CBO’s Assumptions About
Spending and Revenue Policies
To produce the long-term projections in this report,
CBO makes a series of assumptions about future budgetary policies for major categories of spending and revenues, such as Social Security, major health care programs,
other mandatory programs, discretionary programs, and
revenue sources.
CBO projects spending for Social Security and the
government’s major health care programs—Medicare,
Medicaid, the Children’s Health Insurance Program,
and insurance subsidies that will be provided through
the exchanges created under the Affordable Care Act
(ACA)—by estimating outlays for the programs under
the assumption that there will generally be no changes to
current law. (In this report, Medicare outlays are presented net of offsetting receipts, such as premiums paid
by enrollees, which reduce net outlays for that program.)
For the purposes of these projections, CBO assumes that
Social Security and Medicare will always pay benefits as
scheduled under current law, regardless of the status of
the programs’ trust funds. That assumption is consistent
with a statutory requirement that CBO, in its baseline
projections, assume that funding is adequate to make all
payments required by law for entitlement programs.10
(For more details about the long-term projections for
major health care programs and Social Security, see
Chapters 2 and 3.)
For other mandatory programs—such as retirement programs for federal civilian and military employees, certain
veterans’ programs, the Supplemental Nutrition Assistance Program, unemployment compensation, and
refundable tax credits—the long-term projections begin
with CBO’s baseline projections of outlays through 2023,
which include reductions (through 2021) specified in the
Budget Control Act. For years after 2023, CBO projects
outlays for refundable tax credits as part of its revenue
projections and projects spending for the remaining
mandatory programs as a whole—by assuming that such
10. Section 257(b)(1) of the Balanced Budget and Emergency Deficit
Control Act of 1985; 2 U.S.C. §907(b)(1). The balances of the
trust funds represent the total amount that the government is
legally authorized to spend on each program. For a discussion of
the legal issues related to exhaustion of a trust fund, see Christine
Scott, Social Security: What Would Happen If the Trust Funds Ran
Out? Report for Congress RL33514 (Congressional Research Service, June 15, 2012), http://go.usa.gov/DW99 (PDF, 346 KB).

THE 2013 LONG-TERM BUDGET OUTLOOK

15

spending will decline as a share of GDP after 2023 at the
same rate that it is projected to fall between 2018 and
2023—but does not estimate outlays for each program.
(For more details, see Chapter 4.)
Most discretionary appropriations for the 2013–2021
period are assumed in CBO’s baseline to be constrained
by the caps and automatic reductions put in place by
the Budget Control Act of 2011. For 2022 and 2023,
discretionary funding is assumed to grow at the rate of
inflation from the 2021 amount. Funding for certain
purposes, such as war-related activities, is not constrained
by the Budget Control Act’s caps; through 2023, CBO
assumes that such funding will increase each year at the
rate of inflation, starting from the current amount. After
2023, discretionary spending is assumed to remain fixed
at its 2023 percentage of GDP. (For more details, see
Chapter 4.)
Revenue projections through 2023 follow the 10-year
baseline, which incorporates the assumption that various
tax provisions will expire as scheduled, even if they have
routinely been extended in the past. After 2023, rules for
individual income taxes, payroll taxes, excise taxes, and
estate and gift taxes are all assumed to evolve as scheduled
under current law. Because of the structure of current tax
law, total federal revenues from those sources are estimated to grow faster than GDP over the long run. Revenues from corporate income taxes and other sources (such
as receipts from the Federal Reserve System) are assumed
to remain constant as a percentage of GDP after 2023.
(For more details, see Chapter 5.)

CBO’s Projections of Demographic and
Economic Trends
The long-term budget estimates in this report also
depend on projections for a host of demographic and
economic variables; the resulting economic outcomes
are referred to here as the economic benchmark. Annual
projected values for selected demographic and economic
variables for the next 75 years are included in the supplemental data for this report that are available on CBO’s
website (www.cbo.gov).

Demographic Variables
The future size and composition of the U.S. population
will affect federal tax revenues, federal spending, and
the performance of the economy—for example, by
influencing the size of the labor force and the number of

CBO
16

THE 2013 LONG-TERM BUDGET OUTLOOK

beneficiaries of programs such as Medicare and Social
Security. Population projections depend on projections of
fertility, immigration, and mortality. For fertility rates,
CBO adopted the intermediate (midrange) values
assumed in the 2012 report of the Social Security trustees.11 For immigration and mortality, CBO produced its
own projections, which differ from those of the Social
Security trustees. Together, CBO’s long-term assumptions about fertility, mortality, and immigration imply a
total U.S. population of 392 million in 2038, compared
with 321 million today. CBO also used its own projection of the rate at which people will qualify for Social
Security’s Disability Insurance program.
Immigration. CBO estimates that there was less immigration in recent years, but will be more in the future, than
the Social Security trustees do. In CBO’s view, the recent
recession discouraged immigration to the United States
in the past few years to a greater extent than the trustees
estimate.12 (The total number of immigrants who entered
the country in recent years must be estimated because the
number of unauthorized immigrants is not known.) In
contrast, CBO anticipates more immigration over the
coming decades than the trustees do. For its economic
benchmark, CBO continues to assume that, in the long
run, net immigration will equal 3.2 immigrants per year
for every 1,000 members of the U.S. population, the
average ratio for much of the past two centuries.13 On
that basis, CBO projects that net annual immigration to
the United States will amount to 1.2 million people in
11. See Social Security Administration, The 2012 Annual Report
of the Board of Trustees of the Federal Old-Age and Survivors Insurance and Federal Disability Insurance Trust Funds (April 2012),
www.ssa.gov/OACT/TR/2012/index.html. Detailed data from
the trustees’ 2013 annual report were not available in time for
CBO to incorporate into this analysis.
12. For more background about immigration to the United States,
see Congressional Budget Office, A Description of the Immigrant
Population—2013 Update (May 2013), www.cbo.gov/publication/
44134.
13. That ratio equals the estimated average net flow of immigrants
between 1821 and 2002. See Social Security Administration,
Technical Panel on Assumptions and Methods, Report to the Social
Security Advisory Board (October 2003), p. 28, www.ssab.gov/
Publications/Financing/2003TechnicalPanelRept.pdf (450 KB).
That ratio was also the assumption recommended by the 2011
technical panel; see Social Security Administration, Technical
Panel on Assumptions and Methods, Report to the Social Security
Advisory Board (September 2011), p. 64, www.ssab.gov/Reports/
2011_TPAM_Final_Report.pdf (6.3 MB).

CBO

SEPTEMBER 2013

2024 and 1.3 million in 2038—rather than remain close
to 1.1 million from 2022 on, as the trustees estimate in
their 2013 annual report. The amount of authorized and
unauthorized immigration over the long term is subject
to a great deal of uncertainty, however.
Mortality. CBO has previously used the Social Security
trustees’ projections of mortality rates; this year, however,
it used its own projections. Demographers have
concluded that mortality has improved at a fairly consistent pace in the United States. In the absence of compelling reasons to expect that future trends will differ from
those experienced in the past, CBO projects that mortality rates will decline by an average of 1.17 percent a
year—as they did, on average, between 1950 and 2008.14
That figure is greater than the 0.80 percent average
annual decline projected in the trustees’ 2013 report, but
it is less than the assumption of a 1.26 percent average
annual decline recommended by the Social Security
Administration’s 2011 Technical Panel on Assumptions
and Methods. The panel’s recommendation reflects a
belief that the decline in mortality will be greater in the
future than in the past because of decreases in smoking
rates. However, because of uncertainty about the possible
effects of many other factors, such as obesity and future
medical technology, CBO has based its mortality projections on a simple extrapolation of past trends. Consequently, CBO projects that life expectancy in 2060 will
be 84.9 years, substantially higher than the agency’s estimate of current life expectancy, 78.5 years. (For additional information about why CBO changed its approach
to projecting mortality, see Box A-1 on page 106.)
14. Mortality rates measure the number of deaths per thousand
people in a population. Historically, declines in mortality rates
have varied among age groups, but CBO assumes the same average decline for all ages. For further discussion of mortality patterns
in the past and methods for projecting mortality, see Social Security Administration, Technical Panel on Assumptions and Methods, Report to the Social Security Advisory Board (September 2011),
pp. 55–64, www.ssab.gov/Reports/2011_TPAM_Final_
Report.pdf (6.3 MB). For additional background, see Hilary
Waldron, “Literature Review of Long-Term Mortality Projections,” Social Security Bulletin, vol. 66, no. 1 (2005),
www.socialsecurity.gov/policy/docs/ssb/v66n1/v66n1p16.html;
and John R. Wilmoth, Overview and Discussion of the Social
Security Mortality Projections, working paper for the 2003
Technical Panel on Assumptions and Methods (Social Security
Advisory Board, May 5, 2005), www.ssab.gov/documents/
mort.projection.ssab.pdf (480 KB).
CHAPTER ONE

Disability. Unlike in previous years, CBO now anticipates
that more workers will enroll in the Disability Insurance
program in the future than the Social Security trustees
do. CBO projects that, of the people who have worked
long enough to qualify for disability benefits but are not
yet receiving them, an average of 5.6 per 1,000 will qualify each year (adjusted for changes in the age and sex
makeup of the population, relative to its composition
in 2000).
In the years after the recessions of the early 1990s and
early 2000s, the age- and sex-adjusted rate at which people qualified for Disability Insurance declined by about
half of the amount that it had risen from its low point
before each recession. Assuming the same response after
the 2007–2009 recession suggests an annual qualification
rate of 5.8 per 1,000, the figure recommended by the
2011 Technical Panel on Assumptions and Methods. The
recent recession was unusually severe, however, which
suggests that the rate may fall a bit more in the wake of
the recession than it did during previous economic recoveries. If it fell two-thirds of the way toward its previous
low point, the rate would plateau at 5.6 per 1,000—a
figure midway between the 5.8 per 1,000 recommended
by the 2011 technical panel and the 5.4 per 1,000 used
in the trustees’ 2013 report and in CBO’s long-term
projections last year.15

Economic Variables
For the 2013–2023 period, CBO’s benchmark projections of economic variables—such as the size of the labor
force, interest rates, inflation, and earnings per worker—
match those in its February 2013 economic forecast,
which underlies the agency’s most recent 10-year budget
projections.16 Beyond 2023, the benchmark generally
reflects the economic experience of the past few decades.
Thus, it does not incorporate the effects that projected
changes in the debt-to-GDP ratio and marginal tax rates
would have on economic growth and interest rates.
Rather, it reflects two specific assumptions about fiscal
policy: that debt held by the public will be kept at
15. For more discussion of historical patterns of disability and projection methods, see Social Security Administration, Technical Panel
on Assumptions and Methods, Report to the Social Security Advisory Board (September 2011), pp. 74–82, www.ssab.gov/Reports/
2011_TPAM_Final_Report.pdf (6.3 MB).
16. For more about that economic forecast, see Congressional Budget
Office, The Budget and Economic Outlook: Fiscal Years 2013 to
2023 (February 2013), Chapter 2, www.cbo.gov/publication/
43907.

THE 2013 LONG-TERM BUDGET OUTLOOK

17

71 percent of GDP (the percentage at the end of 2023 in
CBO’s baseline budget projections) and that effective
marginal tax rates on income from work and saving will
remain constant at the levels reached in 2023. (For estimates of how projected deficits and marginal tax rates
would affect the economy under the extended baseline
and some alternative policies, see Chapter 6.)
The Labor Market. Important benchmark projections
about the labor market include estimates of the growth of
the labor force, the average number of hours that people
work, the rate of unemployment, and the share of total
compensation that people receive in the form of taxable
earnings. Those factors affect the amount of tax revenues
that the government collects and the amount of federal
spending on certain programs, such as Social Security.
Growth of the Labor Force. The number of workers will
grow more slowly in coming decades than in past years
because of the retirement of the large baby-boom generation born between 1946 and 1964, lower birth rates, and
a tapering off of increases in women’s participation in the
labor market. The labor force expanded at an average rate
of 1.6 percent a year during the 1970–2010 period, but
CBO projects that it will grow by only about 0.4 percent
a year, on average, between 2023 and 2038 and will
continue to increase at about that rate in later years.
That slowdown in growth is expected to result both from
more workers exiting the labor force and from fewer
workers entering it. More workers are projected to leave
the labor force than in past decades because the older
members of the baby-boom generation have begun reaching retirement age (although the average age at which
people leave the labor force because of retirement has
increased slightly in recent decades). Fewer workers are
projected to enter the labor force than in past decades for
two reasons. First, birth rates have declined (for example,
women had an average of more than three children apiece
in the 1950s and 1960s, compared with fewer than two
children today). Second, participation by women in the
labor force is not projected to increase much, whereas in
the past it rose significantly. For instance, over the 1970–
2010 period, the working-age population (people ages
20 to 64) grew by an average of 1.3 percent a year, but the
labor force grew faster—by 1.6 percent a year—mainly
because of large increases in the participation rate of
women (a factor that was only partly offset by a decline in
the participation rate of men). CBO expects little change
in the participation rates of specific groups after 2023, so

CBO
18

THE 2013 LONG-TERM BUDGET OUTLOOK

SEPTEMBER 2013

the labor force is projected to grow at the same rate as the
working-age population.

from more than 7 percent in 2013 to 5.5 percent in 2018
and to 5.3 percent in 2023.

Average Hours Worked. Different segments of the population work different numbers of hours, on average; for
example, men tend to work more hours than women do,
and people between the ages of 30 and 40 tend to work
more hours than do people between the ages of 50 and
60. CBO’s projections are based on the view that those
differences among groups will remain stable. However,
CBO also expects that over the long term, the composition of the labor force will shift toward certain groups
(such as older workers) that tend to work less, slightly
reducing the average number of hours worked in the
labor force as a whole. CBO estimates that by 2038,
the average number of hours per worker will be about
1 percent less than in 2023.

For years after 2023, CBO assumes an unemployment
rate slightly higher than the estimated natural rate (to
account for the likelihood that some periods of severe
recession will occur over the long term). The natural rate
of unemployment is projected to decline to 5.0 percent
by 2028 and then remain at that level. However, CBO
estimates that since World War II, the unemployment
rate has been 0.3 percentage points higher than the
natural rate, on average, because of shortfalls in overall
demand related to the business cycle. Thus, in the economic benchmark, the average unemployment rate after
2023 is projected to remain at 5.3 percent—0.3 percentage points higher than the natural rate in the long run.19

The Unemployment Rate. In February 2013, CBO projected that the unemployment rate would return to the
natural rate of unemployment by 2018 and remain there
through 2023. (The natural rate of unemployment is the
rate that stems from all sources of unemployment other
than fluctuations in overall demand related to the business cycle—for example, from differences between the
skills of people who are looking for work and the skills
that employers consider necessary to fill vacant positions.) CBO estimates that the natural rate of unemployment rose from 5.0 percent before the recent recession to
about 6.0 percent in 2013 because of mismatches
between the skills and locations of available unemployed
workers and the needs of employers, the availability of
extended unemployment insurance benefits, and the difficulties that the long-term unemployed have in finding
work.17 Those effects are expected to diminish gradually
over the next 10 years as, for example, people acquire new
skills or relocate. In addition, the effect of extended
unemployment benefits is expected to dissipate quickly
because those benefits are scheduled to expire at the end
of this calendar year. However, the difficulties faced by
the long-term unemployed are likely to be more persistent because of the stigma associated with being out
of work for a long period and the resulting erosion of
people’s skills.18 All told, in its 10-year baseline, CBO
projects that the actual unemployment rate will decline

17. See Congressional Budget Office, The Budget and Economic
Outlook: Fiscal Years 2013 to 2023 (February 2013), pp. 44–46,
www.cbo.gov/publication/43907.

CBO

Taxable Earnings as a Share of Compensation. Workers’
total compensation consists of taxable earnings and nontaxable benefits, such as paid leave and employers’ contributions for health insurance and pensions. The share of
total compensation paid in the form of taxable earnings
has slipped over the years—from about 90 percent in
1960 to 80 percent in 2012—mainly because the cost
of health insurance has grown more quickly than total
compensation over the past several decades.20
Looking ahead, CBO expects that health care costs will
continue to rise more rapidly than taxable earnings, a
trend that by itself would further decrease the proportion
of compensation that workers receive as taxable earnings.
However, the Affordable Care Act imposed an excise tax
on some employment-based health insurance plans that
have premiums above a specified threshold. Some
employers and workers will respond to that tax—which
is scheduled to take effect in 2018—by shifting to less
expensive plans, thereby reducing the share of compensation composed of health insurance premiums and
increasing the share composed of taxable earnings. CBO
projects that the effects of the excise tax on the mix of
compensation will roughly offset the effects of rising costs
18. See Congressional Budget Office, Understanding and Responding
to Persistently High Unemployment (February 2012), www.cbo.gov/
publication/42989.
19. In last year’s report on the long-term outlook, the unemployment
rate was projected to equal the natural rate of 5.0 percent in the
long run.
20. For more details, see Congressional Budget Office, How CBO
Projects Income (July 2013), www.cbo.gov/publication/44433.
CHAPTER ONE

for health care for a few decades; thereafter, the impact of
rising health care costs will outweigh the impact of the
tax.21 As a result, in CBO’s benchmark, the share of compensation that workers receive as taxable earnings is projected to remain close to 81 percent until around 2050
and then decline gradually, reaching 78 percent by 2088.
(For more about the projected effects of the excise tax, see
Chapter 5; for a discussion of trends in the costs of health
care, see Chapter 2.)
Interest Rates. CBO’s economic benchmark includes
projections of various interest rates, such as the rate on
10-year Treasury notes, the average interest rate on federal debt held by the public, and the average interest rate
on holdings of the Social Security and Medicare trust
funds. For the long run, CBO projects a real (inflationadjusted) interest rate on 10-year Treasury notes of
3.0 percent, which is near the average of the past six
decades and slightly higher than the rate that CBO
projected for 2023 in its February 2013 baseline.22
In the benchmark projections for interest rates, CBO
takes into account both the assumed size of federal debt
relative to GDP (which, at 71 percent, would be well
above the percentages in recent decades) and the projected growth rate of the labor force (which CBO estimates will be slower than in recent decades). Those two
factors affect projected interest rates in opposite ways:
 Increases in government debt tend to raise interest
rates by causing a larger portion of total savings to be
devoted to buying government securities, thus reducing the savings available to finance private investment.
Therefore, a larger federal debt than in the past several
decades would imply higher interest rates than those
seen during that period.
 The projected slowdown in the growth of the labor
force would increase the ratio of the capital stock (the
21. CBO projects that the effects of the excise tax on the taxable share
of compensation will diminish over time both because CBO
expects that most people will want to have a significant amount of
health insurance and because the ACA set minimum levels of coverage for health insurance plans. Therefore, the number of people
moving to less expensive insurance plans will eventually dwindle.
22. The real interest rates presented in this report were adjusted for
inflation as measured by the increase in the consumer price index.
For the comparison with historical real rates, past values of the
consumer price index were adjusted to account for changes over
time in the way in which that index measures inflation.

THE 2013 LONG-TERM BUDGET OUTLOOK

19

total amount of capital goods) to the supply of labor.
Having more capital goods per worker would reduce
the amount by which additional capital goods would
raise production—that is, it would lower the productivity of incremental units of capital. That lower
productivity would mean that investments in capital
would generate a smaller return, pushing interest rates
lower.23
The effects that those and other factors (such as projected
depreciation rates) would have on the interest rate on
10-year Treasury notes would roughly offset each other,
CBO estimates.24
In CBO’s benchmark, the real interest rate on federal
debt held by the public is projected to average 2.7 percent
over the long term. That rate is slightly lower than the
benchmark rate on 10-year Treasury notes (3.0 percent)
because CBO anticipates that interest rates will be lower
on short-term debt than on long-term debt, as is typically
the case, and the average maturity of federal debt is
expected to be less than 10 years. In general, CBO also
used that 2.7 percent value as a discount rate for calculating the present value of future streams of total federal
revenues and outlays. (The higher the discount rate, the
lower the present value of the future flows.)
The Social Security and Medicare trust funds hold
special-issue bonds that generally earn interest rates that
are higher than the average real interest rate on federal
debt. Therefore, in projecting the balances in the trust
funds and calculating the present value of future streams
of revenues and outlays for those funds, CBO used a
3.0 percent discount rate.
Inflation. The economic benchmark includes projections
of the prices of various categories of goods and services.
23. See Congressional Budget Office, How Slower Growth in the
Labor Force Could Affect the Return on Capital (October 2009),
www.cbo.gov/publication/41325.
24. Depreciation rates are the rates at which investment goods lose
value because of obsolescence, wear, or destruction. In last year’s
report on the long-term outlook, the benchmark assumption for
the long-term ratio of debt to GDP was 61 percent, which was the
figure projected to be reached at the end of the 10-year baseline
period at that time. The increase to 71 percent in this report
would, by itself, have increased the long-term projection for interest rates. However, because CBO also increased its estimate of the
effect of slower labor force growth on interest rates, the impact of
higher debt was largely offset.

CBO
20

THE 2013 LONG-TERM BUDGET OUTLOOK

For that benchmark, CBO projects that the rate of inflation for consumer goods and services—as measured by
the annual rate of change in both the consumer price
index for urban wage earners and clerical workers and the
consumer price index for all urban consumers—will be
2.5 percent in the long run. That rate is the same one that
CBO used for its long-term projections last year and a
little above the rate that CBO projected for 2023 in its
February 2013 baseline.
CBO anticipates that prices will rise at roughly the same
pace for most goods and services over the long term. An
important exception is the prices of capital goods (things,
such as equipment and machinery, that are used to produce other goods and services). Over the past several
decades, prices for capital goods—especially for computer
equipment—have increased more slowly, on average,
than the various consumer price indexes. CBO’s economic benchmark thus incorporates the view that, over
the long term, the prices of capital goods, particularly
computers, will continue to rise more slowly than the
prices of consumer goods and services.
The annual inflation rate for all final goods and services
produced by the economy, as measured by the rate of
increase in the GDP deflator, is projected to average
0.3 percentage points less than the increase in the consumer price indexes over the long term—about the same
differential that CBO projects for 2023.25 The GDP
deflator grows more slowly than the consumer price
indexes for two reasons: because it fully accounts for
consumers’ ability to shift their mix of purchases as some
prices change relative to other prices, and because the
items on whose prices the GDP deflator is based include
a greater proportion of things (such as computers) whose
prices are projected to increase more slowly than those of
most other goods and services.
Growth of Earnings per Worker and Real GDP. In its economic benchmark, CBO projects that over the 2023–
2038 period, real earnings per worker will grow at an
average annual rate of 1.2 percent and real GDP will
grow at an average annual rate of 2.0 percent. For the
longer period from 2023 to 2088, the corresponding
figures are 1.4 percent and 2.2 percent, respectively.26
Those growth rates are derived from the demographic

25. Final goods and services consist of consumer goods and investment goods purchased by businesses.

CBO

SEPTEMBER 2013

and economic variables described above and from projections of the growth of the capital stock and productivity.
The projected growth of the capital stock depends on
assumptions about such key elements as federal fiscal
policy, private saving (saving by households and businesses), flows of capital to and from other countries, and
the rate of increase in the prices of capital goods. Besides
assuming for the benchmark that debt held by the public
remains at 71 percent of GDP after 2023, CBO assumes
that private saving and flows of capital from other countries change by enough to result in a constant rate of
return on investments in capital goods and thus steady
interest rates.
Total factor productivity (real output per unit of combined labor and capital services), which also affects real
earnings per worker, is assumed to grow at an annual rate
of 1.3 percent over the long term. That assumption,
together with the growth projected for the labor supply
and the capital stock, leads CBO to project average
growth in labor productivity (real output per hour
worked) of 1.7 percent a year. Trends in prices, in the
growth of nonwage compensation (such as employerprovided health insurance), and in average hours worked
imply that average growth in real earnings per worker—
1.4 percent—will be a bit slower than average growth in
labor productivity.
Because the unemployment rate is projected to be
0.3 percentage points higher than the natural rate of
unemployment in the long run, the level of GDP is projected to be 0.6 percent lower, on average, than it would
be if unemployment were at the natural rate. That relationship between unemployment and output is consistent
with past experience.
CBO’s projection of the long-term growth rate of real
GDP—2.2 percent a year, on average, over the 2023–
2088 period—is substantially slower than the rate of
economic growth seen in the past few decades, primarily
because of the slowdown that CBO anticipates in the
growth of the labor force. Real GDP per person is

26. The differences in average growth rates between the 2023–2038
and 2023–2088 periods stem primarily from the transition that
occurs during the first several years after 2023 from the economic
conditions at the end of CBO’s 10-year baseline projections to
the economic conditions that CBO expects will exist in the
longer term.
CHAPTER ONE

projected to increase at an average annual rate of 1.3 percent between 2023 and 2038 and 1.6 percent between
2023 and 2088, compared with 2.1 percent during the
40 years before the start of the 2007–2009 recession.27
The projected long-term average growth rate of real output (2.2 percent) is less than the projected long-term
average real interest rate on federal debt held by the public (2.7 percent). That difference would mark a change
from the experience of the past few decades, when interest rates on federal debt were, on average, roughly equal
to the growth rate of output. Thus, for any given budget
policies, federal debt is projected to climb faster relative
to output than it would if the difference were closer to its
historical average.
Alternative Economic Assumptions. CBO varied some of
its economic assumptions to illustrate the uncertainty
of long-term budget projections. In particular, the agency
examined how using different assumptions about the
long-term growth of total factor productivity, interest
rates on federal debt, and the growth of federal spending
on health care would affect budget projections. That
analysis incorporated the economic effects of fiscal policy,
which result in higher projected debt than an analysis
that does not account for such effects. As an example of
the impact of alternative assumptions, if productivity
was assumed to grow during the next 25 years at a rate
0.5 percentage points higher or lower than the rate
underlying CBO’s projections, and if all other assumptions were the same as those underlying the extended
baseline, projected debt would be as high as 156 percent
of GDP in 2038 or as low as 65 percent (which would
still be high by historical standards). If the annual growth
of federal spending on health care during the next
25 years was projected to differ by 0.5 percentage points
from the rate underlying CBO’s projections, and all other
assumptions were kept the same, projected debt in 2038
would range from 123 percent of GDP to 94 percent.
(For more details, see Chapter 7.) By comparison, with
economic effects included and all other assumptions the
same as in the extended baseline, debt would reach
108 percent of GDP in 2038.
27. As noted above, the differences in average growth rates between
the 2023–2038 and 2023–2088 periods stem primarily from the
transition that occurs during the first several years after 2023 from
the economic conditions at the end of CBO’s 10-year baseline
projections to the economic conditions that CBO expects will
exist in the longer term.

THE 2013 LONG-TERM BUDGET OUTLOOK

21

Projected Spending Through 2038
Federal outlays other than those for the government’s net
interest costs have averaged 18 percent of GDP over the
past 40 years. Noninterest spending has been unusually
high in the past few years because of the recent financial
crisis and recession and the policies implemented in
response to them (as well as underlying growth in the
costs of Social Security and major health care programs).
Noninterest spending spiked to 23 percent of GDP in
2009 and then declined, falling to about 19 percent this
year. CBO projects that, if current laws affecting spending were unchanged, noninterest outlays would continue
to decrease gradually relative to GDP until 2018, when
they would equal their historical average of 18 percent.
Thereafter, however, under the assumptions of the
extended baseline, noninterest spending would rise,
reaching 21 percent of GDP by 2038 and remaining on
an upward path. (Differences between those long-term
projections and the ones that CBO published last year are
discussed briefly at the end of this chapter and in more
detail in Appendix A.)
Under current law, spending for net interest would jump
from 1.3 percent of GDP this year to more than 3 percent 10 years from now. By 2038, interest costs would
reach nearly 5 percent of GDP, bringing total federal
spending to 26 percent of GDP (see Figure 1-3). Federal
spending has been a greater percentage of GDP only
three times in U.S. history—for three years during World
War II, when it topped 40 percent of GDP.

Outlays for Major Health Care Programs and
Social Security
Mandatory programs have accounted for a sharply rising
share of the federal government’s noninterest spending in
the past few decades; that share has averaged 60 percent
in recent years. Most of the growth in mandatory spending has involved the three largest programs—Social Security, Medicare, and Medicaid. Federal outlays for those
three programs together made up more than 40 percent
of the government’s noninterest spending, on average,
during the past 10 years, compared with a quarter in
1973.
Most of the projected growth in noninterest spending as
a share of GDP over the long term is expected to come
from the government’s major health care programs:
Medicare, Medicaid, the Children’s Health Insurance
Program, and subsidies to help people purchase health

CBO
22

THE 2013 LONG-TERM BUDGET OUTLOOK

SEPTEMBER 2013

Figure 1-3.

Spending and Revenues Under CBO’s Extended Baseline, Compared With Past Averages
(Percentage of gross domestic product)

Average,
1973–2012
2013
2038

Other Noninterest
Spending

Major Health Care
Programs

Social Security
4.2

11.2

2.7

4.9

10.0

4.6

6.2

8.0

Total Outlays

7.1

Total Revenues

2.2
1.3
4.9

Deficit

Average,
1973–2012

20.4

17.4

2013

20.8

17.0

2038

Net Interest

26.2

-3.0
-3.9

19.7

-6.4

Source: Congressional Budget Office.
Notes: The extended baseline generally adheres closely to current law, following CBO’s 10-year baseline budget projections through 2023 and
then extending the baseline concept for the rest of the long-term projection period.
These numbers reflect recent revisions by the Bureau of Economic Analysis to estimates of gross domestic product (GDP) in past years
and CBO’s extrapolation of those revisions to projected future GDP
.
Major health care programs consist of Medicare, Medicaid, the Children’s Health Insurance Program, and subsidies offered through
new health insurance exchanges. (Medicare spending is net of offsetting receipts.) Other noninterest spending is all federal spending
other than that for major health care programs, Social Security, and net interest.

insurance through the exchanges created under the
Affordable Care Act. Under current law, total outlays for
those health care programs, net of offsetting receipts,
would grow much faster than the economy, increasing
from almost 5 percent of GDP now to 8 percent in 2038
(see Chapter 2). Spending for Social Security would also
increase relative to the size of the economy, but by much
less—from almost 5 percent of GDP in 2013 to more
than 6 percent in the 2030s and beyond (see Chapter 3).
Those projected increases in spending stem from three
factors: the aging of the population; rising health care
spending per beneficiary; and changes related to the
ACA, specifically the introduction of exchange subsidies
and the expansion of Medicaid in many states. (Box 1-1
on page 24 provides a quantitative breakdown of the roles
that those three factors play in CBO’s spending projections for major health care programs and Social Security.)
Aging of the Population. The aging of the baby-boom
generation portends a long-lasting shift in the age profile
of the U.S. population. That shift will substantially alter

CBO

the balance between the working-age and retirement-age
segments of the population. During the next decade
alone, the number of people over the age of 65 is
expected to rise by more than a third. Over the longer
term, the share of the population age 65 or older is projected to grow from about 14 percent now to 21 percent
in 2038, whereas the share of the population ages 20 to
64 is expected to fall from 60 percent to 55 percent.
Those trends are expected to continue in later decades,
though at a slower pace, as life expectancy increases
further. The change in the age profile of the population
will be even greater among the oldest segment: CBO
projects that the share of the population age 80 or older
will rise from 4 percent today to 7 percent in 2038. That
increase is especially important for government spending
because per capita outlays on federal health care programs
rise with age.
The aging of the population is the main factor driving the
projected growth of Social Security spending as a percentage of GDP. Initial Social Security benefits are based on a
person’s earnings, which are indexed to the overall growth
CHAPTER ONE

of wages in the economy. As a result, average benefits
increase at approximately the same rate as average earnings, so economic growth does not significantly alter
spending for Social Security as a share of GDP. Rather,
that share depends primarily on the ratio of the number
of people of working age to the number of Social Security
beneficiaries. CBO projects that the number of people of
working age per beneficiary will decline significantly over
the next quarter century—from about three now to about
two in 2038—and then continue to drift downward.
Rising Health Care Spending per Beneficiary. Although
the growth of health care spending has slowed recently,
CBO projects that spending per enrollee in federal health
care programs will continue to increase at a faster pace
than per capita GDP. However, the difference between
those two growth rates will be smaller than its average of
recent decades, CBO projects. The reason is that even if
federal laws do not change, continuing increases in health
care spending will create mounting pressure for state governments and the private sector to slow the growth of
such spending, and their responses to that pressure will
affect federal spending as well. For instance, as states
move to limit their costs for Medicaid (a program in
which the federal government matches a certain percentage of states’ spending), the growth of per capita federal
spending on those programs is expected to slow. Similarly, efforts to limit increases in the cost of private health
insurance are expected to slow the rise of subsidies
provided through the insurance exchanges.
Growth in Medicare spending per beneficiary is also
projected to slow even without legislative action (though
to a lesser degree than for the other major health care programs) because the Centers for Medicare & Medicaid
Services (CMS) is likely, over time, to implement costsaving changes to the Medicare program and because of
changes that will occur in the health care system as a
whole. For example, CMS has the authority to expand
demonstration projects that prove capable of slowing the
rise of Medicare spending without reducing the quality
of care. In addition, Medicare may benefit from the spillover effects of private-sector initiatives to improve the
efficiency of the health care system.
Effects of the Insurance Coverage Provisions of the
Affordable Care Act. The ACA will result in new federal
spending on subsidies for private health insurance and
greater federal spending on Medicaid.28 Beginning in
calendar year 2014, individuals will be able to purchase

THE 2013 LONG-TERM BUDGET OUTLOOK

23

private health insurance through exchanges established by
the ACA. The federal government will subsidize the cost
of those purchases for some people with income between
100 percent and 400 percent of the federal poverty guidelines. The subsidies will limit the percentage of income
that eligible people have to pay to buy a relatively lowcost insurance plan that provides a specified level of benefits; people who choose more expensive plans will have to
pay higher amounts. In addition, as a result of the ACA
and a subsequent Supreme Court ruling, each state will
have the option to expand eligibility for Medicaid beginning in calendar year 2014 to include all nonelderly
adults with income below 138 percent of the federal
poverty guidelines.

Other Noninterest Outlays
CBO projects that, under the assumptions used for this
analysis, total federal spending for everything besides
the major health care programs, Social Security, and net
interest would decline to smaller percentages of GDP
than have been seen for more than 70 years. Such spending, which currently equals about 10 percent of GDP, has
made up more than 8 percent of GDP each year since the
late 1930s. In the extended baseline, it is projected to fall
below 8 percent of GDP in 2020 and then continue to
decline slowly, dropping to about 7 percent of GDP in
2038 (see Chapter 4 for details).
Spending for discretionary programs is projected to
decline significantly over the next 10 years—from
7½ percent of GDP to 5½ percent—because the constraints on discretionary spending imposed by the Budget
Control Act are scheduled to limit the growth of such
spending to a rate well below that of GDP. For its longterm projections, CBO assumed that discretionary outlays would remain at 5½ percent of GDP after 2023.
Spending for mandatory programs other than health care
programs and Social Security is also projected to decline
during the next 10 years. Such “other mandatory spending” is unusually high now—about 3 percent of GDP—
28. The ACA included many other provisions that will affect federal
revenues and federal spending for Medicare and other programs.
Taking the coverage provisions and the other provisions together,
CBO and the staff of the Joint Committee on Taxation have
estimated that the ACA will reduce deficits over the next 10 years
and in the subsequent decade; see Congressional Budget Office,
letter to the Honorable John Boehner providing an estimate for
H.R. 6079, the Repeal of Obamacare Act (July 24, 2012),
www.cbo.gov/publication/43471.

CBO
Cbo 2013 ltbo44521 ltbo 0

Más contenido relacionado

La actualidad más candente

CBO’s Updated Budget and Economic Projections
CBO’s Updated Budget and Economic Projections CBO’s Updated Budget and Economic Projections
CBO’s Updated Budget and Economic Projections Congressional Budget Office
 
CBO’s Budget and Economic Analysis During the Pandemic
CBO’s Budget and Economic Analysis During the PandemicCBO’s Budget and Economic Analysis During the Pandemic
CBO’s Budget and Economic Analysis During the PandemicCongressional Budget Office
 
Comparing CBO’s Long-Term Projections With Those of the Social Security Trustees
Comparing CBO’s Long-Term Projections With Those of the Social Security TrusteesComparing CBO’s Long-Term Projections With Those of the Social Security Trustees
Comparing CBO’s Long-Term Projections With Those of the Social Security TrusteesCongressional Budget Office
 
Potential Spending on Veterans’ Health Care, 2018–2028
Potential Spending on Veterans’ Health Care, 2018–2028Potential Spending on Veterans’ Health Care, 2018–2028
Potential Spending on Veterans’ Health Care, 2018–2028Congressional Budget Office
 
On The Budget and Economic Outlook: 2019 to 2029
On The Budget and Economic Outlook: 2019 to 2029On The Budget and Economic Outlook: 2019 to 2029
On The Budget and Economic Outlook: 2019 to 2029Congressional Budget Office
 
Charts from CBO's January 2012 Budget and Economic Outlook
Charts from CBO's January 2012 Budget and Economic OutlookCharts from CBO's January 2012 Budget and Economic Outlook
Charts from CBO's January 2012 Budget and Economic OutlookCongressional Budget Office
 
Projected Costs of U.S. Nuclear Forces, 2015 to 2024
Projected Costs of U.S. Nuclear Forces, 2015 to 2024Projected Costs of U.S. Nuclear Forces, 2015 to 2024
Projected Costs of U.S. Nuclear Forces, 2015 to 2024Congressional Budget Office
 
Congressional Proposals Related to a Lapse in Appropriations
Congressional Proposals Related to a Lapse in AppropriationsCongressional Proposals Related to a Lapse in Appropriations
Congressional Proposals Related to a Lapse in AppropriationsCongressional Budget Office
 
How CBO Adjusts for Underreporting of Means-Tested Transfers in Its Distribut...
How CBO Adjusts for Underreporting of Means-Tested Transfers in Its Distribut...How CBO Adjusts for Underreporting of Means-Tested Transfers in Its Distribut...
How CBO Adjusts for Underreporting of Means-Tested Transfers in Its Distribut...Congressional Budget Office
 
Determinants of public health care expenditure & fiscal sustainability - Thom...
Determinants of public health care expenditure & fiscal sustainability - Thom...Determinants of public health care expenditure & fiscal sustainability - Thom...
Determinants of public health care expenditure & fiscal sustainability - Thom...OECD Governance
 
Correcting for Underreporting of Government Transfers: A Regression-Based App...
Correcting for Underreporting of Government Transfers: A Regression-Based App...Correcting for Underreporting of Government Transfers: A Regression-Based App...
Correcting for Underreporting of Government Transfers: A Regression-Based App...Congressional Budget Office
 
Approaches for Increasing the Productivity of Federal Infrastructure Spending
Approaches for Increasing the Productivity of Federal Infrastructure SpendingApproaches for Increasing the Productivity of Federal Infrastructure Spending
Approaches for Increasing the Productivity of Federal Infrastructure SpendingCongressional Budget Office
 
Estimating the Revenue Effects of Proposals to Increase Funding for Tax Enfor...
Estimating the Revenue Effects of Proposals to Increase Funding for Tax Enfor...Estimating the Revenue Effects of Proposals to Increase Funding for Tax Enfor...
Estimating the Revenue Effects of Proposals to Increase Funding for Tax Enfor...Congressional Budget Office
 

La actualidad más candente (20)

CBO’s Updated Budget and Economic Projections
CBO’s Updated Budget and Economic Projections CBO’s Updated Budget and Economic Projections
CBO’s Updated Budget and Economic Projections
 
CBO’s Budget and Economic Analysis During the Pandemic
CBO’s Budget and Economic Analysis During the PandemicCBO’s Budget and Economic Analysis During the Pandemic
CBO’s Budget and Economic Analysis During the Pandemic
 
An Overview of CBO’s Work on Climate Change
An Overview of CBO’s Work on Climate ChangeAn Overview of CBO’s Work on Climate Change
An Overview of CBO’s Work on Climate Change
 
Comparing CBO’s Long-Term Projections With Those of the Social Security Trustees
Comparing CBO’s Long-Term Projections With Those of the Social Security TrusteesComparing CBO’s Long-Term Projections With Those of the Social Security Trustees
Comparing CBO’s Long-Term Projections With Those of the Social Security Trustees
 
Potential Spending on Veterans’ Health Care, 2018–2028
Potential Spending on Veterans’ Health Care, 2018–2028Potential Spending on Veterans’ Health Care, 2018–2028
Potential Spending on Veterans’ Health Care, 2018–2028
 
Understanding the 2016 Budget Outlook
Understanding the 2016 Budget OutlookUnderstanding the 2016 Budget Outlook
Understanding the 2016 Budget Outlook
 
On The Budget and Economic Outlook: 2019 to 2029
On The Budget and Economic Outlook: 2019 to 2029On The Budget and Economic Outlook: 2019 to 2029
On The Budget and Economic Outlook: 2019 to 2029
 
Charts from CBO's January 2012 Budget and Economic Outlook
Charts from CBO's January 2012 Budget and Economic OutlookCharts from CBO's January 2012 Budget and Economic Outlook
Charts from CBO's January 2012 Budget and Economic Outlook
 
Projected Costs of U.S. Nuclear Forces, 2015 to 2024
Projected Costs of U.S. Nuclear Forces, 2015 to 2024Projected Costs of U.S. Nuclear Forces, 2015 to 2024
Projected Costs of U.S. Nuclear Forces, 2015 to 2024
 
CBO’s 10-Year Budget and Economic Projections
CBO’s 10-Year Budget and Economic ProjectionsCBO’s 10-Year Budget and Economic Projections
CBO’s 10-Year Budget and Economic Projections
 
Productivity and Growth in CBO’s Forecasts
Productivity and Growth in CBO’s ForecastsProductivity and Growth in CBO’s Forecasts
Productivity and Growth in CBO’s Forecasts
 
Congressional Proposals Related to a Lapse in Appropriations
Congressional Proposals Related to a Lapse in AppropriationsCongressional Proposals Related to a Lapse in Appropriations
Congressional Proposals Related to a Lapse in Appropriations
 
How CBO Adjusts for Underreporting of Means-Tested Transfers in Its Distribut...
How CBO Adjusts for Underreporting of Means-Tested Transfers in Its Distribut...How CBO Adjusts for Underreporting of Means-Tested Transfers in Its Distribut...
How CBO Adjusts for Underreporting of Means-Tested Transfers in Its Distribut...
 
Prospects for DoD's Budget Over the Next Decade
Prospects for DoD's Budget Over the Next DecadeProspects for DoD's Budget Over the Next Decade
Prospects for DoD's Budget Over the Next Decade
 
Determinants of public health care expenditure & fiscal sustainability - Thom...
Determinants of public health care expenditure & fiscal sustainability - Thom...Determinants of public health care expenditure & fiscal sustainability - Thom...
Determinants of public health care expenditure & fiscal sustainability - Thom...
 
Correcting for Underreporting of Government Transfers: A Regression-Based App...
Correcting for Underreporting of Government Transfers: A Regression-Based App...Correcting for Underreporting of Government Transfers: A Regression-Based App...
Correcting for Underreporting of Government Transfers: A Regression-Based App...
 
Approaches for Increasing the Productivity of Federal Infrastructure Spending
Approaches for Increasing the Productivity of Federal Infrastructure SpendingApproaches for Increasing the Productivity of Federal Infrastructure Spending
Approaches for Increasing the Productivity of Federal Infrastructure Spending
 
Transparency at CBO
Transparency at CBOTransparency at CBO
Transparency at CBO
 
Overview of the Federal Budget
Overview of the Federal BudgetOverview of the Federal Budget
Overview of the Federal Budget
 
Estimating the Revenue Effects of Proposals to Increase Funding for Tax Enfor...
Estimating the Revenue Effects of Proposals to Increase Funding for Tax Enfor...Estimating the Revenue Effects of Proposals to Increase Funding for Tax Enfor...
Estimating the Revenue Effects of Proposals to Increase Funding for Tax Enfor...
 

Destacado

Community Management Advice
Community Management AdviceCommunity Management Advice
Community Management AdviceDebra Ulrich
 
Sentidos y prácticas del uso de internet
Sentidos y prácticas del uso de internetSentidos y prácticas del uso de internet
Sentidos y prácticas del uso de internetangel11082004
 
Mid term review key
Mid term review keyMid term review key
Mid term review keyfarrellw
 
Amateur-Expert Ametuer Travellers: Three developing trends to shape travel ma...
Amateur-Expert Ametuer Travellers: Three developing trends to shape travel ma...Amateur-Expert Ametuer Travellers: Three developing trends to shape travel ma...
Amateur-Expert Ametuer Travellers: Three developing trends to shape travel ma...Enterprise Security Risk Management
 
Business Case Guide
Business Case GuideBusiness Case Guide
Business Case Guideeuweben01
 
Каталог участников выставки "Бот Экспо. Одесса" и "Дайвинг Экспо. Одесса" 200...
Каталог участников выставки "Бот Экспо. Одесса" и "Дайвинг Экспо. Одесса" 200...Каталог участников выставки "Бот Экспо. Одесса" и "Дайвинг Экспо. Одесса" 200...
Каталог участников выставки "Бот Экспо. Одесса" и "Дайвинг Экспо. Одесса" 200...Polina Tashakova
 
Frightful Deeds and Scary Reads
Frightful Deeds and Scary ReadsFrightful Deeds and Scary Reads
Frightful Deeds and Scary Readsteresakatsulos
 
Office Postures - Pls follow
Office Postures - Pls followOffice Postures - Pls follow
Office Postures - Pls followagtest2
 

Destacado (8)

Community Management Advice
Community Management AdviceCommunity Management Advice
Community Management Advice
 
Sentidos y prácticas del uso de internet
Sentidos y prácticas del uso de internetSentidos y prácticas del uso de internet
Sentidos y prácticas del uso de internet
 
Mid term review key
Mid term review keyMid term review key
Mid term review key
 
Amateur-Expert Ametuer Travellers: Three developing trends to shape travel ma...
Amateur-Expert Ametuer Travellers: Three developing trends to shape travel ma...Amateur-Expert Ametuer Travellers: Three developing trends to shape travel ma...
Amateur-Expert Ametuer Travellers: Three developing trends to shape travel ma...
 
Business Case Guide
Business Case GuideBusiness Case Guide
Business Case Guide
 
Каталог участников выставки "Бот Экспо. Одесса" и "Дайвинг Экспо. Одесса" 200...
Каталог участников выставки "Бот Экспо. Одесса" и "Дайвинг Экспо. Одесса" 200...Каталог участников выставки "Бот Экспо. Одесса" и "Дайвинг Экспо. Одесса" 200...
Каталог участников выставки "Бот Экспо. Одесса" и "Дайвинг Экспо. Одесса" 200...
 
Frightful Deeds and Scary Reads
Frightful Deeds and Scary ReadsFrightful Deeds and Scary Reads
Frightful Deeds and Scary Reads
 
Office Postures - Pls follow
Office Postures - Pls followOffice Postures - Pls follow
Office Postures - Pls follow
 

Similar a Cbo 2013 ltbo44521 ltbo 0

The Current Outlook for the Economy and the Budget
The Current Outlook for the Economy and the BudgetThe Current Outlook for the Economy and the Budget
The Current Outlook for the Economy and the BudgetCongressional Budget Office
 
An Overview of the 2022 Long-Term Budget Outlook
An Overview of the 2022 Long-Term Budget OutlookAn Overview of the 2022 Long-Term Budget Outlook
An Overview of the 2022 Long-Term Budget OutlookCongressional Budget Office
 
An Overview of the 2022 Long-Term Budget Outlook
An Overview of the 2022 Long-Term Budget OutlookAn Overview of the 2022 Long-Term Budget Outlook
An Overview of the 2022 Long-Term Budget OutlookCongressional Budget Office
 
The Budget, the Economy, and the Budgetary Effects of Legislative Changes
The Budget, the Economy, and the Budgetary Effects of Legislative ChangesThe Budget, the Economy, and the Budgetary Effects of Legislative Changes
The Budget, the Economy, and the Budgetary Effects of Legislative ChangesCongressional Budget Office
 
How CBO Prepares Projections of Federal Spending for Social Security and Majo...
How CBO Prepares Projections of Federal Spending for Social Security and Majo...How CBO Prepares Projections of Federal Spending for Social Security and Majo...
How CBO Prepares Projections of Federal Spending for Social Security and Majo...Congressional Budget Office
 
Long-Term Projections of Health Care Spending and the Implications for the Fe...
Long-Term Projections of Health Care Spending and the Implications for the Fe...Long-Term Projections of Health Care Spending and the Implications for the Fe...
Long-Term Projections of Health Care Spending and the Implications for the Fe...Congressional Budget Office
 
Budget and economic outlook 2014 to 2024
Budget and economic outlook 2014 to 2024Budget and economic outlook 2014 to 2024
Budget and economic outlook 2014 to 2024Luis Taveras EMBA, MS
 
The Budget and Economic Outlook for 2023 to 2033 in 9 Slides
The Budget and Economic Outlook for 2023 to 2033 in 9 SlidesThe Budget and Economic Outlook for 2023 to 2033 in 9 Slides
The Budget and Economic Outlook for 2023 to 2033 in 9 SlidesCongressional Budget Office
 
An Overview of the 2021 Long-Term Budget Outlook
An Overview of the 2021 Long-Term Budget OutlookAn Overview of the 2021 Long-Term Budget Outlook
An Overview of the 2021 Long-Term Budget OutlookCongressional Budget Office
 
The Budget: Health Care, Energy, and Telecommunications
The Budget: Health Care, Energy, and TelecommunicationsThe Budget: Health Care, Energy, and Telecommunications
The Budget: Health Care, Energy, and TelecommunicationsCongressional Budget Office
 
An Overview of The 2018 Budget and Economic Outlook
An Overview of The 2018 Budget and Economic OutlookAn Overview of The 2018 Budget and Economic Outlook
An Overview of The 2018 Budget and Economic OutlookCongressional Budget Office
 
CBO’s Role and Most Recent Long-Term Budget Projections
CBO’s Role and Most Recent Long-Term Budget ProjectionsCBO’s Role and Most Recent Long-Term Budget Projections
CBO’s Role and Most Recent Long-Term Budget ProjectionsCongressional Budget Office
 
CBO’s Analysis of the Long-Term Budgetary Outlook
CBO’s Analysis of the Long-Term Budgetary OutlookCBO’s Analysis of the Long-Term Budgetary Outlook
CBO’s Analysis of the Long-Term Budgetary OutlookCongressional Budget Office
 
A Presentation on The Budget and Economic Outlook: 2023 to 2033
A Presentation on The Budget and Economic Outlook: 2023 to 2033A Presentation on The Budget and Economic Outlook: 2023 to 2033
A Presentation on The Budget and Economic Outlook: 2023 to 2033Congressional Budget Office
 
An Overview of the 2021 Long-Term Budget Outlook
An Overview of the 2021 Long-Term Budget OutlookAn Overview of the 2021 Long-Term Budget Outlook
An Overview of the 2021 Long-Term Budget OutlookCongressional Budget Office
 

Similar a Cbo 2013 ltbo44521 ltbo 0 (20)

CBO’s 2023 Long-Term Budget Projections
CBO’s 2023 Long-Term Budget ProjectionsCBO’s 2023 Long-Term Budget Projections
CBO’s 2023 Long-Term Budget Projections
 
The Current Outlook for the Economy and the Budget
The Current Outlook for the Economy and the BudgetThe Current Outlook for the Economy and the Budget
The Current Outlook for the Economy and the Budget
 
U.S. Macroeconomic & Fiscal Outlook
U.S. Macroeconomic & Fiscal OutlookU.S. Macroeconomic & Fiscal Outlook
U.S. Macroeconomic & Fiscal Outlook
 
The Economy and the Budget
The Economy and the BudgetThe Economy and the Budget
The Economy and the Budget
 
An Overview of the 2022 Long-Term Budget Outlook
An Overview of the 2022 Long-Term Budget OutlookAn Overview of the 2022 Long-Term Budget Outlook
An Overview of the 2022 Long-Term Budget Outlook
 
An Overview of the 2022 Long-Term Budget Outlook
An Overview of the 2022 Long-Term Budget OutlookAn Overview of the 2022 Long-Term Budget Outlook
An Overview of the 2022 Long-Term Budget Outlook
 
The Budget, the Economy, and the Budgetary Effects of Legislative Changes
The Budget, the Economy, and the Budgetary Effects of Legislative ChangesThe Budget, the Economy, and the Budgetary Effects of Legislative Changes
The Budget, the Economy, and the Budgetary Effects of Legislative Changes
 
The 2018 Long-Term Budget Outlook in 25 Slides
The 2018 Long-Term Budget Outlook in 25 SlidesThe 2018 Long-Term Budget Outlook in 25 Slides
The 2018 Long-Term Budget Outlook in 25 Slides
 
The Budget and Economic Outlook: 2022 to 2032
The Budget and Economic Outlook: 2022 to 2032The Budget and Economic Outlook: 2022 to 2032
The Budget and Economic Outlook: 2022 to 2032
 
How CBO Prepares Projections of Federal Spending for Social Security and Majo...
How CBO Prepares Projections of Federal Spending for Social Security and Majo...How CBO Prepares Projections of Federal Spending for Social Security and Majo...
How CBO Prepares Projections of Federal Spending for Social Security and Majo...
 
Long-Term Projections of Health Care Spending and the Implications for the Fe...
Long-Term Projections of Health Care Spending and the Implications for the Fe...Long-Term Projections of Health Care Spending and the Implications for the Fe...
Long-Term Projections of Health Care Spending and the Implications for the Fe...
 
Budget and economic outlook 2014 to 2024
Budget and economic outlook 2014 to 2024Budget and economic outlook 2014 to 2024
Budget and economic outlook 2014 to 2024
 
The Budget and Economic Outlook for 2023 to 2033 in 9 Slides
The Budget and Economic Outlook for 2023 to 2033 in 9 SlidesThe Budget and Economic Outlook for 2023 to 2033 in 9 Slides
The Budget and Economic Outlook for 2023 to 2033 in 9 Slides
 
An Overview of the 2021 Long-Term Budget Outlook
An Overview of the 2021 Long-Term Budget OutlookAn Overview of the 2021 Long-Term Budget Outlook
An Overview of the 2021 Long-Term Budget Outlook
 
The Budget: Health Care, Energy, and Telecommunications
The Budget: Health Care, Energy, and TelecommunicationsThe Budget: Health Care, Energy, and Telecommunications
The Budget: Health Care, Energy, and Telecommunications
 
An Overview of The 2018 Budget and Economic Outlook
An Overview of The 2018 Budget and Economic OutlookAn Overview of The 2018 Budget and Economic Outlook
An Overview of The 2018 Budget and Economic Outlook
 
CBO’s Role and Most Recent Long-Term Budget Projections
CBO’s Role and Most Recent Long-Term Budget ProjectionsCBO’s Role and Most Recent Long-Term Budget Projections
CBO’s Role and Most Recent Long-Term Budget Projections
 
CBO’s Analysis of the Long-Term Budgetary Outlook
CBO’s Analysis of the Long-Term Budgetary OutlookCBO’s Analysis of the Long-Term Budgetary Outlook
CBO’s Analysis of the Long-Term Budgetary Outlook
 
A Presentation on The Budget and Economic Outlook: 2023 to 2033
A Presentation on The Budget and Economic Outlook: 2023 to 2033A Presentation on The Budget and Economic Outlook: 2023 to 2033
A Presentation on The Budget and Economic Outlook: 2023 to 2033
 
An Overview of the 2021 Long-Term Budget Outlook
An Overview of the 2021 Long-Term Budget OutlookAn Overview of the 2021 Long-Term Budget Outlook
An Overview of the 2021 Long-Term Budget Outlook
 

Último

7.pdf This presentation captures many uses and the significance of the number...
7.pdf This presentation captures many uses and the significance of the number...7.pdf This presentation captures many uses and the significance of the number...
7.pdf This presentation captures many uses and the significance of the number...Paul Menig
 
Call Girls In DLf Gurgaon ➥99902@11544 ( Best price)100% Genuine Escort In 24...
Call Girls In DLf Gurgaon ➥99902@11544 ( Best price)100% Genuine Escort In 24...Call Girls In DLf Gurgaon ➥99902@11544 ( Best price)100% Genuine Escort In 24...
Call Girls In DLf Gurgaon ➥99902@11544 ( Best price)100% Genuine Escort In 24...lizamodels9
 
Call Girls in Delhi, Escort Service Available 24x7 in Delhi 959961-/-3876
Call Girls in Delhi, Escort Service Available 24x7 in Delhi 959961-/-3876Call Girls in Delhi, Escort Service Available 24x7 in Delhi 959961-/-3876
Call Girls in Delhi, Escort Service Available 24x7 in Delhi 959961-/-3876dlhescort
 
VIP Call Girls In Saharaganj ( Lucknow ) 🔝 8923113531 🔝 Cash Payment (COD) 👒
VIP Call Girls In Saharaganj ( Lucknow  ) 🔝 8923113531 🔝  Cash Payment (COD) 👒VIP Call Girls In Saharaganj ( Lucknow  ) 🔝 8923113531 🔝  Cash Payment (COD) 👒
VIP Call Girls In Saharaganj ( Lucknow ) 🔝 8923113531 🔝 Cash Payment (COD) 👒anilsa9823
 
KYC-Verified Accounts: Helping Companies Handle Challenging Regulatory Enviro...
KYC-Verified Accounts: Helping Companies Handle Challenging Regulatory Enviro...KYC-Verified Accounts: Helping Companies Handle Challenging Regulatory Enviro...
KYC-Verified Accounts: Helping Companies Handle Challenging Regulatory Enviro...Any kyc Account
 
9599632723 Top Call Girls in Delhi at your Door Step Available 24x7 Delhi
9599632723 Top Call Girls in Delhi at your Door Step Available 24x7 Delhi9599632723 Top Call Girls in Delhi at your Door Step Available 24x7 Delhi
9599632723 Top Call Girls in Delhi at your Door Step Available 24x7 DelhiCall Girls in Delhi
 
Value Proposition canvas- Customer needs and pains
Value Proposition canvas- Customer needs and painsValue Proposition canvas- Customer needs and pains
Value Proposition canvas- Customer needs and painsP&CO
 
Pharma Works Profile of Karan Communications
Pharma Works Profile of Karan CommunicationsPharma Works Profile of Karan Communications
Pharma Works Profile of Karan Communicationskarancommunications
 
Event mailer assignment progress report .pdf
Event mailer assignment progress report .pdfEvent mailer assignment progress report .pdf
Event mailer assignment progress report .pdftbatkhuu1
 
Monthly Social Media Update April 2024 pptx.pptx
Monthly Social Media Update April 2024 pptx.pptxMonthly Social Media Update April 2024 pptx.pptx
Monthly Social Media Update April 2024 pptx.pptxAndy Lambert
 
Monte Carlo simulation : Simulation using MCSM
Monte Carlo simulation : Simulation using MCSMMonte Carlo simulation : Simulation using MCSM
Monte Carlo simulation : Simulation using MCSMRavindra Nath Shukla
 
RSA Conference Exhibitor List 2024 - Exhibitors Data
RSA Conference Exhibitor List 2024 - Exhibitors DataRSA Conference Exhibitor List 2024 - Exhibitors Data
RSA Conference Exhibitor List 2024 - Exhibitors DataExhibitors Data
 
HONOR Veterans Event Keynote by Michael Hawkins
HONOR Veterans Event Keynote by Michael HawkinsHONOR Veterans Event Keynote by Michael Hawkins
HONOR Veterans Event Keynote by Michael HawkinsMichael W. Hawkins
 
Grateful 7 speech thanking everyone that has helped.pdf
Grateful 7 speech thanking everyone that has helped.pdfGrateful 7 speech thanking everyone that has helped.pdf
Grateful 7 speech thanking everyone that has helped.pdfPaul Menig
 
Enhancing and Restoring Safety & Quality Cultures - Dave Litwiller - May 2024...
Enhancing and Restoring Safety & Quality Cultures - Dave Litwiller - May 2024...Enhancing and Restoring Safety & Quality Cultures - Dave Litwiller - May 2024...
Enhancing and Restoring Safety & Quality Cultures - Dave Litwiller - May 2024...Dave Litwiller
 
M.C Lodges -- Guest House in Jhang.
M.C Lodges --  Guest House in Jhang.M.C Lodges --  Guest House in Jhang.
M.C Lodges -- Guest House in Jhang.Aaiza Hassan
 
Call Girls In Panjim North Goa 9971646499 Genuine Service
Call Girls In Panjim North Goa 9971646499 Genuine ServiceCall Girls In Panjim North Goa 9971646499 Genuine Service
Call Girls In Panjim North Goa 9971646499 Genuine Serviceritikaroy0888
 

Último (20)

7.pdf This presentation captures many uses and the significance of the number...
7.pdf This presentation captures many uses and the significance of the number...7.pdf This presentation captures many uses and the significance of the number...
7.pdf This presentation captures many uses and the significance of the number...
 
Call Girls In DLf Gurgaon ➥99902@11544 ( Best price)100% Genuine Escort In 24...
Call Girls In DLf Gurgaon ➥99902@11544 ( Best price)100% Genuine Escort In 24...Call Girls In DLf Gurgaon ➥99902@11544 ( Best price)100% Genuine Escort In 24...
Call Girls In DLf Gurgaon ➥99902@11544 ( Best price)100% Genuine Escort In 24...
 
VVVIP Call Girls In Greater Kailash ➡️ Delhi ➡️ 9999965857 🚀 No Advance 24HRS...
VVVIP Call Girls In Greater Kailash ➡️ Delhi ➡️ 9999965857 🚀 No Advance 24HRS...VVVIP Call Girls In Greater Kailash ➡️ Delhi ➡️ 9999965857 🚀 No Advance 24HRS...
VVVIP Call Girls In Greater Kailash ➡️ Delhi ➡️ 9999965857 🚀 No Advance 24HRS...
 
Call Girls in Delhi, Escort Service Available 24x7 in Delhi 959961-/-3876
Call Girls in Delhi, Escort Service Available 24x7 in Delhi 959961-/-3876Call Girls in Delhi, Escort Service Available 24x7 in Delhi 959961-/-3876
Call Girls in Delhi, Escort Service Available 24x7 in Delhi 959961-/-3876
 
VIP Call Girls In Saharaganj ( Lucknow ) 🔝 8923113531 🔝 Cash Payment (COD) 👒
VIP Call Girls In Saharaganj ( Lucknow  ) 🔝 8923113531 🔝  Cash Payment (COD) 👒VIP Call Girls In Saharaganj ( Lucknow  ) 🔝 8923113531 🔝  Cash Payment (COD) 👒
VIP Call Girls In Saharaganj ( Lucknow ) 🔝 8923113531 🔝 Cash Payment (COD) 👒
 
KYC-Verified Accounts: Helping Companies Handle Challenging Regulatory Enviro...
KYC-Verified Accounts: Helping Companies Handle Challenging Regulatory Enviro...KYC-Verified Accounts: Helping Companies Handle Challenging Regulatory Enviro...
KYC-Verified Accounts: Helping Companies Handle Challenging Regulatory Enviro...
 
9599632723 Top Call Girls in Delhi at your Door Step Available 24x7 Delhi
9599632723 Top Call Girls in Delhi at your Door Step Available 24x7 Delhi9599632723 Top Call Girls in Delhi at your Door Step Available 24x7 Delhi
9599632723 Top Call Girls in Delhi at your Door Step Available 24x7 Delhi
 
Value Proposition canvas- Customer needs and pains
Value Proposition canvas- Customer needs and painsValue Proposition canvas- Customer needs and pains
Value Proposition canvas- Customer needs and pains
 
Pharma Works Profile of Karan Communications
Pharma Works Profile of Karan CommunicationsPharma Works Profile of Karan Communications
Pharma Works Profile of Karan Communications
 
Event mailer assignment progress report .pdf
Event mailer assignment progress report .pdfEvent mailer assignment progress report .pdf
Event mailer assignment progress report .pdf
 
Monthly Social Media Update April 2024 pptx.pptx
Monthly Social Media Update April 2024 pptx.pptxMonthly Social Media Update April 2024 pptx.pptx
Monthly Social Media Update April 2024 pptx.pptx
 
Monte Carlo simulation : Simulation using MCSM
Monte Carlo simulation : Simulation using MCSMMonte Carlo simulation : Simulation using MCSM
Monte Carlo simulation : Simulation using MCSM
 
RSA Conference Exhibitor List 2024 - Exhibitors Data
RSA Conference Exhibitor List 2024 - Exhibitors DataRSA Conference Exhibitor List 2024 - Exhibitors Data
RSA Conference Exhibitor List 2024 - Exhibitors Data
 
HONOR Veterans Event Keynote by Michael Hawkins
HONOR Veterans Event Keynote by Michael HawkinsHONOR Veterans Event Keynote by Michael Hawkins
HONOR Veterans Event Keynote by Michael Hawkins
 
unwanted pregnancy Kit [+918133066128] Abortion Pills IN Dubai UAE Abudhabi
unwanted pregnancy Kit [+918133066128] Abortion Pills IN Dubai UAE Abudhabiunwanted pregnancy Kit [+918133066128] Abortion Pills IN Dubai UAE Abudhabi
unwanted pregnancy Kit [+918133066128] Abortion Pills IN Dubai UAE Abudhabi
 
Grateful 7 speech thanking everyone that has helped.pdf
Grateful 7 speech thanking everyone that has helped.pdfGrateful 7 speech thanking everyone that has helped.pdf
Grateful 7 speech thanking everyone that has helped.pdf
 
Enhancing and Restoring Safety & Quality Cultures - Dave Litwiller - May 2024...
Enhancing and Restoring Safety & Quality Cultures - Dave Litwiller - May 2024...Enhancing and Restoring Safety & Quality Cultures - Dave Litwiller - May 2024...
Enhancing and Restoring Safety & Quality Cultures - Dave Litwiller - May 2024...
 
Forklift Operations: Safety through Cartoons
Forklift Operations: Safety through CartoonsForklift Operations: Safety through Cartoons
Forklift Operations: Safety through Cartoons
 
M.C Lodges -- Guest House in Jhang.
M.C Lodges --  Guest House in Jhang.M.C Lodges --  Guest House in Jhang.
M.C Lodges -- Guest House in Jhang.
 
Call Girls In Panjim North Goa 9971646499 Genuine Service
Call Girls In Panjim North Goa 9971646499 Genuine ServiceCall Girls In Panjim North Goa 9971646499 Genuine Service
Call Girls In Panjim North Goa 9971646499 Genuine Service
 

Cbo 2013 ltbo44521 ltbo 0

  • 1. CONGRESS OF THE UNITED STATES CONGRESSIONAL BUDGET OFFICE CBO The 2013 Long-Term Budget Outlook Percentage of GDP 120 Actual Projected 100 80 60 Federal Debt Held by the Public 40 Federal Spending 20 Federal Revenues 0 2000 2004 2008 2012 2016 2020 SEPTEMBER 2013 2024 2028 2032 2036
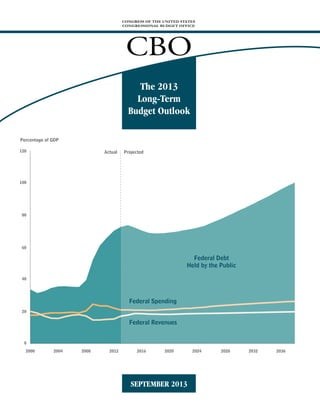
  • 2. Notes Unless otherwise indicated, the years referred to in most of this report are federal fiscal years (which run from October 1 to September 30). In Chapters 6 and 7, budgetary values, such as the ratio of debt or deficits to gross domestic product (GDP), are presented on a fiscal year basis, whereas economic variables, such as gross national product (GNP) or interest rates, are presented on a calendar year basis. In this report, historical values for GDP and GNP and budget figures expressed as ratios to GDP reflect revised data from the national income and product accounts that were released by the Bureau of Economic Analysis on July 31, 2013. In addition, all projections reflect CBO’s extrapolation of those revisions to projected future GDP and GNP. Because historical values for GDP have been increased but no changes have been made to budget data, budget figures expressed as ratios to GDP are lower than they were before the revisions. For more information, see Congressional Budget Office, “Updated Historical Budget Data Following BEA’s Recent Update of the National Income and Product Accounts,” CBO Blog (August 12, 2013), www.cbo.gov/publication/44508. Numbers in the text, tables, and figures of this report may not add up to totals because of rounding. The Affordable Care Act comprises the Patient Protection and Affordable Care Act; the health care provisions of the Health Care and Education Reconciliation Act of 2010; and, in the case of this report, the effects of subsequent related judicial decisions, statutory changes, and administrative actions. The figure on the cover shows federal revenues, spending, and debt held by the public under the Congressional Budget Office’s (CBO’s) extended baseline. That baseline generally adheres closely to current law, following CBO’s 10-year baseline budget projections through 2023 and then extending the baseline concept for the rest of the long-term projection period. Additional data—including the data underlying the figures in this report, supplemental budget projections, the economic variables underlying those projections, and projections of the total U.S. population—are posted along with the report on CBO’s website (www.cbo.gov/ publication/44521). Many of the terms used in the report are defined in a glossary available on the website (www.cbo.gov/publication/42904). CBO Pub. No. 4713
  • 3. Contents Summary 1 1 The Long-Term Outlook for the Federal Budget 7 The Budget Outlook for the Next 10 Years The Long-Term Budgetary Imbalance Consequences of Large and Growing Federal Debt CBO’s Assumptions About Spending and Revenue Policies CBO’s Projections of Demographic and Economic Trends Projected Spending Through 2038 BOX 1-1. CAUSES OF PROJECTED GROWTH IN FEDERAL SPENDING FOR MAJOR HEALTH CARE PROGRAMS AND SOCIAL SECURITY 7 8 13 15 15 21 Projected Revenues Through 2038 Changes From Last Year’s Long-Term Budget Outlook 2 24 26 26 The Long-Term Outlook for Major Federal Health Care Programs 29 Overview of Major Government Health Care Programs The Historical Growth of Health Care Spending CBO’s Methodology for Long-Term Projections of Federal Health Care Spending Long-Term Projections of Spending for Major Health Care Programs 30 35 BOX 2-1. NATIONAL SPENDING ON HEALTH CARE 38 42 44 3 The Long-Term Outlook for Social Security 49 How Social Security Works The Outlook for Social Security Spending and Revenues 49 51 4 The Long-Term Outlook for Other Federal Noninterest Spending 57 Other Federal Noninterest Spending Over the Past Four Decades Long-Term Projections of Other Federal Noninterest Spending 57 58 CBO
  • 4. II THE 2013 LONG-TERM BUDGET OUTLOOK 5 SEPTEMBER 2013 The Long-Term Outlook for Federal Revenues 63 Revenues Over the Past 40 Years Revenue Projections Under CBO’s Extended Baseline 64 65 BOX 5-1. IMPACT OF THE AMERICAN TAXPAYER RELIEF ACT OF 2012 ON REVENUES Structural Features of the Individual Income Tax System Tax Provisions Enacted in the Affordable Care Act Long-Term Implications for Tax Rates and the Tax Burden 66 67 68 70 6 The Economic and Budgetary Effects of Alternative Budget Policies 75 Long-Term Effects of the Fiscal Policies Underlying the Extended Baseline Long-Term Effects of an Alternative Fiscal Scenario With Larger Deficits Long-Term Effects of Two Illustrative Scenarios With Smaller Deficits Short-Term Effects of the Three Additional Fiscal Scenarios 76 83 85 89 7 The Uncertainty of Long-Term Budget Projections 93 103 New Legislation and Changes in Assumptions and Methods 103 106 108 Budget Projections Through 2088 113 119 About This Document CBO Changes in CBO’s Long-Term Projections Since June 2012 List of Tables and Figures B 93 99 102 Changes in Projections Under the Extended Baseline A The Long-Term Budgetary Effects of Differences in Productivity, Interest Rates, and Federal Spending on Health Care Other Risks to the Long-Term Budget Outlook Implications of Uncertainty for the Design of Fiscal Policy 121 BOX A-1. WHY CBO CHANGED ITS APPROACH TO PROJECTING MORTALITY
  • 5. Summary B etween 2009 and 2012, the federal government recorded the largest budget deficits relative to the size of the economy since 1946, causing federal debt to soar. Federal debt held by the public is now about 73 percent of the economy’s annual output, or gross domestic product (GDP). That percentage is higher than at any point in U.S. history except a brief period around World War II, and it is twice the percentage at the end of 2007. If current laws generally remained in place, federal debt held by the public would decline slightly relative to GDP over the next several years, the Congressional Budget Office (CBO) projects. After that, however, growing deficits would ultimately push debt back above its current high level. CBO projects that federal debt held by the public would reach 100 percent of GDP in 2038, 25 years from now, even without accounting for the harmful effects that growing debt would have on the economy (see Summary Figure 1). Moreover, debt would be on an upward path relative to the size of the economy, a trend that could not be sustained indefinitely. Budget Projections for the Next 10 Years The economy’s gradual recovery from the 2007–2009 recession, the waning budgetary effects of policies enacted in response to the weak economy, and other changes to tax and spending policies have caused the deficit to shrink this year to its smallest size since 2008: roughly 4 percent of GDP, compared with a peak of almost 10 percent in 2009. If current laws governing taxes and spending were generally unchanged—an assumption that underlies CBO’s 10-year baseline budget projections—the deficit would continue to drop over the next few years, falling to 2 percent of GDP by 2015. As a result, by 2018, federal debt held by the public would decline to 68 percent of GDP.1 However, budget deficits would gradually rise again under current law, CBO projects, mainly because of increasing interest costs and growing spending for Social Security and the government’s major health care programs (Medicare, Medicaid, the Children’s Health Insurance Program, and subsidies to be provided through health insurance exchanges). CBO expects interest rates to rebound in coming years from their current unusually low levels, sharply raising the government’s cost of borrowing. In addition, the pressures of an aging population, rising health care costs, and an expansion of federal subsidies for health insurance would cause spending for some of the largest federal programs to increase relative to GDP. By 2023, CBO projects, the budget deficit would grow to almost 3½ percent of GDP under current law, and federal debt held by the public would equal 71 percent of GDP and would be on an upward trajectory. Budget Projections for the Long Term Looking beyond the 10-year period covered by its regular baseline projections, CBO produced an extended baseline for this report that extrapolates those projections through 2038 (and, with even greater uncertainty, through later decades). Under the extended baseline, budget deficits would rise steadily and, by 2038, would push federal debt held by the public close to the percentage of GDP seen just after World War II—even without factoring in the harm that growing debt would cause to the economy. 1. For details about CBO’s most recent 10-year baseline, see Congressional Budget Office, Updated Budget Projections: Fiscal Years 2013 to 2023 (May 2013), www.cbo.gov/publication/ 44172. In July 2013, the Bureau of Economic Analysis (BEA) revised upward the historical values for GDP; CBO extrapolated those revisions for this report when projecting outcomes as a percentage of future GDP. Although CBO’s projections of revenues, outlays, deficits, and debt over the 2013–2023 period have not changed since the baseline projections issued in May, those amounts measured as a percentage of GDP are now lower as a result of BEA’s revisions. In this summary, budgetary values presented as a percentage of GDP have been rounded to the nearest one-half percent. CBO
  • 6. 2 THE 2013 LONG-TERM BUDGET OUTLOOK SEPTEMBER 2013 Summary Figure 1. Debt, Spending, and Revenues Under CBO’s Extended Baseline (Percentage of gross domestic product) Federal Debt Held by the Public 120 Actual 120 Projected 80 80 40 40 0 0 2000 2002 2004 2006 2008 2010 2012 2014 2016 2018 2020 2022 2024 2026 2028 2030 2032 2034 2036 2038 Total Spending and Revenues 30 Actual 30 Projected Spending 20 20 Revenues 10 10 0 0 2000 2002 2004 2006 2008 2010 2012 2014 2016 2018 2020 2022 2024 2026 2028 2030 2032 2034 2036 2038 Components of Total Spending 16 12 Actual Other Noninterest Spending 16 Projected Federal Spending on a Major Health Care Programs 8 12 8 Social Security 4 4 Net Interest 0 0 2000 2002 2004 2006 2008 2010 2012 2014 2016 2018 2020 2022 2024 2026 2028 2030 2032 2034 2036 2038 Source: Congressional Budget Office. Notes: The extended baseline generally adheres closely to current law, following CBO’s 10-year baseline budget projections through 2023 and then extending the baseline concept for the rest of the long-term projection period. These projections do not reflect the economic effects of the policies underlying the extended baseline. (For an analysis of those effects and their impact on debt, see Chapter 6.) These data reflect recent revisions by the Bureau of Economic Analysis to estimates of GDP in past years and CBO’s extrapolation of those revisions to projected future GDP . a. Spending on Medicare (net of offsetting receipts), Medicaid, the Children’s Health Insurance Program, and subsidies offered through new health insurance exchanges. CBO
  • 7. SUMMARY By 2038, CBO projects, federal spending would increase to 26 percent of GDP under the assumptions of the extended baseline, compared with 22 percent in 2012 and an average of 20½ percent over the past 40 years. That increase reflects the following projected paths for various types of federal spending if current laws generally remain in place:  Federal spending for the major health care programs and Social Security would increase to a total of 14 percent of GDP by 2038, twice the 7 percent average of the past 40 years.  In contrast, total spending on everything other than the major health care programs, Social Security, and net interest payments would decline to 7 percent of GDP, well below the 11 percent average of the past 40 years and a smaller share of the economy than at any time since the late 1930s.  The federal government’s net interest payments would grow to 5 percent of GDP, compared with an average of 2 percent over the past 40 years, mainly because federal debt would be much larger. Federal revenues would equal 19½ percent of GDP by 2038 under current law, CBO projects, compared with an average of 17½ percent over the past four decades. Revenues are projected to rise from 15 percent of GDP last year to 17½ percent in 2014, spurred by the ongoing economic recovery and changes in provisions of tax law (including the expiration of lower income tax rates for high-income people, the expiration of a temporary cut in the Social Security payroll tax, and the imposition of new taxes). After 2014, revenues would increase gradually relative to GDP, largely because growth in income beyond that attributable to inflation would push taxpayers into higher income tax brackets over time. The gap between federal spending and revenues would widen steadily after 2015 under the assumptions of the extended baseline, CBO projects. By 2038, the deficit would be 6½ percent of GDP, larger than in any year between 1947 and 2008, and federal debt held by the public would reach 100 percent of GDP, more than in any year except 1945 and 1946. With such large deficits, federal debt would be growing faster than GDP, a path that would ultimately be unsustainable. THE 2013 LONG-TERM BUDGET OUTLOOK 3 long-term budget outlook. The increase in debt relative to the size of the economy, combined with an increase in marginal tax rates (the rates that would apply to an additional dollar of income), would reduce output and raise interest rates relative to the benchmark economic projections that CBO used in producing the extended baseline. Those economic differences would lead to lower federal revenues and higher interest payments. With those effects included, debt under the extended baseline would rise to 108 percent of GDP in 2038. Harmful Effects of Large and Growing Debt How long the nation could sustain such growth in federal debt is impossible to predict with any confidence. At some point, investors would begin to doubt the government’s willingness or ability to pay U.S. debt obligations, making it more difficult or more expensive for the government to borrow money. Moreover, even before that point was reached, the high and rising amount of debt that CBO projects under the extended baseline would have significant negative consequences for both the economy and the federal budget:  Increased borrowing by the federal government would eventually reduce private investment in productive capital, because the portion of total savings used to buy government securities would not be available to finance private investment. The result would be a smaller stock of capital and lower output and income in the long run than would otherwise be the case. Despite those reductions, however, the continued growth of productivity would make real (inflationadjusted) output and income per person higher in the future than they are now.  Federal spending on interest payments would rise, thus requiring larger changes in tax and spending policies to achieve any chosen targets for budget deficits and debt.  The government would have less flexibility to use tax and spending policies to respond to unexpected challenges, such as economic downturns or wars.  The risk of a fiscal crisis—in which investors demanded very high interest rates to finance the government’s borrowing needs—would increase. Incorporating the economic effects of the federal policies that underlie the extended baseline worsens the CBO
  • 8. 4 THE 2013 LONG-TERM BUDGET OUTLOOK The Consequences of Alternative Fiscal Policies Most of the projections in this report are based on the assumption that federal tax and spending policies will generally follow current law—not because CBO expects laws to remain unchanged but because the budgetary implications of current law are a useful benchmark for policymakers when they consider changes in laws. If tax and spending policies differed significantly from those specified in current law, budgetary outcomes could differ substantially as well. To illustrate the extent of that difference, CBO analyzed the effects of some additional sets of fiscal policies. Under one set of alternative policies, referred to as the extended alternative fiscal scenario, certain policies that are now in place but that are scheduled to change under current law would continue instead, and some provisions of current law that might be difficult to sustain for a long period would be modified. With those changes to current law, deficits (excluding the government’s interest costs) would be a total of about $2 trillion higher over the next decade than in CBO’s baseline; in subsequent years, such deficits would exceed those projected in the extended baseline by rapidly growing amounts. The harmful effects on the economy from the resulting increase in federal debt would be partly offset by lower marginal tax rates. Nevertheless, in the long run, output would be lower and interest rates would be higher under that set of policies than under the extended baseline. With those economic changes incorporated, federal debt held by the public would reach about 190 percent of GDP by 2038, CBO projects. In a different illustrative scenario, deficit reduction would be phased in such that deficits excluding interest costs would be a total of $2 trillion lower through 2023 than in the baseline, and the reduction in the deficit as a percentage of GDP in 2023 would be continued in later years. In that case, output would be higher and interest rates would be lower over the long run than in the extended baseline. Factoring in the effects of those economic changes on the budget, CBO projects that federal debt held by the public would be 67 percent of GDP in 2038, close to its percentage in 2012. Under a third scenario, with twice as much deficit reduction—a $4 trillion reduction in deficits excluding interest costs through 2023—CBO projects that federal debt held by the public CBO SEPTEMBER 2013 would fall to 31 percent of GDP by 2038, slightly below its percentage of GDP in 2007 (35 percent) and its average percentage over the past 40 years (38 percent). Those different scenarios for fiscal policy would also have different effects on the economy in the short term. During the next several years—when the nation’s economic output will probably remain below its potential, or maximum sustainable, level—the spending increases and tax reductions in the alternative fiscal scenario (relative to what would happen under current law) would increase the demand for goods and services and thereby raise output and employment. The reductions in deficits under the other illustrative scenarios, by contrast, would decrease the demand for goods and services and thereby reduce output and employment. The Uncertainty of Long-Term Budget Projections Even if the tax and spending policies specified in current law continue, budgetary outcomes will undoubtedly differ from CBO’s current projections as a result of unexpected changes in the economy, demographics, and other factors. Because the uncertainty of budget projections increases the farther the projections extend into the future, this report focuses on the next 25 years. To illustrate the uncertainty of those projections, CBO examined how altering its assumptions about future productivity, interest rates, and federal spending on health care would affect the projections in the extended baseline. Under those alternative assumptions—which do not cover the full range of possible outcomes—federal debt held by the public in 2038 could range from as low as 65 percent of GDP (still elevated by historical standards) to as high as 156 percent of GDP, compared with the 108 percent of GDP projected under the extended baseline with the economic effects of fiscal policy included. Those calculations do not address other sources of uncertainty, such as the risk of an economic depression or major war or the possibility of unexpected changes in birth rates, life expectancy, immigration, or labor force participation. Nonetheless, CBO’s analysis shows that under a wide range of possible assumptions about some key factors that influence federal spending and revenues, the budget is on an unsustainable path.
  • 9. SUMMARY Choices for the Future The unsustainable nature of the federal government’s current tax and spending policies presents lawmakers and the public with difficult choices. Unless substantial changes are made to the major health care programs and Social Security, those programs will absorb a much larger share of the economy’s total output in the future than they have in the past. Even with spending for all other federal activities on track, by the end of this decade, to represent the smallest share of GDP in more than 70 years, total federal noninterest spending would be larger relative to the size of the economy than it has been, on average, over the past 40 years. The structure of the federal tax code means that revenues would also represent a larger percentage of GDP in the future than they have, on average, in the past few decades—but not large enough to keep federal debt held by the public from growing faster than the economy starting in the next several years. Moreover, because federal debt is already unusually high relative to GDP, further increases in debt could be especially harmful. To put the federal budget on a sustainable path for the long term, lawmakers would have to make significant changes to tax and spending policies—letting revenues rise more than they would under current law, reducing spending for large benefit programs below the projected levels, or adopting some combination of those approaches. The size of such changes would depend on the amount of federal debt that lawmakers considered appropriate. For THE 2013 LONG-TERM BUDGET OUTLOOK 5 example, bringing debt back down to 39 percent of GDP in 2038—as it was at the end of 2008—would require a combination of increases in revenues and cuts in noninterest spending (relative to current law) totaling 2 percent of GDP for the next 25 years. (In 2014, 2 percent of GDP would equal about $350 billion.) If those changes came entirely from revenues, they would represent an increase of 11 percent relative to the amount of revenues projected for the 2014–2038 period; if the changes came entirely from spending, they would represent a cut of 10½ percent in noninterest spending from the amount projected for that period. In deciding how quickly to carry out policy changes to make the size of the federal debt more sustainable, lawmakers face other trade-offs. On the one hand, waiting to cut federal spending or raise taxes would lead to a greater accumulation of debt and would increase the size of the policy adjustments needed to put the budget on a sustainable course. On the other hand, implementing spending cuts or tax increases quickly would weaken the economy’s current expansion and would give people little time to plan for and adjust to the policy changes. The negative short-term effects that deficit reduction has on output and employment would be especially large now, because output is so far below its potential level that the Federal Reserve is keeping short-term interest rates near zero and could not lower those rates further to offset the impact of changes in spending and tax policies. CBO
  • 10.
  • 11. CHAPTER 1 The Long-Term Outlook for the Federal Budget T he federal budget deficit has shrunk noticeably in fiscal year 2013, and it is projected to continue to decline for the next few years. As a result, under current law, federal debt held by the public would be smaller relative to the size of the economy in 2018 than it is now, according to CBO’s projections. The long-term budget outlook is much less positive, however. The aging of the baby-boom generation, together with growth in health care spending per person and an expansion of federal subsidies for health insurance, is expected to steadily boost the government’s spending for Social Security and major health care programs. Barring changes to current law, that additional spending would contribute to rising budget deficits starting in a few years, causing federal debt to swell from a level that is already very high relative to the size of the economy. In this report, the Congressional Budget Office (CBO) presents projections of federal revenues, outlays, deficits, and debt for the next several decades—under the assumption that laws governing taxes and spending remain largely unchanged—and discusses the possible consequences of such budgetary outcomes. The Budget Outlook for the Next 10 Years The budget deficit is expected to decline this year to its smallest size since 2008: roughly 4 percent of the nation’s economic output, or gross domestic product (GDP), less than half of its peak of nearly 10 percent in 2009. That decline reflects the economy’s gradual recovery from the 2007–2009 recession, the waning budgetary effects of policies enacted in response to the recession, and other changes to tax and spending policies. In CBO’s 10-year baseline budget projections, which incorporate the assumption that current laws generally remain in place, the deficit is projected to continue to drop over the next few years, falling to 2 percent of GDP by 2015. As a result, by 2018, federal debt held by the public would decline to 68 percent of GDP from its current level of 73 percent.1 Thereafter, deficits would gradually rise again under current law, CBO projects. Interest rates are expected to rebound from their current unusually low levels, sharply increasing the cost of paying interest on the government’s debt. Moreover, the pressures of an aging population, rising health care costs, and an expansion of federal subsidies for health insurance would cause mandatory spending to rise as a percentage of GDP after 2018.2 In addition, CBO projects, revenues would decline relative to GDP for several years after 2015 as receipts from corporate income taxes and remittances from the Federal Reserve diminished as a share of the economy. By 2023, under current law, the budget deficit would grow to almost 3½ percent of GDP. In that year, federal debt would equal 71 percent of GDP and would be on the rise relative to the size of the economy. 1. For details about CBO’s most recent 10-year baseline, see Congressional Budget Office, Updated Budget Projections: Fiscal Years 2013 to 2023 (May 2013), www.cbo.gov/publication/44172. Since the publication of that report, the Bureau of Economic Analysis has revised upward its estimates of gross domestic product in past years. The numbers shown in this report for budget amounts as a percentage of GDP reflect those revisions to the historical data and CBO’s extrapolation of those revisions to projected future GDP. 2. Lawmakers generally determine spending for mandatory programs by setting eligibility rules, benefit formulas, and other parameters rather than by appropriating specific amounts each year. In that way, mandatory spending differs from discretionary spending, which is controlled by annual appropriation acts. CBO
  • 12. 8 THE 2013 LONG-TERM BUDGET OUTLOOK SEPTEMBER 2013 CBO’s long-term projections extend beyond the usual 10-year budget window, focusing on the 25-year period ending in 2038. They generally adhere closely to current law, following the agency’s May 2013 baseline budget projections through 2023 and then extending the baseline concept into later years; hence, they are referred to as the extended baseline (for details of the assumptions underlying those projections, see Table 1-1). continued to rise relative to GDP, at some point investors would begin to doubt the government’s willingness or ability to pay its debt obligations. Such doubts would make it more difficult or more expensive for the government to borrow money, thus forcing the government to cut spending, raise taxes, or pursue some combination of the two approaches. For that reason, the amount of federal debt held by the public relative to the nation’s annual economic output is an important barometer of the government’s financial position. CBO’s 10-year and extended baselines are meant to serve as benchmarks for measuring the budgetary effects of proposed changes to federal revenues or spending. They are not meant to be predictions of future budgetary outcomes; rather, they represent CBO’s best judgment of how the economy and other factors would affect revenues and spending if current law did not change. By generally following current law, the baselines incorporate the assumption that some policy changes that lawmakers have routinely made in the past—such as preventing the sharp cuts to Medicare’s payment rates for physicians called for by law—will not be made again. Federal debt held by the public stood at 39 percent of GDP at the end of 2008, close to its average of the preceding several decades. Since then, large deficits have caused debt held by the public to grow sharply—to a projected 73 percent of GDP by the end of 2013. Debt has exceeded 70 percent of GDP during only one other period in U.S. history: from 1944 through 1950, when it spiked because of a surge in federal spending during World War II and peaked at 106 percent of GDP (see Figure 1-1 on page 10). The Long-Term Budgetary Imbalance CBO’s extended baseline projections show a substantial imbalance in the federal budget over the long run, with annual revenues consistently falling short of annual outlays. Two measures offer complementary perspectives on the size of that long-term imbalance: Projections of federal debt illustrate how the shortfall of revenues relative to spending accumulates over time, and estimates of the “fiscal gap” summarize the shortfall over a given period in a single value. Both measures show that projected revenues would be insufficient to support projected spending if current law remained largely unchanged. In addition to the extended baseline, CBO has developed an alternative long-term fiscal scenario, which incorporates several possible changes to current law that would result in higher outlays and lower revenues (see Chapter 6 for details). Under that scenario, federal debt would grow even faster than in the extended baseline, so larger policy changes would be needed to close the fiscal gap. The Accumulation of Federal Debt Debt held by the public represents the amount that the federal government has borrowed in financial markets (by issuing Treasury securities) to pay for its operations and activities.3 For a combination of federal spending and revenues to be sustainable over time, debt held by the public must eventually grow no faster than the economy. If debt CBO CBO projects that, under current law, debt held by the public would rise slightly relative to GDP in 2014 and then, because of smaller deficits, decrease to 68 percent of GDP by 2018. Around 2020, with deficits growing again, debt would begin to rise faster than GDP. By 2038, under the extended baseline, federal debt held by the public would reach 100 percent of GDP (see Table 1-2 on page 11)—nearly equal to the percentage just after World War II and almost triple the percentage in 2007— and would be on an upward path. That trajectory for federal debt would ultimately be unsustainable. Projections that far into the future are highly uncertain, of course. Nevertheless, CBO projects that if current law 3. When the federal government borrows in financial markets, it competes with other participants for financial resources and thus can crowd out private investment, reducing economic output and income. In contrast, federal debt held by trust funds and other government accounts represents internal transactions of the government and has no direct effect on financial markets. (That debt and debt held by the public together make up gross federal debt.) For more discussion, see Congressional Budget Office, Federal Debt and Interest Costs (December 2010), www.cbo.gov/ publication/21960. Several factors not directly included in the budget totals also affect the government’s need to borrow from the public. Those factors include increases or decreases in the government’s cash balance as well as the cash flows reflected in the financing accounts used for federal credit programs. Changes in those factors were not modeled for this analysis.
  • 13. CHAPTER ONE THE 2013 LONG-TERM BUDGET OUTLOOK 9 Table 1-1. Assumptions About Spending and Revenues Underlying CBO’s Extended Baseline Assumptions About Spending Medicare As scheduled under current law,a except that three policies that would restrain the growth of Medicare spending are assumed to be in effect only through 2029: – Ongoing reductions in payment updates for most providers in the fee-for-service program (after 2029, those updates are assumed to grow with costs); – The sustainable growth rate mechanism for payment rates for physicians; and – Spending reductions from the process associated with the Independent Payment Advisory Board. Medicaid As scheduled under current law Children’s Health Insurance Program As projected in CBO’s baseline through 2023; remaining constant as a percentage of GDP thereafter Exchange Subsidies As scheduled under current law Social Security As scheduled under current lawa Other Noninterest Spending As projected in CBO’s baseline through 2023; thereafter, discretionary spending remains at its 2023 percentage of GDP, and “other mandatory spending” (total spending on mandatory programs other than major health care programs and Social Security) is as scheduled under current law. Specifically, refundable tax credits are estimated as part of revenue projections, and the rest of other mandatory spending is assumed to decline as a percentage of GDP after 2023 at the same rate that it is projected to decline between 2018 and 2023. Individual Income Taxes As scheduled under current law Payroll Taxes As scheduled under current law Corporate Income Taxes As scheduled under current law through 2023; remaining constant as a percentage of GDP thereafter Excise Taxes As scheduled under current law Estate and Gift Taxes As scheduled under current law Other Sources of Revenues As scheduled under current law through 2023; remaining constant as a percentage of GDP thereafter Assumptions About Revenues Source: Congressional Budget Office. Notes: The extended baseline generally adheres closely to current law, following CBO’s 10-year baseline budget projections through 2023 and then extending the baseline concept for the rest of the long-term projection period. For CBO’s most recent 10-year baseline projections, see Congressional Budget Office, Updated Budget Projections: Fiscal Years 2013 to 2023 (May 2013), www.cbo.gov/publication/44172. GDP = gross domestic product. a. Assumes the payment of full benefits as calculated under current law, regardless of the amounts available in the program’s trust funds. CBO
  • 14. 10 THE 2013 LONG-TERM BUDGET OUTLOOK SEPTEMBER 2013 Figure 1-1. Federal Debt Held by the Public Under CBO’s Extended Baseline (Percentage of gross domestic product) 120 Actual Projected World War II 80 Great Depression 40 0 1790 World War I Civil War 1806 1822 1838 1854 1870 1886 1902 1918 1934 1950 1966 1982 1998 2014 2030 Source: Congressional Budget Office. For details about the sources of data used for past debt held by the public, see Congressional Budget Office, Historical Data on Federal Debt Held by the Public (July 2010), www.cbo.gov/publication/21728. Notes: The extended baseline generally adheres closely to current law, following CBO’s 10-year baseline budget projections through 2023 and then extending the baseline concept for the rest of the long-term projection period. The long-term projections of debt do not reflect the economic effects of the policies underlying the extended baseline. (For an analysis of those effects and their impact on debt, see Chapter 6.) Data from 1929 onward reflect recent revisions by the Bureau of Economic Analysis to estimates of gross domestic product (GDP) in past years and CBO’s extrapolation of those revisions to projected future GDP . generally stayed the same, federal debt would be quite high in 2038 under a wide range of possible assumptions about key factors that affect budgetary outcomes. (For a discussion of the uncertainty of CBO’s long-term budget projections and budgetary outcomes under alternative assumptions about some of those factors, see Chapter 7.) The Fiscal Gap How much would policies have to change to avoid increasing federal debt further relative to the size of the economy? One answer comes from looking at the fiscal gap, which measures the change in spending or revenues that would be necessary to keep the ratio of debt to GDP the same at the end of a given period as at the beginning of the period. The fiscal gap is conceptually similar to the actuarial balances that are commonly reported for the trust funds for Part A of Medicare and Social Security (see Table 2-2 on page 46 and Table 3-1 on page 53). All three measures quantify a long-term shortfall or surplus in present-value terms—that is, as a single number that describes a flow of future revenues or outlays in terms of an equivalent lump sum received or spent today—and all three can be expressed as a percentage of GDP.4 CBO The Size of Policy Changes to Close the Fiscal Gap. In CBO’s extended baseline, the fiscal gap for 2014 to 2038 amounts to 0.8 percent of GDP. In other words, relative to projections that generally follow current law, a permanent combination of cuts in spending and increases in revenues totaling 0.8 percent of GDP beginning in 2014—about $145 billion in that year—would result in debt that was equal to 73 percent of GDP 25 years from now, the same as the current percentage. If those 4. The fiscal gap equals the present value of revenues over a given period minus the present value of noninterest outlays over that period, adjusted to keep federal debt at its current percentage of GDP. Specifically, current debt is added to the outlay measure, and the present value of the target end-of-period debt (which equals GDP in the last year of the period multiplied by the ratio of debt to GDP at the end of 2013) is added to the revenue measure. The present value of the projected stream of future revenues is computed by taking the revenue estimate for each year, discounting it to 2014 dollars, and summing the resulting estimates. The same method is applied to the projected stream of noninterest outlays. CBO used a discount rate equal to the average real interest rate on federal debt held by the public, which was assumed to be 2.7 percent over the long term, as explained below.
  • 15. CHAPTER ONE THE 2013 LONG-TERM BUDGET OUTLOOK 11 Table 1-2. Projected Spending and Revenues in Selected Years Under CBO’s Extended Baseline (Percentage of gross domestic product) 2013 2023 2038 3.0 1.7 4.9 10.0 ___ 3.3 2.6 5.3 7.6 ___ 4.9 3.2 6.2 7.1 ___ 19.5 18.8 21.3 1.3 ___ 20.8 3.1 ___ 21.8 4.9 ___ 26.2 Revenues 17.0 18.5 19.7 Deficit (-) Excluding net interest Total -2.5 -3.9 -0.3 -3.3 -1.6 -6.4 73 71 100 3.5 4.0 5.8 Spending Noninterest Medicare (Net of offsetting receipts) a Medicaid, CHIP, and exchange subsidies Social Security Other Subtotal Net interest Total Spending Debt Held by the Public at the End of the Year Memorandum: Gross Medicare Spending a Source: Congressional Budget Office. Notes: The extended baseline generally adheres closely to current law, following CBO’s 10-year baseline budget projections through 2023 and then extending the baseline concept for the rest of the long-term projection period. The numbers shown here for 2013 and 2023 differ from those published in Congressional Budget Office, Updated Budget Projections: Fiscal Years 2013 to 2023 (May 2013), www.cbo.gov/publication/44172, because of recent revisions by the Bureau of Economic Analysis to estimates of gross domestic product (GDP) in past years and CBO’s extrapolation of those revisions to projected future GDP . CHIP = Children’s Health Insurance Program. a. Medicare spending net of offsetting receipts reflects premium payments by beneficiaries and certain other receipts used to offset a portion of spending for the Medicare program; gross Medicare spending does not include those offsetting receipts. permanent changes came entirely from revenues or entirely from spending, they would amount to roughly a 4½ percent increase in revenues or a 4½ percent cut in noninterest spending relative to the amounts projected for the 2014–2038 period.5 Increases in revenues or cuts in noninterest spending would have to be larger to reduce debt to percentages of GDP more typical of recent decades. For example, bringing debt back down to 39 percent of GDP in 2038—as it was at the end of 2008—would require a combination of revenue increases and cuts in noninterest spending (relative to current-law projections) totaling 2.0 percent of GDP for the next 25 years. (In 2014, 2.0 percent of 5. Those figures do not reflect the economic effects of the policies underlying the extended baseline. (For analysis of those effects, see Chapter 6.) GDP would be about $350 billion.) If those changes came entirely from revenues, they would represent an increase of 11 percent relative to the amount projected for the 2014–2038 period; if they came entirely from spending, they would represent a cut of 10½ percent in noninterest spending from the amount projected for that period. The Timing of Policy Changes to Close the Fiscal Gap. In deciding how quickly to implement policies to put federal debt on a sustainable path, lawmakers face trade-offs. On the one hand, waiting to reduce federal spending or increase taxes would lead to a greater accumulation of debt and would increase the size of the policy adjustments needed to put the budget on a sustainable course. To illustrate the impact of delay, CBO simulated the effects of closing the fiscal gap beginning in 2015, 2020, or 2025. For example, if lawmakers wanted to keep debt CBO
  • 16. 12 THE 2013 LONG-TERM BUDGET OUTLOOK SEPTEMBER 2013 Figure 1-2. Size of the Reductions in Noninterest Spending or Increases in Revenues Needed to Close the Fiscal Gap Through 2038, Starting in Various Years (Percentage of gross domestic product) 2.0 1.5 1.0 0.5 0 2015 2020 2025 Year Actions Begin Source: Congressional Budget Office. Note: The fiscal gap is a measure of the difference between projected federal noninterest spending and revenues over a given period. It represents the extent to which the government would need to immediately and permanently raise tax revenues or cut spending—or do both, to some degree—to make the government’s debt the same size (relative to gross domestic product) at the end of the period that it is at the end of 2013. at 73 percent of GDP in 2038 but did not begin making policy changes until 2020, the combination of increases in revenues and reductions in spending over that period would have to equal 1.3 percent of GDP, rather than the 0.8 percent needed to close the fiscal gap starting in 2014 (see Figure 1-2). If lawmakers waited until 2025 to take actions to accomplish that objective, the policy changes over the 2025–2038 period would have to amount to 1.9 percent of GDP. Those simulations omit the effects that deficits and debt would have on economic growth and interest rates in the intervening years; incorporating such effects would make the impact of delaying policy changes even larger. On the other hand, implementing spending cuts or tax increases quickly would weaken the current economic expansion and would give people little time to plan and adjust to the policy changes. The negative short-term effects of deficit reduction on output and employment CBO would be especially strong now, because output is so far below its potential (or maximum sustainable) level that the Federal Reserve is keeping short-term interest rates near zero and could not lower them further to offset the impact of changes in fiscal policy. By contrast, reductions in federal spending or increases in taxes a few years from now would have a smaller effect on output and employment because short-term interest rates would probably be well above zero at that time, so the Federal Reserve could adjust those rates in response to changes in fiscal policy. Even if policy changes were not implemented for a few years, however, making decisions about those changes quickly would give people more time to plan and would tend to increase output and employment in the next few years by holding down longer-term interest rates, reducing uncertainty, and enhancing businesses’ and consumers’ confidence. Another trade-off confronting policymakers about the timing of deficit reduction involves the effects on different generations. Reducing deficits sooner would require more sacrifices from older workers and retirees for the benefit of younger workers and future generations. In a previous analysis, CBO assessed the economic impact of waiting a decade to resolve the long-term imbalance in the federal budget.6 CBO compared economic outcomes under a policy that would stabilize the ratio of debt to GDP starting in 2015 with outcomes under a policy that would delay stabilizing that ratio until 2025. The analysis suggested that generations born after about 2015 would be worse off if action to stabilize the debt-to-GDP ratio was postponed from 2015 to 2025. People born before 1990, however, would be better off if action was delayed—largely because they would partly or wholly avoid the policy changes needed to stabilize the debt— and generations born between 1990 and 2015 could either gain or lose from a delay, depending on the details of the policy changes used to keep the debt stable.7 6. Congressional Budget Office, Economic Impacts of Waiting to Resolve the Long-Term Budget Imbalance (December 2010), www.cbo.gov/publication/21959. That analysis was based on slower growth in debt than CBO now projects, so the effects of a similar policy today would not be exactly the same, although they would be qualitatively similar. 7. Those conclusions do not incorporate the possible negative effects stemming from a potential fiscal crisis and from the government’s reduced flexibility to respond to unexpected challenges. Such negative effects, which are discussed in the next section, were not incorporated in that earlier analysis.
  • 17. CHAPTER ONE Consequences of Large and Growing Federal Debt The high and rising amounts of federal debt held by the public that CBO projects for coming decades under the extended baseline would have significant negative consequences for both the economy and the federal budget. Those consequences include reducing the total amounts of national saving and income; increasing the government’s interest payments, thereby putting more pressure on the rest of the budget; limiting lawmakers’ flexibility to respond to unexpected events; and increasing the likelihood of a fiscal crisis. Less National Saving and Future Income Large federal budget deficits over the long term would reduce investment, resulting in lower national income and higher interest rates than would otherwise occur. The reason is that increased government borrowing would cause a larger share of the savings potentially available for investment to be used for purchasing government securities, such as Treasury bonds. Those purchases would “crowd out” investment in capital goods, such as factories and computers, which make workers more productive. Because wages are determined mainly by workers’ productivity, the reduction in investment would also reduce wages, lessening people’s incentive to work. In addition, both private borrowers and the government would have to pay higher interest rates to compete for savings, and those higher rates would strengthen people’s incentive to save. However, the rise in private saving would be a good deal smaller than the increase in federal borrowing represented by the change in the deficit, so national saving would decline, as would private investment. (For a detailed analysis of those economic effects, see Chapter 6.) In the short run, though, large federal budget deficits would tend to boost demand, thus increasing output and employment relative to what they would be with smaller deficits. That is especially the case under conditions like those now prevailing in the United States—with substantial unemployment and underused factories, offices, and equipment—which have led the Federal Reserve to push short-term interest rates down almost to zero. The effects of the higher demand would be temporary because stabilizing forces in the economy tend to move output back toward its potential level. Those forces include the THE 2013 LONG-TERM BUDGET OUTLOOK 13 response of prices and interest rates to higher demand, as well as (in normal times) actions by the Federal Reserve. Pressure for Larger Tax Increases or Spending Cuts in the Future Large amounts of federal debt ordinarily require the government to make large interest payments to its lenders, and growth in the debt causes those interest payments to increase. (Net interest payments are currently fairly small relative to the size of the federal budget because interest rates are exceptionally low, but CBO projects that those payments will increase considerably as rates return to more normal levels.) Higher interest payments would consume a larger portion of federal revenues, resulting in a larger gap between the remaining revenues and the amount that would be spent on federal programs under current law. Hence, if lawmakers wanted to maintain the benefits and services that the government is scheduled to provide under current law, while not allowing deficits to increase as interest payments grew, revenues would have to rise as well. Additional revenues could be raised in many different ways, but to the extent that they were generated by boosting marginal tax rates (the rates on an additional dollar of income), the higher tax rates would discourage people from working and saving, further reducing output and income. Alternatively, lawmakers could choose to offset rising interest costs, at least in part, by reducing benefits and services. Those reductions could be made in many ways, but to the extent that they came from cutting federal investments, future output and income would also be reduced. As another option, lawmakers could respond to higher interest payments by allowing deficits to increase for some time, but that approach would require greater deficit reduction later if lawmakers wanted to avoid a long-term increase in debt relative to GDP. Reduced Ability to Respond to Domestic and International Problems Having a relatively small amount of outstanding debt gives a government the ability to borrow funds to address significant unexpected events, such as recessions, financial crises, and wars. In contrast, having a large amount of debt leaves a government with less flexibility to address financial and economic crises, which in many countries CBO
  • 18. 14 THE 2013 LONG-TERM BUDGET OUTLOOK have been very costly.8 A large amount of debt could also harm a country’s national security by constraining military spending in times of crisis or limiting the country’s ability to prepare for such a crisis. A few years ago, the size of the U.S. federal debt gave the government the flexibility to respond to the financial crisis and severe recession by increasing spending and cutting taxes to stimulate economic activity, providing public funding to stabilize the financial sector, and continuing to pay for other programs even as tax revenues dropped sharply because of the decline in output and income. If federal debt stayed at its current percentage of GDP or grew further, the government would find it more difficult to undertake similar policies in the future. As a result, future recessions and financial crises could have larger negative effects on the economy and on people’s well-being. Moreover, the reduced financial flexibility and increased dependence on foreign investors that would accompany a rise in debt could weaken the United States’ international leadership. Greater Chance of a Fiscal Crisis A large and continually growing federal debt would have another significant negative consequence: It would increase the probability of a fiscal crisis for the United States.9 In such a crisis, investors become unwilling to finance all of a government’s borrowing needs unless they are compensated with very high interest rates; as a result, the interest rates on government debt rise suddenly and sharply relative to rates of return on other assets. That increase in interest rates reduces the market value of outstanding government bonds, causing losses for investors who hold them. Such a decline can precipitate a broader financial crisis by creating losses for mutual funds, 8. See, for example, Carmen M. Reinhart and Kenneth S. Rogoff, “The Aftermath of Financial Crises,” American Economic Review, vol. 99, no. 2 (May 2009), pp. 466–472, http://dx.doi.org/ 10.1257/aer.99.2.466; and Carmen M. Reinhart and Vincent R. Reinhart, “After the Fall,” in Federal Reserve Bank of Kansas City, Macroeconomic Challenges: The Decade Ahead (2011), www.kansascityfed.org/publicat/sympos/2010/Reinhart_final.pdf (1.6 MB). Also see Luc Laeven and Fabian Valencia, Systemic Banking Crises Database: An Update, Working Paper 12-163 (International Monetary Fund, June 2012), www.imf.org/ external/pubs/ft/wp/2012/wp12163.pdf (1 MB). 9. For additional discussion, see Congressional Budget Office, Federal Debt and the Risk of a Fiscal Crisis (July 2010), www.cbo.gov/publication/21625. CBO SEPTEMBER 2013 pension funds, insurance companies, banks, and other holders of government debt—losses that may be large enough to cause some financial institutions to fail. Unfortunately, there is no way to predict with any confidence whether or when such a fiscal crisis might occur in the United States. In particular, there is no identifiable tipping point of debt relative to GDP that indicates that a crisis is likely or imminent. All else being equal, however, the larger a government’s debt, the greater the risk of a fiscal crisis. The likelihood of such a crisis also depends on the economic environment, both domestic and international. If investors expect continued economic growth, they are generally less concerned about debt burdens; conversely, high debt can reinforce more general concern about an economy. In many cases around the world, fiscal crises have begun during recessions and, in turn, have exacerbated them. In some instances, a crisis has been triggered by news that a government would, for any number of reasons, need to borrow an unexpectedly large amount of money. Then, as investors lost confidence and interest rates spiked, borrowing became more difficult and expensive for the government. That development forced policymakers to either cut spending and increase taxes immediately and substantially to reassure investors, or renege on the terms of the country’s existing debt, or increase the supply of money and boost inflation. In some cases, a fiscal crisis also made borrowing more expensive for privatesector borrowers because uncertainty about the government’s response to the crisis reduced confidence in the viability of private-sector enterprises. Higher privatesector interest rates, combined with reductions in government spending and increases in taxes, have tended to worsen economic conditions in the short term. If a fiscal crisis occurred in the United States, policymakers would have only limited—and unattractive— options for responding to it. In particular, the government would need to undertake some combination of three approaches: restructuring its debt (that is, seeking to modify the contractual terms of its existing obligations), pursuing inflationary monetary policy, and adopting an austerity program of spending cuts and tax increases. Thus, such a crisis would confront policymakers with extremely difficult choices and probably have a very significant negative impact on the country.
  • 19. CHAPTER ONE CBO’s Assumptions About Spending and Revenue Policies To produce the long-term projections in this report, CBO makes a series of assumptions about future budgetary policies for major categories of spending and revenues, such as Social Security, major health care programs, other mandatory programs, discretionary programs, and revenue sources. CBO projects spending for Social Security and the government’s major health care programs—Medicare, Medicaid, the Children’s Health Insurance Program, and insurance subsidies that will be provided through the exchanges created under the Affordable Care Act (ACA)—by estimating outlays for the programs under the assumption that there will generally be no changes to current law. (In this report, Medicare outlays are presented net of offsetting receipts, such as premiums paid by enrollees, which reduce net outlays for that program.) For the purposes of these projections, CBO assumes that Social Security and Medicare will always pay benefits as scheduled under current law, regardless of the status of the programs’ trust funds. That assumption is consistent with a statutory requirement that CBO, in its baseline projections, assume that funding is adequate to make all payments required by law for entitlement programs.10 (For more details about the long-term projections for major health care programs and Social Security, see Chapters 2 and 3.) For other mandatory programs—such as retirement programs for federal civilian and military employees, certain veterans’ programs, the Supplemental Nutrition Assistance Program, unemployment compensation, and refundable tax credits—the long-term projections begin with CBO’s baseline projections of outlays through 2023, which include reductions (through 2021) specified in the Budget Control Act. For years after 2023, CBO projects outlays for refundable tax credits as part of its revenue projections and projects spending for the remaining mandatory programs as a whole—by assuming that such 10. Section 257(b)(1) of the Balanced Budget and Emergency Deficit Control Act of 1985; 2 U.S.C. §907(b)(1). The balances of the trust funds represent the total amount that the government is legally authorized to spend on each program. For a discussion of the legal issues related to exhaustion of a trust fund, see Christine Scott, Social Security: What Would Happen If the Trust Funds Ran Out? Report for Congress RL33514 (Congressional Research Service, June 15, 2012), http://go.usa.gov/DW99 (PDF, 346 KB). THE 2013 LONG-TERM BUDGET OUTLOOK 15 spending will decline as a share of GDP after 2023 at the same rate that it is projected to fall between 2018 and 2023—but does not estimate outlays for each program. (For more details, see Chapter 4.) Most discretionary appropriations for the 2013–2021 period are assumed in CBO’s baseline to be constrained by the caps and automatic reductions put in place by the Budget Control Act of 2011. For 2022 and 2023, discretionary funding is assumed to grow at the rate of inflation from the 2021 amount. Funding for certain purposes, such as war-related activities, is not constrained by the Budget Control Act’s caps; through 2023, CBO assumes that such funding will increase each year at the rate of inflation, starting from the current amount. After 2023, discretionary spending is assumed to remain fixed at its 2023 percentage of GDP. (For more details, see Chapter 4.) Revenue projections through 2023 follow the 10-year baseline, which incorporates the assumption that various tax provisions will expire as scheduled, even if they have routinely been extended in the past. After 2023, rules for individual income taxes, payroll taxes, excise taxes, and estate and gift taxes are all assumed to evolve as scheduled under current law. Because of the structure of current tax law, total federal revenues from those sources are estimated to grow faster than GDP over the long run. Revenues from corporate income taxes and other sources (such as receipts from the Federal Reserve System) are assumed to remain constant as a percentage of GDP after 2023. (For more details, see Chapter 5.) CBO’s Projections of Demographic and Economic Trends The long-term budget estimates in this report also depend on projections for a host of demographic and economic variables; the resulting economic outcomes are referred to here as the economic benchmark. Annual projected values for selected demographic and economic variables for the next 75 years are included in the supplemental data for this report that are available on CBO’s website (www.cbo.gov). Demographic Variables The future size and composition of the U.S. population will affect federal tax revenues, federal spending, and the performance of the economy—for example, by influencing the size of the labor force and the number of CBO
  • 20. 16 THE 2013 LONG-TERM BUDGET OUTLOOK beneficiaries of programs such as Medicare and Social Security. Population projections depend on projections of fertility, immigration, and mortality. For fertility rates, CBO adopted the intermediate (midrange) values assumed in the 2012 report of the Social Security trustees.11 For immigration and mortality, CBO produced its own projections, which differ from those of the Social Security trustees. Together, CBO’s long-term assumptions about fertility, mortality, and immigration imply a total U.S. population of 392 million in 2038, compared with 321 million today. CBO also used its own projection of the rate at which people will qualify for Social Security’s Disability Insurance program. Immigration. CBO estimates that there was less immigration in recent years, but will be more in the future, than the Social Security trustees do. In CBO’s view, the recent recession discouraged immigration to the United States in the past few years to a greater extent than the trustees estimate.12 (The total number of immigrants who entered the country in recent years must be estimated because the number of unauthorized immigrants is not known.) In contrast, CBO anticipates more immigration over the coming decades than the trustees do. For its economic benchmark, CBO continues to assume that, in the long run, net immigration will equal 3.2 immigrants per year for every 1,000 members of the U.S. population, the average ratio for much of the past two centuries.13 On that basis, CBO projects that net annual immigration to the United States will amount to 1.2 million people in 11. See Social Security Administration, The 2012 Annual Report of the Board of Trustees of the Federal Old-Age and Survivors Insurance and Federal Disability Insurance Trust Funds (April 2012), www.ssa.gov/OACT/TR/2012/index.html. Detailed data from the trustees’ 2013 annual report were not available in time for CBO to incorporate into this analysis. 12. For more background about immigration to the United States, see Congressional Budget Office, A Description of the Immigrant Population—2013 Update (May 2013), www.cbo.gov/publication/ 44134. 13. That ratio equals the estimated average net flow of immigrants between 1821 and 2002. See Social Security Administration, Technical Panel on Assumptions and Methods, Report to the Social Security Advisory Board (October 2003), p. 28, www.ssab.gov/ Publications/Financing/2003TechnicalPanelRept.pdf (450 KB). That ratio was also the assumption recommended by the 2011 technical panel; see Social Security Administration, Technical Panel on Assumptions and Methods, Report to the Social Security Advisory Board (September 2011), p. 64, www.ssab.gov/Reports/ 2011_TPAM_Final_Report.pdf (6.3 MB). CBO SEPTEMBER 2013 2024 and 1.3 million in 2038—rather than remain close to 1.1 million from 2022 on, as the trustees estimate in their 2013 annual report. The amount of authorized and unauthorized immigration over the long term is subject to a great deal of uncertainty, however. Mortality. CBO has previously used the Social Security trustees’ projections of mortality rates; this year, however, it used its own projections. Demographers have concluded that mortality has improved at a fairly consistent pace in the United States. In the absence of compelling reasons to expect that future trends will differ from those experienced in the past, CBO projects that mortality rates will decline by an average of 1.17 percent a year—as they did, on average, between 1950 and 2008.14 That figure is greater than the 0.80 percent average annual decline projected in the trustees’ 2013 report, but it is less than the assumption of a 1.26 percent average annual decline recommended by the Social Security Administration’s 2011 Technical Panel on Assumptions and Methods. The panel’s recommendation reflects a belief that the decline in mortality will be greater in the future than in the past because of decreases in smoking rates. However, because of uncertainty about the possible effects of many other factors, such as obesity and future medical technology, CBO has based its mortality projections on a simple extrapolation of past trends. Consequently, CBO projects that life expectancy in 2060 will be 84.9 years, substantially higher than the agency’s estimate of current life expectancy, 78.5 years. (For additional information about why CBO changed its approach to projecting mortality, see Box A-1 on page 106.) 14. Mortality rates measure the number of deaths per thousand people in a population. Historically, declines in mortality rates have varied among age groups, but CBO assumes the same average decline for all ages. For further discussion of mortality patterns in the past and methods for projecting mortality, see Social Security Administration, Technical Panel on Assumptions and Methods, Report to the Social Security Advisory Board (September 2011), pp. 55–64, www.ssab.gov/Reports/2011_TPAM_Final_ Report.pdf (6.3 MB). For additional background, see Hilary Waldron, “Literature Review of Long-Term Mortality Projections,” Social Security Bulletin, vol. 66, no. 1 (2005), www.socialsecurity.gov/policy/docs/ssb/v66n1/v66n1p16.html; and John R. Wilmoth, Overview and Discussion of the Social Security Mortality Projections, working paper for the 2003 Technical Panel on Assumptions and Methods (Social Security Advisory Board, May 5, 2005), www.ssab.gov/documents/ mort.projection.ssab.pdf (480 KB).
  • 21. CHAPTER ONE Disability. Unlike in previous years, CBO now anticipates that more workers will enroll in the Disability Insurance program in the future than the Social Security trustees do. CBO projects that, of the people who have worked long enough to qualify for disability benefits but are not yet receiving them, an average of 5.6 per 1,000 will qualify each year (adjusted for changes in the age and sex makeup of the population, relative to its composition in 2000). In the years after the recessions of the early 1990s and early 2000s, the age- and sex-adjusted rate at which people qualified for Disability Insurance declined by about half of the amount that it had risen from its low point before each recession. Assuming the same response after the 2007–2009 recession suggests an annual qualification rate of 5.8 per 1,000, the figure recommended by the 2011 Technical Panel on Assumptions and Methods. The recent recession was unusually severe, however, which suggests that the rate may fall a bit more in the wake of the recession than it did during previous economic recoveries. If it fell two-thirds of the way toward its previous low point, the rate would plateau at 5.6 per 1,000—a figure midway between the 5.8 per 1,000 recommended by the 2011 technical panel and the 5.4 per 1,000 used in the trustees’ 2013 report and in CBO’s long-term projections last year.15 Economic Variables For the 2013–2023 period, CBO’s benchmark projections of economic variables—such as the size of the labor force, interest rates, inflation, and earnings per worker— match those in its February 2013 economic forecast, which underlies the agency’s most recent 10-year budget projections.16 Beyond 2023, the benchmark generally reflects the economic experience of the past few decades. Thus, it does not incorporate the effects that projected changes in the debt-to-GDP ratio and marginal tax rates would have on economic growth and interest rates. Rather, it reflects two specific assumptions about fiscal policy: that debt held by the public will be kept at 15. For more discussion of historical patterns of disability and projection methods, see Social Security Administration, Technical Panel on Assumptions and Methods, Report to the Social Security Advisory Board (September 2011), pp. 74–82, www.ssab.gov/Reports/ 2011_TPAM_Final_Report.pdf (6.3 MB). 16. For more about that economic forecast, see Congressional Budget Office, The Budget and Economic Outlook: Fiscal Years 2013 to 2023 (February 2013), Chapter 2, www.cbo.gov/publication/ 43907. THE 2013 LONG-TERM BUDGET OUTLOOK 17 71 percent of GDP (the percentage at the end of 2023 in CBO’s baseline budget projections) and that effective marginal tax rates on income from work and saving will remain constant at the levels reached in 2023. (For estimates of how projected deficits and marginal tax rates would affect the economy under the extended baseline and some alternative policies, see Chapter 6.) The Labor Market. Important benchmark projections about the labor market include estimates of the growth of the labor force, the average number of hours that people work, the rate of unemployment, and the share of total compensation that people receive in the form of taxable earnings. Those factors affect the amount of tax revenues that the government collects and the amount of federal spending on certain programs, such as Social Security. Growth of the Labor Force. The number of workers will grow more slowly in coming decades than in past years because of the retirement of the large baby-boom generation born between 1946 and 1964, lower birth rates, and a tapering off of increases in women’s participation in the labor market. The labor force expanded at an average rate of 1.6 percent a year during the 1970–2010 period, but CBO projects that it will grow by only about 0.4 percent a year, on average, between 2023 and 2038 and will continue to increase at about that rate in later years. That slowdown in growth is expected to result both from more workers exiting the labor force and from fewer workers entering it. More workers are projected to leave the labor force than in past decades because the older members of the baby-boom generation have begun reaching retirement age (although the average age at which people leave the labor force because of retirement has increased slightly in recent decades). Fewer workers are projected to enter the labor force than in past decades for two reasons. First, birth rates have declined (for example, women had an average of more than three children apiece in the 1950s and 1960s, compared with fewer than two children today). Second, participation by women in the labor force is not projected to increase much, whereas in the past it rose significantly. For instance, over the 1970– 2010 period, the working-age population (people ages 20 to 64) grew by an average of 1.3 percent a year, but the labor force grew faster—by 1.6 percent a year—mainly because of large increases in the participation rate of women (a factor that was only partly offset by a decline in the participation rate of men). CBO expects little change in the participation rates of specific groups after 2023, so CBO
  • 22. 18 THE 2013 LONG-TERM BUDGET OUTLOOK SEPTEMBER 2013 the labor force is projected to grow at the same rate as the working-age population. from more than 7 percent in 2013 to 5.5 percent in 2018 and to 5.3 percent in 2023. Average Hours Worked. Different segments of the population work different numbers of hours, on average; for example, men tend to work more hours than women do, and people between the ages of 30 and 40 tend to work more hours than do people between the ages of 50 and 60. CBO’s projections are based on the view that those differences among groups will remain stable. However, CBO also expects that over the long term, the composition of the labor force will shift toward certain groups (such as older workers) that tend to work less, slightly reducing the average number of hours worked in the labor force as a whole. CBO estimates that by 2038, the average number of hours per worker will be about 1 percent less than in 2023. For years after 2023, CBO assumes an unemployment rate slightly higher than the estimated natural rate (to account for the likelihood that some periods of severe recession will occur over the long term). The natural rate of unemployment is projected to decline to 5.0 percent by 2028 and then remain at that level. However, CBO estimates that since World War II, the unemployment rate has been 0.3 percentage points higher than the natural rate, on average, because of shortfalls in overall demand related to the business cycle. Thus, in the economic benchmark, the average unemployment rate after 2023 is projected to remain at 5.3 percent—0.3 percentage points higher than the natural rate in the long run.19 The Unemployment Rate. In February 2013, CBO projected that the unemployment rate would return to the natural rate of unemployment by 2018 and remain there through 2023. (The natural rate of unemployment is the rate that stems from all sources of unemployment other than fluctuations in overall demand related to the business cycle—for example, from differences between the skills of people who are looking for work and the skills that employers consider necessary to fill vacant positions.) CBO estimates that the natural rate of unemployment rose from 5.0 percent before the recent recession to about 6.0 percent in 2013 because of mismatches between the skills and locations of available unemployed workers and the needs of employers, the availability of extended unemployment insurance benefits, and the difficulties that the long-term unemployed have in finding work.17 Those effects are expected to diminish gradually over the next 10 years as, for example, people acquire new skills or relocate. In addition, the effect of extended unemployment benefits is expected to dissipate quickly because those benefits are scheduled to expire at the end of this calendar year. However, the difficulties faced by the long-term unemployed are likely to be more persistent because of the stigma associated with being out of work for a long period and the resulting erosion of people’s skills.18 All told, in its 10-year baseline, CBO projects that the actual unemployment rate will decline 17. See Congressional Budget Office, The Budget and Economic Outlook: Fiscal Years 2013 to 2023 (February 2013), pp. 44–46, www.cbo.gov/publication/43907. CBO Taxable Earnings as a Share of Compensation. Workers’ total compensation consists of taxable earnings and nontaxable benefits, such as paid leave and employers’ contributions for health insurance and pensions. The share of total compensation paid in the form of taxable earnings has slipped over the years—from about 90 percent in 1960 to 80 percent in 2012—mainly because the cost of health insurance has grown more quickly than total compensation over the past several decades.20 Looking ahead, CBO expects that health care costs will continue to rise more rapidly than taxable earnings, a trend that by itself would further decrease the proportion of compensation that workers receive as taxable earnings. However, the Affordable Care Act imposed an excise tax on some employment-based health insurance plans that have premiums above a specified threshold. Some employers and workers will respond to that tax—which is scheduled to take effect in 2018—by shifting to less expensive plans, thereby reducing the share of compensation composed of health insurance premiums and increasing the share composed of taxable earnings. CBO projects that the effects of the excise tax on the mix of compensation will roughly offset the effects of rising costs 18. See Congressional Budget Office, Understanding and Responding to Persistently High Unemployment (February 2012), www.cbo.gov/ publication/42989. 19. In last year’s report on the long-term outlook, the unemployment rate was projected to equal the natural rate of 5.0 percent in the long run. 20. For more details, see Congressional Budget Office, How CBO Projects Income (July 2013), www.cbo.gov/publication/44433.
  • 23. CHAPTER ONE for health care for a few decades; thereafter, the impact of rising health care costs will outweigh the impact of the tax.21 As a result, in CBO’s benchmark, the share of compensation that workers receive as taxable earnings is projected to remain close to 81 percent until around 2050 and then decline gradually, reaching 78 percent by 2088. (For more about the projected effects of the excise tax, see Chapter 5; for a discussion of trends in the costs of health care, see Chapter 2.) Interest Rates. CBO’s economic benchmark includes projections of various interest rates, such as the rate on 10-year Treasury notes, the average interest rate on federal debt held by the public, and the average interest rate on holdings of the Social Security and Medicare trust funds. For the long run, CBO projects a real (inflationadjusted) interest rate on 10-year Treasury notes of 3.0 percent, which is near the average of the past six decades and slightly higher than the rate that CBO projected for 2023 in its February 2013 baseline.22 In the benchmark projections for interest rates, CBO takes into account both the assumed size of federal debt relative to GDP (which, at 71 percent, would be well above the percentages in recent decades) and the projected growth rate of the labor force (which CBO estimates will be slower than in recent decades). Those two factors affect projected interest rates in opposite ways:  Increases in government debt tend to raise interest rates by causing a larger portion of total savings to be devoted to buying government securities, thus reducing the savings available to finance private investment. Therefore, a larger federal debt than in the past several decades would imply higher interest rates than those seen during that period.  The projected slowdown in the growth of the labor force would increase the ratio of the capital stock (the 21. CBO projects that the effects of the excise tax on the taxable share of compensation will diminish over time both because CBO expects that most people will want to have a significant amount of health insurance and because the ACA set minimum levels of coverage for health insurance plans. Therefore, the number of people moving to less expensive insurance plans will eventually dwindle. 22. The real interest rates presented in this report were adjusted for inflation as measured by the increase in the consumer price index. For the comparison with historical real rates, past values of the consumer price index were adjusted to account for changes over time in the way in which that index measures inflation. THE 2013 LONG-TERM BUDGET OUTLOOK 19 total amount of capital goods) to the supply of labor. Having more capital goods per worker would reduce the amount by which additional capital goods would raise production—that is, it would lower the productivity of incremental units of capital. That lower productivity would mean that investments in capital would generate a smaller return, pushing interest rates lower.23 The effects that those and other factors (such as projected depreciation rates) would have on the interest rate on 10-year Treasury notes would roughly offset each other, CBO estimates.24 In CBO’s benchmark, the real interest rate on federal debt held by the public is projected to average 2.7 percent over the long term. That rate is slightly lower than the benchmark rate on 10-year Treasury notes (3.0 percent) because CBO anticipates that interest rates will be lower on short-term debt than on long-term debt, as is typically the case, and the average maturity of federal debt is expected to be less than 10 years. In general, CBO also used that 2.7 percent value as a discount rate for calculating the present value of future streams of total federal revenues and outlays. (The higher the discount rate, the lower the present value of the future flows.) The Social Security and Medicare trust funds hold special-issue bonds that generally earn interest rates that are higher than the average real interest rate on federal debt. Therefore, in projecting the balances in the trust funds and calculating the present value of future streams of revenues and outlays for those funds, CBO used a 3.0 percent discount rate. Inflation. The economic benchmark includes projections of the prices of various categories of goods and services. 23. See Congressional Budget Office, How Slower Growth in the Labor Force Could Affect the Return on Capital (October 2009), www.cbo.gov/publication/41325. 24. Depreciation rates are the rates at which investment goods lose value because of obsolescence, wear, or destruction. In last year’s report on the long-term outlook, the benchmark assumption for the long-term ratio of debt to GDP was 61 percent, which was the figure projected to be reached at the end of the 10-year baseline period at that time. The increase to 71 percent in this report would, by itself, have increased the long-term projection for interest rates. However, because CBO also increased its estimate of the effect of slower labor force growth on interest rates, the impact of higher debt was largely offset. CBO
  • 24. 20 THE 2013 LONG-TERM BUDGET OUTLOOK For that benchmark, CBO projects that the rate of inflation for consumer goods and services—as measured by the annual rate of change in both the consumer price index for urban wage earners and clerical workers and the consumer price index for all urban consumers—will be 2.5 percent in the long run. That rate is the same one that CBO used for its long-term projections last year and a little above the rate that CBO projected for 2023 in its February 2013 baseline. CBO anticipates that prices will rise at roughly the same pace for most goods and services over the long term. An important exception is the prices of capital goods (things, such as equipment and machinery, that are used to produce other goods and services). Over the past several decades, prices for capital goods—especially for computer equipment—have increased more slowly, on average, than the various consumer price indexes. CBO’s economic benchmark thus incorporates the view that, over the long term, the prices of capital goods, particularly computers, will continue to rise more slowly than the prices of consumer goods and services. The annual inflation rate for all final goods and services produced by the economy, as measured by the rate of increase in the GDP deflator, is projected to average 0.3 percentage points less than the increase in the consumer price indexes over the long term—about the same differential that CBO projects for 2023.25 The GDP deflator grows more slowly than the consumer price indexes for two reasons: because it fully accounts for consumers’ ability to shift their mix of purchases as some prices change relative to other prices, and because the items on whose prices the GDP deflator is based include a greater proportion of things (such as computers) whose prices are projected to increase more slowly than those of most other goods and services. Growth of Earnings per Worker and Real GDP. In its economic benchmark, CBO projects that over the 2023– 2038 period, real earnings per worker will grow at an average annual rate of 1.2 percent and real GDP will grow at an average annual rate of 2.0 percent. For the longer period from 2023 to 2088, the corresponding figures are 1.4 percent and 2.2 percent, respectively.26 Those growth rates are derived from the demographic 25. Final goods and services consist of consumer goods and investment goods purchased by businesses. CBO SEPTEMBER 2013 and economic variables described above and from projections of the growth of the capital stock and productivity. The projected growth of the capital stock depends on assumptions about such key elements as federal fiscal policy, private saving (saving by households and businesses), flows of capital to and from other countries, and the rate of increase in the prices of capital goods. Besides assuming for the benchmark that debt held by the public remains at 71 percent of GDP after 2023, CBO assumes that private saving and flows of capital from other countries change by enough to result in a constant rate of return on investments in capital goods and thus steady interest rates. Total factor productivity (real output per unit of combined labor and capital services), which also affects real earnings per worker, is assumed to grow at an annual rate of 1.3 percent over the long term. That assumption, together with the growth projected for the labor supply and the capital stock, leads CBO to project average growth in labor productivity (real output per hour worked) of 1.7 percent a year. Trends in prices, in the growth of nonwage compensation (such as employerprovided health insurance), and in average hours worked imply that average growth in real earnings per worker— 1.4 percent—will be a bit slower than average growth in labor productivity. Because the unemployment rate is projected to be 0.3 percentage points higher than the natural rate of unemployment in the long run, the level of GDP is projected to be 0.6 percent lower, on average, than it would be if unemployment were at the natural rate. That relationship between unemployment and output is consistent with past experience. CBO’s projection of the long-term growth rate of real GDP—2.2 percent a year, on average, over the 2023– 2088 period—is substantially slower than the rate of economic growth seen in the past few decades, primarily because of the slowdown that CBO anticipates in the growth of the labor force. Real GDP per person is 26. The differences in average growth rates between the 2023–2038 and 2023–2088 periods stem primarily from the transition that occurs during the first several years after 2023 from the economic conditions at the end of CBO’s 10-year baseline projections to the economic conditions that CBO expects will exist in the longer term.
  • 25. CHAPTER ONE projected to increase at an average annual rate of 1.3 percent between 2023 and 2038 and 1.6 percent between 2023 and 2088, compared with 2.1 percent during the 40 years before the start of the 2007–2009 recession.27 The projected long-term average growth rate of real output (2.2 percent) is less than the projected long-term average real interest rate on federal debt held by the public (2.7 percent). That difference would mark a change from the experience of the past few decades, when interest rates on federal debt were, on average, roughly equal to the growth rate of output. Thus, for any given budget policies, federal debt is projected to climb faster relative to output than it would if the difference were closer to its historical average. Alternative Economic Assumptions. CBO varied some of its economic assumptions to illustrate the uncertainty of long-term budget projections. In particular, the agency examined how using different assumptions about the long-term growth of total factor productivity, interest rates on federal debt, and the growth of federal spending on health care would affect budget projections. That analysis incorporated the economic effects of fiscal policy, which result in higher projected debt than an analysis that does not account for such effects. As an example of the impact of alternative assumptions, if productivity was assumed to grow during the next 25 years at a rate 0.5 percentage points higher or lower than the rate underlying CBO’s projections, and if all other assumptions were the same as those underlying the extended baseline, projected debt would be as high as 156 percent of GDP in 2038 or as low as 65 percent (which would still be high by historical standards). If the annual growth of federal spending on health care during the next 25 years was projected to differ by 0.5 percentage points from the rate underlying CBO’s projections, and all other assumptions were kept the same, projected debt in 2038 would range from 123 percent of GDP to 94 percent. (For more details, see Chapter 7.) By comparison, with economic effects included and all other assumptions the same as in the extended baseline, debt would reach 108 percent of GDP in 2038. 27. As noted above, the differences in average growth rates between the 2023–2038 and 2023–2088 periods stem primarily from the transition that occurs during the first several years after 2023 from the economic conditions at the end of CBO’s 10-year baseline projections to the economic conditions that CBO expects will exist in the longer term. THE 2013 LONG-TERM BUDGET OUTLOOK 21 Projected Spending Through 2038 Federal outlays other than those for the government’s net interest costs have averaged 18 percent of GDP over the past 40 years. Noninterest spending has been unusually high in the past few years because of the recent financial crisis and recession and the policies implemented in response to them (as well as underlying growth in the costs of Social Security and major health care programs). Noninterest spending spiked to 23 percent of GDP in 2009 and then declined, falling to about 19 percent this year. CBO projects that, if current laws affecting spending were unchanged, noninterest outlays would continue to decrease gradually relative to GDP until 2018, when they would equal their historical average of 18 percent. Thereafter, however, under the assumptions of the extended baseline, noninterest spending would rise, reaching 21 percent of GDP by 2038 and remaining on an upward path. (Differences between those long-term projections and the ones that CBO published last year are discussed briefly at the end of this chapter and in more detail in Appendix A.) Under current law, spending for net interest would jump from 1.3 percent of GDP this year to more than 3 percent 10 years from now. By 2038, interest costs would reach nearly 5 percent of GDP, bringing total federal spending to 26 percent of GDP (see Figure 1-3). Federal spending has been a greater percentage of GDP only three times in U.S. history—for three years during World War II, when it topped 40 percent of GDP. Outlays for Major Health Care Programs and Social Security Mandatory programs have accounted for a sharply rising share of the federal government’s noninterest spending in the past few decades; that share has averaged 60 percent in recent years. Most of the growth in mandatory spending has involved the three largest programs—Social Security, Medicare, and Medicaid. Federal outlays for those three programs together made up more than 40 percent of the government’s noninterest spending, on average, during the past 10 years, compared with a quarter in 1973. Most of the projected growth in noninterest spending as a share of GDP over the long term is expected to come from the government’s major health care programs: Medicare, Medicaid, the Children’s Health Insurance Program, and subsidies to help people purchase health CBO
  • 26. 22 THE 2013 LONG-TERM BUDGET OUTLOOK SEPTEMBER 2013 Figure 1-3. Spending and Revenues Under CBO’s Extended Baseline, Compared With Past Averages (Percentage of gross domestic product) Average, 1973–2012 2013 2038 Other Noninterest Spending Major Health Care Programs Social Security 4.2 11.2 2.7 4.9 10.0 4.6 6.2 8.0 Total Outlays 7.1 Total Revenues 2.2 1.3 4.9 Deficit Average, 1973–2012 20.4 17.4 2013 20.8 17.0 2038 Net Interest 26.2 -3.0 -3.9 19.7 -6.4 Source: Congressional Budget Office. Notes: The extended baseline generally adheres closely to current law, following CBO’s 10-year baseline budget projections through 2023 and then extending the baseline concept for the rest of the long-term projection period. These numbers reflect recent revisions by the Bureau of Economic Analysis to estimates of gross domestic product (GDP) in past years and CBO’s extrapolation of those revisions to projected future GDP . Major health care programs consist of Medicare, Medicaid, the Children’s Health Insurance Program, and subsidies offered through new health insurance exchanges. (Medicare spending is net of offsetting receipts.) Other noninterest spending is all federal spending other than that for major health care programs, Social Security, and net interest. insurance through the exchanges created under the Affordable Care Act. Under current law, total outlays for those health care programs, net of offsetting receipts, would grow much faster than the economy, increasing from almost 5 percent of GDP now to 8 percent in 2038 (see Chapter 2). Spending for Social Security would also increase relative to the size of the economy, but by much less—from almost 5 percent of GDP in 2013 to more than 6 percent in the 2030s and beyond (see Chapter 3). Those projected increases in spending stem from three factors: the aging of the population; rising health care spending per beneficiary; and changes related to the ACA, specifically the introduction of exchange subsidies and the expansion of Medicaid in many states. (Box 1-1 on page 24 provides a quantitative breakdown of the roles that those three factors play in CBO’s spending projections for major health care programs and Social Security.) Aging of the Population. The aging of the baby-boom generation portends a long-lasting shift in the age profile of the U.S. population. That shift will substantially alter CBO the balance between the working-age and retirement-age segments of the population. During the next decade alone, the number of people over the age of 65 is expected to rise by more than a third. Over the longer term, the share of the population age 65 or older is projected to grow from about 14 percent now to 21 percent in 2038, whereas the share of the population ages 20 to 64 is expected to fall from 60 percent to 55 percent. Those trends are expected to continue in later decades, though at a slower pace, as life expectancy increases further. The change in the age profile of the population will be even greater among the oldest segment: CBO projects that the share of the population age 80 or older will rise from 4 percent today to 7 percent in 2038. That increase is especially important for government spending because per capita outlays on federal health care programs rise with age. The aging of the population is the main factor driving the projected growth of Social Security spending as a percentage of GDP. Initial Social Security benefits are based on a person’s earnings, which are indexed to the overall growth
  • 27. CHAPTER ONE of wages in the economy. As a result, average benefits increase at approximately the same rate as average earnings, so economic growth does not significantly alter spending for Social Security as a share of GDP. Rather, that share depends primarily on the ratio of the number of people of working age to the number of Social Security beneficiaries. CBO projects that the number of people of working age per beneficiary will decline significantly over the next quarter century—from about three now to about two in 2038—and then continue to drift downward. Rising Health Care Spending per Beneficiary. Although the growth of health care spending has slowed recently, CBO projects that spending per enrollee in federal health care programs will continue to increase at a faster pace than per capita GDP. However, the difference between those two growth rates will be smaller than its average of recent decades, CBO projects. The reason is that even if federal laws do not change, continuing increases in health care spending will create mounting pressure for state governments and the private sector to slow the growth of such spending, and their responses to that pressure will affect federal spending as well. For instance, as states move to limit their costs for Medicaid (a program in which the federal government matches a certain percentage of states’ spending), the growth of per capita federal spending on those programs is expected to slow. Similarly, efforts to limit increases in the cost of private health insurance are expected to slow the rise of subsidies provided through the insurance exchanges. Growth in Medicare spending per beneficiary is also projected to slow even without legislative action (though to a lesser degree than for the other major health care programs) because the Centers for Medicare & Medicaid Services (CMS) is likely, over time, to implement costsaving changes to the Medicare program and because of changes that will occur in the health care system as a whole. For example, CMS has the authority to expand demonstration projects that prove capable of slowing the rise of Medicare spending without reducing the quality of care. In addition, Medicare may benefit from the spillover effects of private-sector initiatives to improve the efficiency of the health care system. Effects of the Insurance Coverage Provisions of the Affordable Care Act. The ACA will result in new federal spending on subsidies for private health insurance and greater federal spending on Medicaid.28 Beginning in calendar year 2014, individuals will be able to purchase THE 2013 LONG-TERM BUDGET OUTLOOK 23 private health insurance through exchanges established by the ACA. The federal government will subsidize the cost of those purchases for some people with income between 100 percent and 400 percent of the federal poverty guidelines. The subsidies will limit the percentage of income that eligible people have to pay to buy a relatively lowcost insurance plan that provides a specified level of benefits; people who choose more expensive plans will have to pay higher amounts. In addition, as a result of the ACA and a subsequent Supreme Court ruling, each state will have the option to expand eligibility for Medicaid beginning in calendar year 2014 to include all nonelderly adults with income below 138 percent of the federal poverty guidelines. Other Noninterest Outlays CBO projects that, under the assumptions used for this analysis, total federal spending for everything besides the major health care programs, Social Security, and net interest would decline to smaller percentages of GDP than have been seen for more than 70 years. Such spending, which currently equals about 10 percent of GDP, has made up more than 8 percent of GDP each year since the late 1930s. In the extended baseline, it is projected to fall below 8 percent of GDP in 2020 and then continue to decline slowly, dropping to about 7 percent of GDP in 2038 (see Chapter 4 for details). Spending for discretionary programs is projected to decline significantly over the next 10 years—from 7½ percent of GDP to 5½ percent—because the constraints on discretionary spending imposed by the Budget Control Act are scheduled to limit the growth of such spending to a rate well below that of GDP. For its longterm projections, CBO assumed that discretionary outlays would remain at 5½ percent of GDP after 2023. Spending for mandatory programs other than health care programs and Social Security is also projected to decline during the next 10 years. Such “other mandatory spending” is unusually high now—about 3 percent of GDP— 28. The ACA included many other provisions that will affect federal revenues and federal spending for Medicare and other programs. Taking the coverage provisions and the other provisions together, CBO and the staff of the Joint Committee on Taxation have estimated that the ACA will reduce deficits over the next 10 years and in the subsequent decade; see Congressional Budget Office, letter to the Honorable John Boehner providing an estimate for H.R. 6079, the Repeal of Obamacare Act (July 24, 2012), www.cbo.gov/publication/43471. CBO