SlideShare una empresa de Scribd logo
1 de 4
Descargar para leer sin conexión
Study Status – Freight & Commodity Analysis
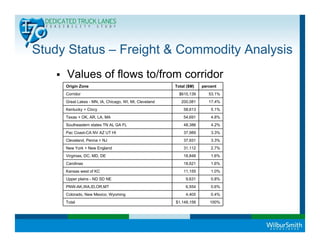
     Values of flows to/from corridor
     Origin Zone                                        Total ($M)   percent
     Corridor                                             $610,139      53.1%
     Great Lakes - MN, IA, Chicago, WI, MI, Cleveland      200,081      17.4%
     Kentucky + Cincy                                       58,613       5.1%
     Texas + OK, AR, LA, MA                                 54,691       4.8%
     Southeastern states TN AL GA FL                        48,386       4.2%
     Pac Coast-CA NV AZ UT HI                               37,989       3.3%
     Cleveland, Penna + NJ                                  37,931       3.3%
     New York + New England                                 31,112       2.7%
     Virginias, DC, MD, DE                                  18,848       1.6%
     Carolinas                                              18,621       1.6%
     Kansas west of KC                                      11,155       1.0%
     Upper plains - ND SD NE                                 9,631       0.8%
     PNW-AK,WA,ID,OR,MT                                      6,554       0.6%
     Colorado, New Mexico, Wyoming                           4,405       0.4%
     Total                                              $1,148,156      100%
Study Status – Freight & Commodity Analysis
   Highest Value Commodities from Corridor
                                                           Commodity
                     Destination Zone                        Group           Value ($M)
     Corridor                                           Machinery                $59,319.6
     Great Lakes - MN, IA, Chicago, WI, MI, Cleveland   Machinery                 39,643.8
     Texas + OK, AR, LA, MA                             Motorized vehicles        14,645.6
     Virginias, DC, MD, DE                              Coal-n.e.c.               10,309.1
     Kentucky + Cincy                                   Motorized vehicles        10,047.5
     Southeastern states TN AL GA FL                    Machinery                  9,556.0
     Pac Coast-CA NV AZ UT HI                           Motorized vehicles         6,361.1
     New York + New England                             Motorized vehicles         5,561.9
     Carolinas                                          Motorized vehicles         4,860.3
     Penna + NJ                                         Motorized vehicles         3,882.0
     Upper plains - ND SD NE                            Coal-n.e.c.                3,504.0
     PNW-AK,WA,ID,OR,MT                                 Motorized vehicles         2,076.8
     Kansas west of KC                                  Mixed freight              1,792.3
     Colorado, New Mexico, Wyoming                      Motorized vehicles         1,335.8
Study Status – Freight & Commodity Analysis
Flows to/from Indianapolis Area
              Great Lakes         $ 17,418
                  $ 10,601


                                                     $7,672    Corridor
Pacific                                                 $9,082 East
Coast                                                                 $6,064
$4,070
$3,961                                                                   $4,414


             Corridor West                                          $5,834
                                                  Rural           $5,596
               $9,473                             IN            Kentucky &
                                                                Cincinnati
               $3,940


                                                                $5,693 South
          South $6,413       $3,180                                    East
                                                          $5,934
          Central
                               Millions of Dollars (2002)

Más contenido relacionado

Similar a I-70 Dedicated Truck Lanes

Prosperity Scorecard for Thunder Bay, Ontario
Prosperity Scorecard for Thunder Bay, OntarioProsperity Scorecard for Thunder Bay, Ontario
Prosperity Scorecard for Thunder Bay, Ontariompian
 
Stimulus Funds
Stimulus FundsStimulus Funds
Stimulus Fundsefordag
 
The US Housing Market - Housing Supply & Demand
The US Housing Market - Housing Supply & DemandThe US Housing Market - Housing Supply & Demand
The US Housing Market - Housing Supply & DemandAltos Research
 
The Ports-to-Plains Alliance: An Overview
The Ports-to-Plains Alliance: An OverviewThe Ports-to-Plains Alliance: An Overview
The Ports-to-Plains Alliance: An OverviewPorts-To-Plains Blog
 
Metro Monthly Payments 2005 vs 2010
Metro Monthly Payments 2005 vs 2010Metro Monthly Payments 2005 vs 2010
Metro Monthly Payments 2005 vs 2010NAR Research
 
Metro Area Monthly Mortgage Payments: 2005 vs 2010
Metro Area Monthly Mortgage Payments: 2005 vs 2010Metro Area Monthly Mortgage Payments: 2005 vs 2010
Metro Area Monthly Mortgage Payments: 2005 vs 2010NAR Research
 

Similar a I-70 Dedicated Truck Lanes (8)

Ports-to-Plains Alliance Update
Ports-to-Plains Alliance UpdatePorts-to-Plains Alliance Update
Ports-to-Plains Alliance Update
 
Prosperity Scorecard for Thunder Bay, Ontario
Prosperity Scorecard for Thunder Bay, OntarioProsperity Scorecard for Thunder Bay, Ontario
Prosperity Scorecard for Thunder Bay, Ontario
 
Stimulus Funds
Stimulus FundsStimulus Funds
Stimulus Funds
 
The US Housing Market - Housing Supply & Demand
The US Housing Market - Housing Supply & DemandThe US Housing Market - Housing Supply & Demand
The US Housing Market - Housing Supply & Demand
 
The Ports-to-Plains Alliance: An Overview
The Ports-to-Plains Alliance: An OverviewThe Ports-to-Plains Alliance: An Overview
The Ports-to-Plains Alliance: An Overview
 
Metro Monthly Payments 2005 vs 2010
Metro Monthly Payments 2005 vs 2010Metro Monthly Payments 2005 vs 2010
Metro Monthly Payments 2005 vs 2010
 
Metro Area Monthly Mortgage Payments: 2005 vs 2010
Metro Area Monthly Mortgage Payments: 2005 vs 2010Metro Area Monthly Mortgage Payments: 2005 vs 2010
Metro Area Monthly Mortgage Payments: 2005 vs 2010
 
D8 housing and econ dev david adame - cplc
D8 housing and econ dev   david adame - cplcD8 housing and econ dev   david adame - cplc
D8 housing and econ dev david adame - cplc
 

I-70 Dedicated Truck Lanes

  • 1. Study Status – Freight & Commodity Analysis Values of flows to/from corridor Origin Zone Total ($M) percent Corridor $610,139 53.1% Great Lakes - MN, IA, Chicago, WI, MI, Cleveland 200,081 17.4% Kentucky + Cincy 58,613 5.1% Texas + OK, AR, LA, MA 54,691 4.8% Southeastern states TN AL GA FL 48,386 4.2% Pac Coast-CA NV AZ UT HI 37,989 3.3% Cleveland, Penna + NJ 37,931 3.3% New York + New England 31,112 2.7% Virginias, DC, MD, DE 18,848 1.6% Carolinas 18,621 1.6% Kansas west of KC 11,155 1.0% Upper plains - ND SD NE 9,631 0.8% PNW-AK,WA,ID,OR,MT 6,554 0.6% Colorado, New Mexico, Wyoming 4,405 0.4% Total $1,148,156 100%
  • 2. Study Status – Freight & Commodity Analysis Highest Value Commodities from Corridor Commodity Destination Zone Group Value ($M) Corridor Machinery $59,319.6 Great Lakes - MN, IA, Chicago, WI, MI, Cleveland Machinery 39,643.8 Texas + OK, AR, LA, MA Motorized vehicles 14,645.6 Virginias, DC, MD, DE Coal-n.e.c. 10,309.1 Kentucky + Cincy Motorized vehicles 10,047.5 Southeastern states TN AL GA FL Machinery 9,556.0 Pac Coast-CA NV AZ UT HI Motorized vehicles 6,361.1 New York + New England Motorized vehicles 5,561.9 Carolinas Motorized vehicles 4,860.3 Penna + NJ Motorized vehicles 3,882.0 Upper plains - ND SD NE Coal-n.e.c. 3,504.0 PNW-AK,WA,ID,OR,MT Motorized vehicles 2,076.8 Kansas west of KC Mixed freight 1,792.3 Colorado, New Mexico, Wyoming Motorized vehicles 1,335.8
  • 3. Study Status – Freight & Commodity Analysis
  • 4. Flows to/from Indianapolis Area Great Lakes $ 17,418 $ 10,601 $7,672 Corridor Pacific $9,082 East Coast $6,064 $4,070 $3,961 $4,414 Corridor West $5,834 Rural $5,596 $9,473 IN Kentucky & Cincinnati $3,940 $5,693 South South $6,413 $3,180 East $5,934 Central Millions of Dollars (2002)