

Recomendados
Recomendados
Más contenido relacionado
La actualidad más candente
La actualidad más candente (19)
Destacado
Destacado (20)
Similar a Pakistan Radio Industry Report 2011
Similar a Pakistan Radio Industry Report 2011 (20)
Más de Ejaz Asi
Más de Ejaz Asi (9)
Último
Último (20)
Pakistan Radio Industry Report 2011
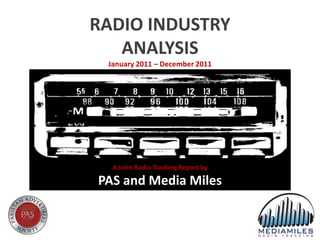
- 1. RADIO INDUSTRY ANALYSIS January 2011 – December 2011 A Joint Radio Tracking Report by PAS and Media Miles
- 2. Credits DATA & ANALYSIS BY: MEDIA MILES ABOUT THE COMPANY Media Miles monitors radio across 3 metros and is the only source of radio airplay information in Pakistan. Using state of the art audio fingerprint technology, radio content is identified and reported in real time. It started its operations in 2007 with coverage of 6 FM stations in Lahore, and expanded to Karachi and Islamabad covering 25 channels in 2010. For query on DATA, contact Mr. Mustafa Farooqi, Media Miles at: mustafa.farooqi@mediamiles.biz For other queries, contact PAS at: secretariat@pas.org.pk
- 3. SLIDE Report Summary 4 Period: Jan – Dec 2011 Total Advertising Minutes 5 Total minutes of advertising in 2011 vs. 2010 Industry Monthly Trend 6 Total minutes of advertising per month across 3 cities Advertising Share by City 7 City Break-up in Minutes Industry Toppers 8 - 12 Categories / Players / Brands Advertising Share by Channels 13 - 14 Channel Break-up Minutes & Ad Spend Ad Occurrence 15 - 16 Day and Day-Part Wise Brand Clutter 17 Nos. of Brands Advertised – 2011 vs. 2010 Avg. Nos. of Ads / Day 18 City Split CONTENT
- 4. Report Summary In terms of minutes, advertising on Radio saw a single digit an increase of 4% from 2010. The month of July saw a significant increase, which may be due to the Ramazan factor. Karachi has seen a major drop from 64% to 47% in its share of advertising in minutes. Contrary Islamabad saw a sharp increase from 6% to 24%. This year Pepsi has made in to Top 10 players and brand that were prominent on Radio. Advertising across days is fairly constant with no particular day taking precedence over the others. In terms of day-parts, it is seen that morning, evening drive-time and late evening have been preferred slots of advertisers.
- 5. TOTAL ADVERTISING MINUTES 2011 vs. 2010 435,000 434,993 430,000 425,000 420,000 418,893 415,000 410,000 2011 2010 2011 saw an increase of almost 4% from last year in volume i.e. number of minutes.
- 6. INDUSTRY MONTHLY TREND BASED ON NUMBER OF MINUTES ACROSS 3 CITIES 2011 vs. 2010 55,000 50,000 45,000 40,000 35,000 30,000 25,000 20,000 January February March April May June July August September October November December 2011 29,154 41,181 38,606 37,556 43,291 38,341 49,325 44,744 28,050 33,137 28,653 22,955 2010 30,396 31,345 43,268 41,689 39,615 40,486 34,924 37,869 23,922 35,651 30,107 29,623 Average Minutes / Month in 2011: 36,249 Approx. 4% increase from 2010
- 7. ADVERTISING SHARE BY CITY % Share of Total Minutes 3 STATIONS 2011 2010 70% 64% 60% 47% 50% 40% 30% 31% 30% 24% 20% 6% 10% 0% Karachi Lahore Islamabad Share of minutes in % for Islamabad has grown approx. 290% from last year. However, for Karachi the share has declined more than half.
- 8. INDUSTRY TOP 10 CATEGORIES BASED ON NUMBER OF MINUTES (MINS in %) No. CATEGORIES 2011 2010 1 Telecom 19.1% 23.2% 2 Beverages 8.8% 6.1% 3 Financial Institutions 7.0% 5.6% 4 Cell Phones 4.7% 3.4% 5 Milk 4.0% 2.9% 6 Ice Cream 3.8% 3.4% 7 Petroleum 3.7% 4.1% 8 Cosmetics 3.6% 2.8% 9 Laundry Detergent 3.54% 3.1% 10 Food 3.52% 3.3% Cosmetics category has made in top 10 in 2011, replacing the Tea category this year.
- 9. INDUSTRY TOP 10 PLAYERS BASED ON NUMBER OF MINUTES (MINS in %) No. CORPORATIONS 2011 2010 1 Unilever Pakistan 11.2% 12.0% 2 Ufone GSM 6.9% 3.3% 3 Nestle Pakistan Limited 5.3% 3.3% 4 Mobilink 4.3% 2.9% 5 Telenor 3.9% 9.3% 6 China Mobile 3.7% 5.2% 7 Pepsi 3.3% 1.2% 8 UBL 3.0% 1.4% 9 Nokia 2.9% 3.2% 10 Engro Foods 2.6% 3.3% Pepsi and UBL were not in Top 10 in 2010. They climbed up this year replacing P&G and Caltex Oil.
- 10. INDUSTRY TOP 10 PLAYERS BASED ON NUMBER OF FREQUENCY Occurrence % No. CORPORATIONS 2011 2010 1 Unilever Pakistan 13% 13% 2 Nestle Pakistan 5% 3% 3 Ufone GSM 5% 2% 4 United Bank Limited 3% 1% 5 Nokia 3% 3% 6 Mobilink 2% 2% 7 Telenor Pakistan 2% 7% 8 Coca Cola 2% 2% 9 Service Sales Corporation 2% 1% 10 Pepsi 2% 1% UBL, Coca Cola and Pepsi replaced China Mobile, Engro Foods and Caltex Oil making in Top 10 in 2011.
- 11. INDUSTRY TOP 10 BRANDS BASED ON NUMBER OF MINUTES (MINS in %) No. BRANDS 2011 2010 1 Ufone GSM 6.86% 2.69% 2 Zong 3.46% 5.18% 3 Jazz 3.32% 2.20% 4 Pepsi 2.58% 0.57% 5 Nestle Cerelac 1.68% 1.62% 6 McDonalds 1.45% 0.75% 7 UBL Omni 1.31% 1.46% 8 LU Bakeri 1.28% 0.02% 9 Coca Cola 1.25% 0.8% 10 Surf Excel 1.20% 1.54% Pepsi, McDonalds, UBL Omni, LU Bakeri and Coca Cola replaced this year Telenor, Talkshawk, djuice, Walls Cornetto and Liption, making to the top 10 this list of 2011.
- 12. INDUSTRY TOP 10 BRANDS BASED ON NUMBER OF CAMPAIGNS CAMPAIGNS No. BRANDS 2011 2010 1 Jazz 68 53 2 Ufone GSM 35 18 3 UBL Omni 21 23 4 Talkshawk 18 29 5 Pepsi 16 4 6 Samaa TV 15 10 7 Nokia 14 20 8 Zong 14 45 9 Azm-e-Aalishan 13 17 10 HUM TV 13 3 In 2011 Pepsi, Samaa TV, Nokia and Hum TV reached the Top 10 replacing Telenor, djuice and government advertising.
- 13. ADVERTISING SHARE BY CHANNELS % Share: TOTAL MINUTES TOTAL RADIO INDUSTRY – 3 CITIES Josh99 FM96 FM101 6% 5% 2% Power99 FM107 7% 17% FM89 7% FM103 13% FM105 8% FM100 13% FM91 FM106.2 12% 10%
- 14. ADVERTISING SPEND BY CHANNELS % Share: AD SPEND TOTAL RADIO INDUSTRY – 3 CITIES FM105 FM96 Josh99 FM101 4% 2% 1% 2% Power99 5% FM103 17% FM89 11% FM106.2 16% FM91 12% FM107 FM100 14% 16% *Based on Tariff Rates
- 15. RADIO AD OCCURANCE BY DAYS OF WEEK Average Nos. of Ads on a Day ACROSS 3 CITIES 2,000 1,790 1,800 1,704 1,742 1,694 1,695 1,604 1,600 1,479 1,400 1,200 1,000 800 600 400 200 - *Based on Unique Channels Across 3 Cities
- 16. RADIO AD OCCURANCE BY DAYPART Average Nos. of Ads in Day part ACROSS 3 CITIES 400 353 350 333 330 300 250 196 200 157 150 139 126 100 50 18 17 - Morning House Show / Afternoon Pre – Drive Drive Time Late Evening Night Time Early Night Late Night Life Style Drive Time Evening TIME DEFINITIONS • Morning Time 8 am – 10 am • Late Evening 7 pm – 10 pm • House Show / Life Style 11 am – 01 pm • Night Time 10 pm – 12 am • Afternoon Drive 1 pm – 3 pm • Early Night 12 am – 1 am • Pre – Drive Time 3 pm – 5 pm • Late Night 1 am – 7 am • Drive Time Evening 5 pm – 7 pm
- 17. BRAND CLUTTER Nos. of Brands Advertised In 2011 vs. 2010 2011 2010 700 613 600 583 539 519 500 469 459 400 300 200 100 0 Karachi Lahore Islamabad
- 18. AVERAGE NUMBER OF ADS / DAY Comparison 2011 vs. 2010 2011 2010 2,500 2,306 2,153 2,000 1,500 1,508 1,580 1,190 1,155 1,000 500 0 Karachi Lahore Islamabad
- 19. For query on DATA, please contact Mustafa Farooqi at: Tel: (042) 3668 6170 / 3668 6171 Cell: (0321) 4022240 Email: mustafa.farooqi@mediamiles.biz For other questions, please contact PAS at: secretariat@pas.org.pk THE END