SlideShare una empresa de Scribd logo
1 de 8
Descargar para leer sin conexión
UNCTAD
                           Glloball IInvesttmentt Trends Moniittor
                           G oba nves men Trends Mon or

                   Global and Regional FDI Trends in 2010


                                                HIGHLIGHTS


     Developing and transition economies, for the first time, absorbed more than half of global FDI
                                                flows.

     Global inflows of foreign direct investment (FDI) rose marginally by 1%, from $1,114 billion in 2009
      to almost $1,122 billion in 2010, based on UNCTAD estimates.

                        Figure 1. FDI inflows, global and by group of economies, 1995-2010
                                                  (Billions of dollars)

                                                               Trans ition e conom ie s

                                                De ve loping e conom ie s
      2 000
            For the first time, deve loping and
            transition economies received more
      1 600
            that half of global FDI flow s.


      1 200                                          De ve lope d e conom ie s


       800                                                                                                                    53%


       400


          0
          1995   1996   1997   1998   1999   2000   2001   2002    2003     2004   2005   2006   2007   2008   2009   2010*


    Source: UNCTAD.
    * Preliminary estimates.

     A strong rebound in FDI flows to developing Asia and Latin America offset a further decline in
      inflows to developed countries (figure 1).


     Stagnant global flows in 2010 were accompanied by diverging trends in the components of FDI.
      While the increased profits of foreign affiliates, especially in developing countries, boosted
      reinvested earnings, the uncertainties surrounding global currency markets and European
      sovereign debt, resulted in negative intra-company loans and lower equity investments.


This report can be freely cited provided appropriate acknowledgement is given to UNCTAD, together with a
                                         reference to the document.
 Cross-border mergers and acquisitions (M&As) increased by 37% in 2010, while international
            greenfield projects, fell both in number and in value. Nevertheless, the total project value of
            greenfield investments has been much higher than that of cross-border M&As since the crisis,
            which was the opposite case before the crisis.

           The year was characterized by an unexpected drop in flows during the second quarter and a
            rebound in the third quarter. UNCTAD’s Global FDI Quarterly Index dropped from 107.7 to
            82.5 and then rose to 121 (see table 1 below). Projections for the fourth quarter – based on
            available data on M&As and greenfield investments – show a continuing flat trend. Cross-
            border M&As were down in the fourth quarter, compared to the third. Greenfield investments
            in the fourth quarter showed some improvements, but remained nearly at the same level as
            that of the previous year’s fourth quarter.

                                  Table 1. UNCTAD’s Global FDI Quarterly Index

                                                  2009:Q1         62.1
                                                  2009:Q2        105.8
                                                  2009:Q3        125.7
                                                  2009:Q4        119.9
                                                  2010:Q1        107.7
                                                  2010:Q2         82.5
                                                  2010:Q3        121.0
                                                  2010:Q4        105.3*
                                               *Preliminary estimates.


                                Global FDI flows stagnant in 2010

        Global FDI inflows remained stagnant in 2010 at an estimated $1,122 billion (table 2), compared to
$1,114 billion in the previous year. However, they showed an uneven pattern among regions, components and
modes of FDI. While FDI inflows to developed countries contracted further in 2010, those to developing and
transition economies recovered, surpassing the 50% mark of global FDI flows. The improvement of economic
conditions in 2010 drove up reinvested earnings, while equity capital and intra-company loans remained
relatively subdued. Cross-border M&A volume rebounded in 2010, whereas greenfield investments continued to
decline.

        The quarterly fluctuations during 2010, as reported in previous Global Trends Monitors, indicate that the
worldwide FDI recovery is still hesitant, although after an unexpectedly weak second quarter, global FDI flows
registered an increase in the third quarter of 2010 (figure 2). UNCTAD’s FDI Global Quarterly Index jumped
upwards, reaching 121 for the quarter, its highest reading in 2010. Preliminary data for the fourth quarter
suggests that global FDI flows continue to struggle to establish a sustainable growth path. FDI flows in the
quarter are likely to be flat, or slightly down, compared to the third quarter. While reinvested earnings will be
helped by higher corporate profits, weak equity capital flows – from cross-border M&As and greenfield
investments – will continue to keep FDI flows in a holding pattern during the quarter. In particular, cross-border
M&As registered a fall in value and in number during the fourth quarter. The high level of announced deals in
the latter half of 2010, however, indicates that the fourth quarter’s lull may be temporary and that M&A volumes
are likely to improve in early 2011.


      2
Table 2. FDI inflows and cross-border M&As, by region and major economy, 2009−2010
                                                 (Billions of dollars)

                                                                 FDI inflows                            Net cross-border M&Asb
                                                                          Growth rate                                  Growth rate
                      Region / economy                 2009       2010 a                               2009     2010
                                                                             (%)                                          (%)
    World                                 1 114.1                1 122.0          0.7                  249.7    341.4        36.7
     Developed economies                    565.9                  526.6        -6.9                   203.5    252.1        23.9
       Europe                               378.4                  295.4       -21.9                   133.9    125.0        -6.6
          European Union                    361.9                  289.8       -19.9                   116.2    115.3        -0.8
            Austria                           7.1                    12.6       78.8                      1.8      4.9      174.2
            Belgium                          33.8                    50.5       49.5                    12.1       9.4      -22.3
            Czech Republic                    2.7                     8.2      199.6                      2.7    - 0.5          ..
            Denmark                           7.8                     6.3      -19.2                      1.7      1.4      -12.6
            Finland                           2.6                     2.6         3.1                     0.5      0.3      -36.3
            France                           59.6                    57.4       -3.7                      0.7      4.3      500.3
            Germany                          35.6                    34.4       -3.5                    12.8     10.8       -15.2
            Greece                            3.4                     2.1      -38.3                      0.5    - 1.2          ..
            Ireland                          25.0                     8.4      -66.3                      1.7      2.3       31.8
            Italy                            30.5                    19.7      -35.5                      1.1      7.7      590.2
            Luxembourg                       27.3                    12.1      -55.7                      0.4      2.1      368.9
            Netherlands                      26.9                  - 24.7           ..                  18.0       3.5      -80.8
            Poland                           11.4                    10.4       -8.9                      0.8      1.0       32.5
            Portugal                          2.9                     3.4       17.8                      0.5      2.2      338.1
            Spain                            15.0                    15.7         4.3                   32.2       8.5      -73.4
            Sweden                           10.9                    12.1       11.6                      1.1      0.8      -23.0
            United Kingdom                   45.7                    46.2         1.2                   25.2     56.3       123.5
          United States                     129.9                  186.1        43.3                    40.1     79.6        98.6
          Japan                              11.9                     2.0      -83.4                    - 5.8      7.1          ..
     Developing economies                   478.3                  524.8          9.7                   39.1     85.1       117.6
       Africa                                58.6                    50.1      -14.4                      5.1      7.7       49.3
            Egypt                             6.7                     6.8         1.7                     1.0      0.2      -80.4
            Nigeria                           5.9                     2.3      -60.4                    - 0.2      0.4          ..
            South Africa                      5.7                     1.3      -77.9                      4.2      3.9       -6.5
       Latin America and the Caribbean      116.6                  141.1        21.1                    - 4.4    32.0           ..
            Argentina                         4.9                     5.1         4.0                     0.1      3.5     3001.5
            Brazil                           25.9                    30.2       16.3                    - 1.4      9.4          ..
            Chile                            12.7                    18.2       43.4                      0.8      1.8      121.0
            Colombia                          7.2                     8.7       20.8                    - 1.6      0.6          ..
            Mexico                           12.5                    19.1       52.9                      0.1      8.0     7616.1
            Peru                              4.8                     6.9       44.7                      0.0      0.7     1689.7
       Asia and Oceania                     303.2                  333.6        10.0                    38.3     45.3        18.4
          West Asia                          68.3                    57.2      -16.2                      3.5      4.8       34.5
            Turkey                            7.6                     7.0       -8.0                      2.8      2.1      -28.0
          South, East and South-East Asia   233.0                  274.6        17.8                    34.7     31.5        -9.2
            China                            95.0                101.0 c          6.3                   10.9       6.0      -44.6
            Hong Kong, China                 48.4                    62.6       29.2                      3.0    12.2       301.5
            India                            34.6                    23.7      -31.5                      6.0      5.2      -14.3
            Indonesia                         4.9                    12.8      162.7                      1.3      0.9      -33.1
            Malaysia                          1.4                     7.0      409.7                      0.4      3.7      939.0
            Singapore                        16.8                    37.4      122.7                      9.7      4.7      -51.1
            Thailand                          5.9                     6.8       14.2                      0.3      0.5       32.0
     South-East Europe and the CIS           69.9                    70.5         0.8                     7.1      4.3      -39.8
            Russian Federation               38.7                    39.7         2.5                     5.1      2.9      -43.6
Source: UNCTAD.
a
    Preliminary estimates by UNCTAD.
b
  Net cross-border M&As are sales of companies in the host economy to foreign transnational corporations (TNCs) excluding sales of foreign
affiliates in the host economy, while table 3 includes all cross-border M&A deals.
c
    Not including the financial sector.
Note: World FDI inflows are projected on the basis of 153 economies for which data are available for part of 2009 or full year estimate, as of
7 January 2011. Data are estimated by annualizing their available data, in most cases the first two or three quarters of 2010. The proportion
of inflows to these economies in total inflows to their respective region or subregion in 2009 is used to extrapolate the 2010 regional data.


                                                                                                                                     3
Figure 2. UNCTAD’s Global FDI Quarterly Indexa 2007 Q1–2010 Q4
                                          (Base 100: quarterly average of 2005)

          350


          300


          250


          200


          150


          100


           50


            0
                Q1     Q2          Q3   Q4    Q1     Q2          Q3   Q4    Q1     Q2          Q3   Q4    Q1     Q2          Q3   Q4*

                            2007                          2008                          2009                          2010


      Source: UNCTAD.
      *   Preliminary estimate.
      a
          The Global FDI Quarterly Index is based on quarterly data of FDI inflows for 67 countries, which together account for roughly
          90% of global flows. The index has been calibrated such that the average of quarterly flows in 2005 is equivalent to 100.


Developed countries: a further contraction
        Developed countries did not return to FDI growth in 2010. UNCTAD’s latest estimates show that FDI
flows to this group of economies fell some 7% to $527 billion, despite the robust recovery in some countries.
Most notably, FDI in the United States surged by more than 40% over 2009 levels, an increase worth $56
billion, the single biggest increase in FDI among the major economic regions. This rise is largely due to a
significant recovery in reinvested earnings of foreign affiliates.

        Europe stood out as the subregion where flows fell most sharply, explained largely by two groups of
countries. First, the Netherlands and Luxembourg saw significant declines. Negative FDI flows in the former
country were caused by more volatile flows related to transactions of financial affiliates. Second, uncertainties
about sovereign debts caused drops in FDI, with the largest impacts seen in Ireland and Italy (Greece and
Spain are less significant FDI recipients). FDI in the region’s major economies (France and Germany) fell only
slightly.

     Within the group of developed countries, declining FDI flows were also registered in Japan due to a
number of large divestments (e.g. Liberty Group, Ford).


Developing countries: the recovery has started
       FDI flows to developing economies rose some 10% to $525 billion in 2010, thanks to a relatively fast
economic recovery and increasing South–South flows. The value of cross-border M&As doubled – an
increasingly important mode of FDI entry into developing countries. Behind this general increase lie significant
differences: while Latin America and South, East and South-East Asia experienced strong growth in FDI inflows,
West Asia and Africa continued to see declines (table 2).

       Inflows to Africa, which peaked in 2008 driven by the resource boom, appear to continue the downward
trend of the previous year. For the region as a whole, UNCTAD estimates show that FDI inflows fell by 14% to
$50 billion in 2010, although there are significant regional variations. While the downward trends of inflows to
North Africa appear to have stabilized, in sub-Saharan Africa, inflows to South Africa declined to barely a
quarter of the 2009 level, contributing to the large fall of FDI inflows in the subregion. Cross-border M&As,


     4
1
mainly in extractive industries, registered an increase of 49%, while the number and value of greenfield
projects − normally the main mode of FDI in Africa − suffered a decline of about 10% in 2010. The rise of FDI
from developing Asia and Latin America to Africa was not yet enough to compensate for the decline of FDI from
developed countries which still account for the lion’s share of inward FDI flows to many African countries.

       Thanks to its position as a leader of the global economic recovery, FDI flows to South, East and South-
East Asia have picked up markedly, outperforming other developing regions. After a 17% decline in 2009,
inflows to the region rose by about 18% in 2010, reaching $275 billion, due to booming inflows in Singapore,
Hong Kong (China), China, Indonesia, Malaysia and Viet Nam, in that order. FDI flows (in the non-financial
sector) to China, for example, reached more than $100 billion. Breaking this general upward trend, South Asia
experienced a 14% drop in FDI, mainly due to declines in flows to India.

      FDI flows to West Asia, at $57 billion, continued to be affected by the global economic crisis, despite the
steady economic recovery registered by the economies of the region. Sizeable increases in government
spending by oil-rich countries helped push their economies forward, but conditions in the private sector
remained subdued. The picture varies by country, with inflows to the United Arab Emirates rebounding
modestly from the relatively low values of 2009, to little change in performance for Lebanon, to a drop in Saudi
Arabia due in part to foreign investors pulling out of or freezing large refinery projects (ConocoPhillips, Dow
Chemicals).

       A surge in cross-border M&As is the main factor explaining the significant increase in FDI flows to Latin
America and the Caribbean, which attained the level of $141 billion. Compared with negative values in 2009,
M&As reached $32 billion in 2010, nearly reaching the high values registered in the region during the 1990s.
The targets of these deals were mainly in the oil and gas, metal mining and food and beverages industries.
Strong economic growth, spurred by robust domestic and external demand, good macroeconomic
fundamentals and higher commodity prices, explain the quick recovery of FDI flows to the region. Nearly all the
big recipient countries saw inward flows increase, with Brazil remaining the largest destination for the fourth
consecutive year.


Transition economies: a halt to the decline
       The transition economies of South-East Europe and the Commonwealth of Independent States (CIS)
registered a marginal increase in FDI inflows, of roughly 1%, in 2010 to $71 billion, after falling more than 40%
in the previous year. FDI flows to South-East Europe continued their decline with a further negative 31% due to
sluggish investments from European Union countries (traditionally the dominant source of FDI in the subregion).
In contrast, the CIS economies saw flows increase by 5% on the back of stronger commodity prices, a faster
economic recovery and improving stock markets. Foreign investors in the Russian Federation are increasingly
targeting the fast growing local consumer market (the deal agreed by PepsiCo to buy Russian juice and dairy
company Wimm-Bill-Dann for $3.8 billion is emblematic).


Diverging patterns in FDI components and modes of entry
       Stagnant FDI flows in 2010 were accompanied by diverging trends in the components of FDI flows
(equity, intra-company loans and reinvested earnings) and by modes of entry (M&A and greenfield investments).
Improved economic performance in many parts of the world and increased profits of foreign affiliates, especially
in developing countries, lifted reinvested earnings to nearly double their 2009 level (figure 3). This increase
compensated for the decline in equity capital flows (down slightly despite an up-tick in cross-border M&As) and
in other capital flows (mainly intra-company loans) which saw a significant drop.


1
    India’s Bharti Airtel acquisition of the African mobile phone networks of Kuwait’s Zain for $10.7 billion (table 3)
    is not reported as an addition to FDI flows to Africa since it is only a change of foreign ownership.


                                                                                                                          5
Figure 3. Quarterly FDI inflows by components for 37 selected economies, 2007 Q1- 2010 Q4
                                               (Billions of dollars)
                                600


                                500


                                400


                                300


                                200


                                100


                                  0


                               - 100
                                        Q1   Q2    Q3    Q4    Q1    Q2    Q3    Q4    Q1   Q2   Q3     Q4   Q1    Q2      Q3   Q4*

                                               2007                   2008                   2009                     2010

                                                        Equity inflows     Reinvested earnings        Other capital

      Source: UNCTAD.
      *    Preliminary estimate.
          Note: Economies included are: Argentina, Australia, Austria, Belgium, Brazil, Bulgaria, Canada, Chile, Denmark, Estonia,
          France, Germany, Hong Kong (China), Hungary, India, Ireland, Israel, Japan, Kazakhstan, Latvia, Lithuania, Mexico,
          Republic of Moldova, Netherlands, New Zealand, Norway, Panama, Philippines, Poland, Portugal, Slovakia, Sweden,
          Switzerland, Taiwan Province of China, United Kingdom, United States and the Bolivarian Republic of Venezuela.


       Cross-border M&As, which typically react more quickly to changing economic conditions, jumped 37% in
2010 (figure 4), reflecting both the growing value of assets on the stock market and the increased financial
capability of potential buyers to carry out such operations. International greenfield investments, however, still
registered a drop in both value and number during the year (figure 4).

     Figure 4. Value and number of cross-border M&As and greenfield FDI projects, 2007 Q1 - 2010 Q4
                                   (Billion of dollars and number of deals)

                         500                                                                                                               5 000

                         450                                                                                                               4 500

                         400                                                                                                               4 000

                         350                                                                                                               3 500

                         300                                                                                                               3 000
             $ billion


                                                                                                                                                     Number


                         250                                                                                                               2 500

                         200                                                                                                               2 000

                         150                                                                                                               1 500

                         100                                                                                                               1 000

                         50                                                                                                                    500

                          0                                                                                                                0
                               Q1      Q2    Q3    Q4     Q1    Q2        Q3    Q4    Q1    Q2   Q3     Q4    Q1      Q2     Q3       Q4

                                        2007                        2008                     2009                       2010

                                       M&A value          Greenfield value             M&As number             Greenfield number

           Source: UNCTAD.
           Note: Data for value of greenfield FDI projects refer to estimated amounts of capital investment.

       Project value of greenfield investments has held up better since the crisis than that of cross-border M&As.
While the value of M&As equalled or exceeded greenfield investment before the crisis, it is now significantly lower.


      6
Improving FDI prospects for 2011
        For 2011, UNCTAD estimates FDI flows to be between $1.3 trillion and $1.5 trillion. Improved
macroeconomic conditions in 2010 strengthened TNCs’ corporate profits and boosted stock market valuations.
These favourable conditions coupled with rising business confidence in 2011 will help translate TNCs’ record
levels of cash holdings (in the order of four to five trillion dollars among developed country firms alone) into new
investments. TNCs will also face increasing pressure to make strategic investments to cement their business
plans for the post-crisis period. Worldwide M&A activity (domestic and cross-border M&As combined) is also
expected to rise further in 2011. The current overall favourable policy climate for foreign investors further
supports the positive prospects for FDI flows in 2011. Clearly, a number of risks to this positive scenario persist.
Worldwide GDP growth, after the “recovery-boost” in 2010, will slow down. In addition, risks related to currency
volatility, sovereign debt and investment protectionism could still derail the expected FDI upturn. A strong
global FDI recovery depends much on the steady economic and FDI recovery of the developed economies.

                        Table 3. Cross-border M&A deals with a value of over 3 billion in 2010
                  Value                                               Industry of the acquired                             (Ultimate) acquiring      Ultimate acquiring
                                     Acquired company                                                   Host economy
                ($ million)                                                  company                                             company                   nation

                                                                                     First quarter
                  7 603          Solvay Pharmaceuticals SA         Pharmaceutical preparations             Belgium          Abbott Laboratories        United States
                                                                   Cable and other pay televis ion
                                      Unity Media GmbH                                                     Germany          Liberty Media Corp         United States
                  5 195                                                      services
                                                                         Radiotelephone
                               Egyptian Co for Mobile Services                                              Egypt           France Telecom SA             France
                  4 469                                                  communications
                                                                   Cable and other pay televis ion
                               Liberty Global Inc- Subsidiaries                                          United States          KDDI Corp                 Japan
                  4 000                                                      services
                               Kraft Foods Inc-North American
                                                                       Frozen specialties, nec           United States          Nestle SA               Switzerland
                  3 700                 Pizza Bus iness
                              Springer Science+Business Media         Books: publis hing, or
                                                                                                      Germany               Group of Investors           Guernsey
                  3 363              Deutschland GmbH                 publishing & printing
                                                                                    Second quarter
                                                                   Candy and other confectionery
                                        Cadbury PLC                                                United Kingdom             Kraft Foods Inc          United States
                 18 769                                                     products
                                                                         Radiotelephone
                                        Zain Africa BV                                                 Nigeria                Bharti Airtel Ltd            India
                 10 700                                                 communications
                                                                          Radiotelephone
                                       T-Mobile(UK)Ltd                                                  United Kingdom      France Telecom SA             France
                  8 496                                                   communications
                              Fomento Economico Mexicano SAB
                                                                           Malt beverages                   Mexico          Group of Investors         Netherlands
                  7 325           de CV-Beer Operations
                                                                         Radiotelephone                                                                  Russian
                                      ZAO Kyivs tar GSM                                                    Ukraine              Vimpelkom
                  5 516                                                  communications                                                                 Federation
                               Republic of Venezuela-Carabobo       Crude petroleum and natural
                                                                                                          Venezuela         Group of Investors             India
                  4 848                      Block                              gas
                  4 031           OSI Pharmaceuticals Inc           Pharmaceutical preparations          United States     Astellas Pharm a Inc           Japan
                                   Bunge Participacoes e
                                                                          Soybean oil mills                 Brazil                Vale SA                  Brazil
                  3 800               Investimentos SA
                                                                     Radio & TV broadcasting &
                                        Tandberg ASA                                                       Norway           Cisco System s Inc         United States
                  3 426                                             communications equipm ent
                                     Tommy Hilfiger Corp             Men's s hirts and nightwear         Netherlands     Phillips-Van Heusen Corp      United States
                  3 160
                                                                    Crude petroleum and natural
                                         Bridas Corp                                                    Argentina                CNOOC                     China
                  3 100                                                          gas
                                                                                      Third quarter
                                                                          Radiotelephone
                                         Brasilcel NV                                                     Brazil              Telefonica SA                Spain
                  9 743                                                   communications
                  9 018                 Lihir Gold Ltd                       Gold ores              Papua New Guinea       Newcrest Mining Ltd           Australia
                                                                        Laboratory analytical
                                        Millipore Corp                                                United States            Merck KGaA                Germany
                  6 127                                                     instruments
                  5 959                 Sybase Inc                     Prepackaged Software           United States              SAP AG                  Germany
                  4 931        Ratiopharm International GmbH        Pharmaceutical preparations         Germany            Teva Pharm Inds Ltd            Israel
                                                                   Mechanical power transmis sion
                                        Tomkins PLC                                                  United Kingdom             Onex Corp                 Canada
                  4 380                                                    equipment, nec
                                                                       Motor vehicle parts and
                                     Denway Motors Ltd                                                Hong Kong, China             GAIG                    China
                  4 110                                                     accessories
                                    AXA SA-Life Assurance
                                                                           Life insurance               United Kingdom        Resolution Ltd             Guernsey
                  4 052                  Busines s,UK
                                   Valeant Pharm aceuticals
                                                                    Pharmaceutical preparations          United States   Valeant Pharmaceuticals          Canada
                  3 717                International Inc
                              Piramal Healthcare Ltd- Healthcare
                                                                    Pharmaceutical preparations              India          Abbott Laboratories        United States
                  3 713              Solutions Business

                                  Abertis Infraes tructuras SA     Highway and street construction          Spain        CVC Capital Partners Ltd     United Kingdom
                  3 679
                  3 330             Interactive Data Corp           Information retrieval services       United States   Interactive Data Corp SPV     United States
                                                                    Crude petroleum and natural
                                      Arrow Energy Ltd                                                     Australia      Royal Dutch Shell PLC        Netherlands
                  3 164                                                          gas
                                                                    Crude petroleum and natural
                               BP PLC-Permian Basin Assets                                               United States         Apache Corp             United States
                  3 100                                                          gas
                                                                                       Fourth quarter
                                 EDF Energy PLC-UK Power
                                                                          Electric services             United Kingdom      Group of Investors       Hong Kong, China
                  9 056            Dis tribution Business
                  7 625                 E.ON US LLC                   Natural gas distribution           United States           PPL Corp              United States
                                                                    Crude petroleum and natural
                                    Repsol YPF Brasil SA                                                    Brazil            Sinopec Group                China
                  7 111                                                           gas
                                                                    Automobiles and other motor                             Pors che Automobil
                                   Pors che Holding GmbH                                                    Austria                                      Germany
                  4   540                                                       vehicles                                       Holding SE
                  4   517               Pactiv Corp                    Plas tics foam products           United States       Rank Group Ltd            New Zealand
                  3   397                HS1 Ltd                    Railroads, line-haul operating      United Kingdom      Group of Investors           Canada
                  3   374          Andean Resources Ltd                        Gold ores                 United States         Goldcorp Inc              Canada

                                General Growth Properties Inc       Real es tate inves tment trusts      United States   Brookfield Asset Mgmt Inc        Canada
                  3 270
                                                                          Radiotelephone
                                Sunrise Communications AG                                                 Switzerland    CVC Capital Partners Ltd      Luxembourg
                  3 269                                                   communications
                                 BP PLC-Western Canadian            Crude petroleum and natural
                                                                                                           Canada              Apache Corp             United States
                  3 250            Ups tream Gas Assets                         gas
                                                                   Computer integrated systems                             Nippon Telegraph &
                               Dimens ion Data Holdings PLC                                              South Africa                                     Japan
                  3 119                                                        design                                          Telephone
                  3 090                  Intoll Group                  Inves tment offices, nec            Australia      Canada Pension Plan             Canada
                                                                   Functions related to depos itory
                                        RBS WorldPay                                                    United Kingdom      Group of Investors         United States
                  3 019                                                     banking, nec

              Source: UNCTAD.

                                                                                                                                                                          7
The next issue of UNCTAD’s Global Investment
          Trends Monitor will be released in
                    mid-April 2011.

    The next issue of UNCTAD’s Investment Policy
      Monitor will be released in the last week of
                     January 2011.


8

Más contenido relacionado

La actualidad más candente

Economic and policy implications of greater global integration OECD Economic ...
Economic and policy implications of greater global integration OECD Economic ...Economic and policy implications of greater global integration OECD Economic ...
Economic and policy implications of greater global integration OECD Economic ...OECD, Economics Department
 
Ministers presentation es final
Ministers presentation es finalMinisters presentation es final
Ministers presentation es finalchrismbori
 
Vivina Berla, Sarona Asset Management – "Security, Stability and Sustainabili...
Vivina Berla, Sarona Asset Management – "Security, Stability and Sustainabili...Vivina Berla, Sarona Asset Management – "Security, Stability and Sustainabili...
Vivina Berla, Sarona Asset Management – "Security, Stability and Sustainabili...Transformational Business Network
 
EIBTM 2013 Trends Watch Report by Rob Davidson
EIBTM 2013 Trends Watch Report by Rob DavidsonEIBTM 2013 Trends Watch Report by Rob Davidson
EIBTM 2013 Trends Watch Report by Rob DavidsonRaúl Sánchez Tarí
 
Dubai middle east investment summit
Dubai middle east investment summitDubai middle east investment summit
Dubai middle east investment summitFabio Scacciavillani
 
2001 jetro white paper on international trade and foreign direct investment (...
2001 jetro white paper on international trade and foreign direct investment (...2001 jetro white paper on international trade and foreign direct investment (...
2001 jetro white paper on international trade and foreign direct investment (...Pim Piepers
 
OECD and the Black Sea region: Promoting private sector development and job c...
OECD and the Black Sea region: Promoting private sector development and job c...OECD and the Black Sea region: Promoting private sector development and job c...
OECD and the Black Sea region: Promoting private sector development and job c...blackseaforum
 
Weekly markets perspectives september 24 (1)
Weekly markets perspectives september 24 (1)Weekly markets perspectives september 24 (1)
Weekly markets perspectives september 24 (1)Fincor Corretora
 
Economic Highlights Presentation, Q1 2011
Economic Highlights Presentation, Q1 2011Economic Highlights Presentation, Q1 2011
Economic Highlights Presentation, Q1 2011Assaf Luxembourg
 
2011-2012 World Investment Report
2011-2012 World Investment Report2011-2012 World Investment Report
2011-2012 World Investment ReportJayson Kim
 
Malaysia economic in figures 2017
Malaysia economic in figures 2017Malaysia economic in figures 2017
Malaysia economic in figures 2017hafiz razak
 
European Debt: That sinking feeling…again? | Articles and Publications
European Debt: That sinking feeling…again? | Articles and PublicationsEuropean Debt: That sinking feeling…again? | Articles and Publications
European Debt: That sinking feeling…again? | Articles and PublicationsAranca
 
Aranca views: Europe Debt - That Sinking Feeling Again
Aranca views: Europe Debt - That Sinking Feeling AgainAranca views: Europe Debt - That Sinking Feeling Again
Aranca views: Europe Debt - That Sinking Feeling AgainVikas Sharan
 

La actualidad más candente (17)

Wir2011 en
Wir2011 enWir2011 en
Wir2011 en
 
Economic and policy implications of greater global integration OECD Economic ...
Economic and policy implications of greater global integration OECD Economic ...Economic and policy implications of greater global integration OECD Economic ...
Economic and policy implications of greater global integration OECD Economic ...
 
Ministers presentation es final
Ministers presentation es finalMinisters presentation es final
Ministers presentation es final
 
World Investment Report 2012
World Investment Report 2012World Investment Report 2012
World Investment Report 2012
 
Vivina Berla, Sarona Asset Management – "Security, Stability and Sustainabili...
Vivina Berla, Sarona Asset Management – "Security, Stability and Sustainabili...Vivina Berla, Sarona Asset Management – "Security, Stability and Sustainabili...
Vivina Berla, Sarona Asset Management – "Security, Stability and Sustainabili...
 
EIBTM 2013 Trends Watch Report by Rob Davidson
EIBTM 2013 Trends Watch Report by Rob DavidsonEIBTM 2013 Trends Watch Report by Rob Davidson
EIBTM 2013 Trends Watch Report by Rob Davidson
 
Dubai middle east investment summit
Dubai middle east investment summitDubai middle east investment summit
Dubai middle east investment summit
 
2001 jetro white paper on international trade and foreign direct investment (...
2001 jetro white paper on international trade and foreign direct investment (...2001 jetro white paper on international trade and foreign direct investment (...
2001 jetro white paper on international trade and foreign direct investment (...
 
World Investment Report - Towards a New Generation of Investment Policies 2012
World Investment Report - Towards a New Generation of Investment Policies 2012World Investment Report - Towards a New Generation of Investment Policies 2012
World Investment Report - Towards a New Generation of Investment Policies 2012
 
OECD and the Black Sea region: Promoting private sector development and job c...
OECD and the Black Sea region: Promoting private sector development and job c...OECD and the Black Sea region: Promoting private sector development and job c...
OECD and the Black Sea region: Promoting private sector development and job c...
 
Weekly markets perspectives september 24 (1)
Weekly markets perspectives september 24 (1)Weekly markets perspectives september 24 (1)
Weekly markets perspectives september 24 (1)
 
Economic Highlights Presentation, Q1 2011
Economic Highlights Presentation, Q1 2011Economic Highlights Presentation, Q1 2011
Economic Highlights Presentation, Q1 2011
 
2011-2012 World Investment Report
2011-2012 World Investment Report2011-2012 World Investment Report
2011-2012 World Investment Report
 
Malaysia economic in figures 2017
Malaysia economic in figures 2017Malaysia economic in figures 2017
Malaysia economic in figures 2017
 
European Debt: That sinking feeling…again? | Articles and Publications
European Debt: That sinking feeling…again? | Articles and PublicationsEuropean Debt: That sinking feeling…again? | Articles and Publications
European Debt: That sinking feeling…again? | Articles and Publications
 
Aranca views: Europe Debt - That Sinking Feeling Again
Aranca views: Europe Debt - That Sinking Feeling AgainAranca views: Europe Debt - That Sinking Feeling Again
Aranca views: Europe Debt - That Sinking Feeling Again
 
MTBiz February 2012
MTBiz February 2012MTBiz February 2012
MTBiz February 2012
 

Destacado (6)

Haciendo pais no. 2 vf
Haciendo pais no. 2   vfHaciendo pais no. 2   vf
Haciendo pais no. 2 vf
 
Panorama laboral oit 2010
Panorama laboral oit 2010Panorama laboral oit 2010
Panorama laboral oit 2010
 
Peru indice libertad economica 2011
Peru   indice libertad economica 2011Peru   indice libertad economica 2011
Peru indice libertad economica 2011
 
Perú
PerúPerú
Perú
 
Informe gestion 2006 2011
Informe gestion 2006   2011Informe gestion 2006   2011
Informe gestion 2006 2011
 
100319 sector minero_pedro_sanchez
100319 sector minero_pedro_sanchez100319 sector minero_pedro_sanchez
100319 sector minero_pedro_sanchez
 

Similar a Unctad fdi 2010

Highlights 2010 11 Economic Outlook
Highlights 2010 11 Economic OutlookHighlights 2010 11 Economic Outlook
Highlights 2010 11 Economic Outlookgauravkakran
 
Demands공급 발제
Demands공급 발제Demands공급 발제
Demands공급 발제현우 임
 
Fdi in bangladesh problems & prospects
Fdi in bangladesh problems & prospectsFdi in bangladesh problems & prospects
Fdi in bangladesh problems & prospectsMushfiq Rayan
 
Greece economic update 09.2012
Greece economic update 09.2012Greece economic update 09.2012
Greece economic update 09.2012Philip Ammerman
 
Presentation on emerging challenges in FDI
Presentation on emerging challenges in FDIPresentation on emerging challenges in FDI
Presentation on emerging challenges in FDIKhizer Ahmed Sheriff
 
Palestra: Global Economic Perspectives From Crisis to Recovery - José Antônio...
Palestra: Global Economic Perspectives From Crisis to Recovery - José Antônio...Palestra: Global Economic Perspectives From Crisis to Recovery - José Antônio...
Palestra: Global Economic Perspectives From Crisis to Recovery - José Antônio...ExpoGestão
 
Florida's New Normal Economy
Florida's New Normal EconomyFlorida's New Normal Economy
Florida's New Normal EconomyFloridanomics
 
Invest in Bosnia and Herzegovina
Invest in Bosnia and HerzegovinaInvest in Bosnia and Herzegovina
Invest in Bosnia and HerzegovinaAmel Kovacevic
 
French Commercial Property Markets 2012
French Commercial Property Markets 2012 French Commercial Property Markets 2012
French Commercial Property Markets 2012 Cushman & Wakefield
 
1ª conferência - James S Henry
1ª conferência - James S Henry 1ª conferência - James S Henry
1ª conferência - James S Henry CIEF2012
 
Development cooperation in times of the financial crisis
Development cooperation in times of the financial crisisDevelopment cooperation in times of the financial crisis
Development cooperation in times of the financial crisisReinhard Schmidbauer
 
Panorama económico mundial del FMI
Panorama económico mundial del FMIPanorama económico mundial del FMI
Panorama económico mundial del FMIJoaquin Santelices
 
Economic survey 2012
Economic survey 2012Economic survey 2012
Economic survey 2012MILLA MENGA
 
Volkan emre financial system development in ld cs
Volkan emre  financial system development in ld csVolkan emre  financial system development in ld cs
Volkan emre financial system development in ld csVolkan Emre
 
Global & irish economic outlook john beggs, aib 17 02-11
Global & irish economic outlook   john beggs, aib 17 02-11Global & irish economic outlook   john beggs, aib 17 02-11
Global & irish economic outlook john beggs, aib 17 02-11Sales Institute Ireland
 
Global & irish economic outlook john beggs, aib 17 02-11
Global & irish economic outlook   john beggs, aib 17 02-11Global & irish economic outlook   john beggs, aib 17 02-11
Global & irish economic outlook john beggs, aib 17 02-11Sales Institute Ireland
 
Trends in India's Foreign Trade
Trends in India's Foreign TradeTrends in India's Foreign Trade
Trends in India's Foreign TradeTriptiforyou
 

Similar a Unctad fdi 2010 (20)

Indian Ocean Region Seychelles
Indian Ocean Region SeychellesIndian Ocean Region Seychelles
Indian Ocean Region Seychelles
 
Highlights 2010 11 Economic Outlook
Highlights 2010 11 Economic OutlookHighlights 2010 11 Economic Outlook
Highlights 2010 11 Economic Outlook
 
Demands공급 발제
Demands공급 발제Demands공급 발제
Demands공급 발제
 
Fdi in bangladesh problems & prospects
Fdi in bangladesh problems & prospectsFdi in bangladesh problems & prospects
Fdi in bangladesh problems & prospects
 
Greece economic update 09.2012
Greece economic update 09.2012Greece economic update 09.2012
Greece economic update 09.2012
 
Presentation on emerging challenges in FDI
Presentation on emerging challenges in FDIPresentation on emerging challenges in FDI
Presentation on emerging challenges in FDI
 
Palestra: Global Economic Perspectives From Crisis to Recovery - José Antônio...
Palestra: Global Economic Perspectives From Crisis to Recovery - José Antônio...Palestra: Global Economic Perspectives From Crisis to Recovery - José Antônio...
Palestra: Global Economic Perspectives From Crisis to Recovery - José Antônio...
 
Florida's New Normal Economy
Florida's New Normal EconomyFlorida's New Normal Economy
Florida's New Normal Economy
 
Invest in Bosnia and Herzegovina
Invest in Bosnia and HerzegovinaInvest in Bosnia and Herzegovina
Invest in Bosnia and Herzegovina
 
French Commercial Property Markets 2012
French Commercial Property Markets 2012 French Commercial Property Markets 2012
French Commercial Property Markets 2012
 
1ª conferência - James S Henry
1ª conferência - James S Henry 1ª conferência - James S Henry
1ª conferência - James S Henry
 
Development cooperation in times of the financial crisis
Development cooperation in times of the financial crisisDevelopment cooperation in times of the financial crisis
Development cooperation in times of the financial crisis
 
Panorama económico mundial del FMI
Panorama económico mundial del FMIPanorama económico mundial del FMI
Panorama económico mundial del FMI
 
Medium term scenario
Medium term scenarioMedium term scenario
Medium term scenario
 
Economic survey 2012
Economic survey 2012Economic survey 2012
Economic survey 2012
 
Volkan emre financial system development in ld cs
Volkan emre  financial system development in ld csVolkan emre  financial system development in ld cs
Volkan emre financial system development in ld cs
 
Global & irish economic outlook john beggs, aib 17 02-11
Global & irish economic outlook   john beggs, aib 17 02-11Global & irish economic outlook   john beggs, aib 17 02-11
Global & irish economic outlook john beggs, aib 17 02-11
 
Global & irish economic outlook john beggs, aib 17 02-11
Global & irish economic outlook   john beggs, aib 17 02-11Global & irish economic outlook   john beggs, aib 17 02-11
Global & irish economic outlook john beggs, aib 17 02-11
 
Trends in India's Foreign Trade
Trends in India's Foreign TradeTrends in India's Foreign Trade
Trends in India's Foreign Trade
 
Oct City Dipp
Oct City DippOct City Dipp
Oct City Dipp
 

Más de EMPRESARIOS HACIENDO PAÍS (20)

Puno
PunoPuno
Puno
 
Ucayali
UcayaliUcayali
Ucayali
 
Tumbes
TumbesTumbes
Tumbes
 
Tacna
TacnaTacna
Tacna
 
San martin
San martinSan martin
San martin
 
Piura
PiuraPiura
Piura
 
Pasco
PascoPasco
Pasco
 
Moquegua
MoqueguaMoquegua
Moquegua
 
Madre de dios
Madre de diosMadre de dios
Madre de dios
 
Lima
LimaLima
Lima
 
Lambayeque
LambayequeLambayeque
Lambayeque
 
La libertad
La libertadLa libertad
La libertad
 
Junin
JuninJunin
Junin
 
Ica
IcaIca
Ica
 
Huánuco
HuánucoHuánuco
Huánuco
 
Huancavelica
HuancavelicaHuancavelica
Huancavelica
 
Cusco
CuscoCusco
Cusco
 
Cajamarca
CajamarcaCajamarca
Cajamarca
 
Ayacucho
AyacuchoAyacucho
Ayacucho
 
Arequipa
ArequipaArequipa
Arequipa
 

Último

Kisan Call Centre - To harness potential of ICT in Agriculture by answer farm...
Kisan Call Centre - To harness potential of ICT in Agriculture by answer farm...Kisan Call Centre - To harness potential of ICT in Agriculture by answer farm...
Kisan Call Centre - To harness potential of ICT in Agriculture by answer farm...Krashi Coaching
 
POINT- BIOCHEMISTRY SEM 2 ENZYMES UNIT 5.pptx
POINT- BIOCHEMISTRY SEM 2 ENZYMES UNIT 5.pptxPOINT- BIOCHEMISTRY SEM 2 ENZYMES UNIT 5.pptx
POINT- BIOCHEMISTRY SEM 2 ENZYMES UNIT 5.pptxSayali Powar
 
Hybridoma Technology ( Production , Purification , and Application )
Hybridoma Technology  ( Production , Purification , and Application  ) Hybridoma Technology  ( Production , Purification , and Application  )
Hybridoma Technology ( Production , Purification , and Application ) Sakshi Ghasle
 
Separation of Lanthanides/ Lanthanides and Actinides
Separation of Lanthanides/ Lanthanides and ActinidesSeparation of Lanthanides/ Lanthanides and Actinides
Separation of Lanthanides/ Lanthanides and ActinidesFatimaKhan178732
 
Advanced Views - Calendar View in Odoo 17
Advanced Views - Calendar View in Odoo 17Advanced Views - Calendar View in Odoo 17
Advanced Views - Calendar View in Odoo 17Celine George
 
Z Score,T Score, Percential Rank and Box Plot Graph
Z Score,T Score, Percential Rank and Box Plot GraphZ Score,T Score, Percential Rank and Box Plot Graph
Z Score,T Score, Percential Rank and Box Plot GraphThiyagu K
 
Presentation by Andreas Schleicher Tackling the School Absenteeism Crisis 30 ...
Presentation by Andreas Schleicher Tackling the School Absenteeism Crisis 30 ...Presentation by Andreas Schleicher Tackling the School Absenteeism Crisis 30 ...
Presentation by Andreas Schleicher Tackling the School Absenteeism Crisis 30 ...EduSkills OECD
 
Employee wellbeing at the workplace.pptx
Employee wellbeing at the workplace.pptxEmployee wellbeing at the workplace.pptx
Employee wellbeing at the workplace.pptxNirmalaLoungPoorunde1
 
SOCIAL AND HISTORICAL CONTEXT - LFTVD.pptx
SOCIAL AND HISTORICAL CONTEXT - LFTVD.pptxSOCIAL AND HISTORICAL CONTEXT - LFTVD.pptx
SOCIAL AND HISTORICAL CONTEXT - LFTVD.pptxiammrhaywood
 
Contemporary philippine arts from the regions_PPT_Module_12 [Autosaved] (1).pptx
Contemporary philippine arts from the regions_PPT_Module_12 [Autosaved] (1).pptxContemporary philippine arts from the regions_PPT_Module_12 [Autosaved] (1).pptx
Contemporary philippine arts from the regions_PPT_Module_12 [Autosaved] (1).pptxRoyAbrique
 
mini mental status format.docx
mini    mental       status     format.docxmini    mental       status     format.docx
mini mental status format.docxPoojaSen20
 
How to Make a Pirate ship Primary Education.pptx
How to Make a Pirate ship Primary Education.pptxHow to Make a Pirate ship Primary Education.pptx
How to Make a Pirate ship Primary Education.pptxmanuelaromero2013
 
Nutritional Needs Presentation - HLTH 104
Nutritional Needs Presentation - HLTH 104Nutritional Needs Presentation - HLTH 104
Nutritional Needs Presentation - HLTH 104misteraugie
 
Web & Social Media Analytics Previous Year Question Paper.pdf
Web & Social Media Analytics Previous Year Question Paper.pdfWeb & Social Media Analytics Previous Year Question Paper.pdf
Web & Social Media Analytics Previous Year Question Paper.pdfJayanti Pande
 
Accessible design: Minimum effort, maximum impact
Accessible design: Minimum effort, maximum impactAccessible design: Minimum effort, maximum impact
Accessible design: Minimum effort, maximum impactdawncurless
 
The Most Excellent Way | 1 Corinthians 13
The Most Excellent Way | 1 Corinthians 13The Most Excellent Way | 1 Corinthians 13
The Most Excellent Way | 1 Corinthians 13Steve Thomason
 
Organic Name Reactions for the students and aspirants of Chemistry12th.pptx
Organic Name Reactions  for the students and aspirants of Chemistry12th.pptxOrganic Name Reactions  for the students and aspirants of Chemistry12th.pptx
Organic Name Reactions for the students and aspirants of Chemistry12th.pptxVS Mahajan Coaching Centre
 

Último (20)

Kisan Call Centre - To harness potential of ICT in Agriculture by answer farm...
Kisan Call Centre - To harness potential of ICT in Agriculture by answer farm...Kisan Call Centre - To harness potential of ICT in Agriculture by answer farm...
Kisan Call Centre - To harness potential of ICT in Agriculture by answer farm...
 
POINT- BIOCHEMISTRY SEM 2 ENZYMES UNIT 5.pptx
POINT- BIOCHEMISTRY SEM 2 ENZYMES UNIT 5.pptxPOINT- BIOCHEMISTRY SEM 2 ENZYMES UNIT 5.pptx
POINT- BIOCHEMISTRY SEM 2 ENZYMES UNIT 5.pptx
 
Hybridoma Technology ( Production , Purification , and Application )
Hybridoma Technology  ( Production , Purification , and Application  ) Hybridoma Technology  ( Production , Purification , and Application  )
Hybridoma Technology ( Production , Purification , and Application )
 
Separation of Lanthanides/ Lanthanides and Actinides
Separation of Lanthanides/ Lanthanides and ActinidesSeparation of Lanthanides/ Lanthanides and Actinides
Separation of Lanthanides/ Lanthanides and Actinides
 
Advanced Views - Calendar View in Odoo 17
Advanced Views - Calendar View in Odoo 17Advanced Views - Calendar View in Odoo 17
Advanced Views - Calendar View in Odoo 17
 
Z Score,T Score, Percential Rank and Box Plot Graph
Z Score,T Score, Percential Rank and Box Plot GraphZ Score,T Score, Percential Rank and Box Plot Graph
Z Score,T Score, Percential Rank and Box Plot Graph
 
Presentation by Andreas Schleicher Tackling the School Absenteeism Crisis 30 ...
Presentation by Andreas Schleicher Tackling the School Absenteeism Crisis 30 ...Presentation by Andreas Schleicher Tackling the School Absenteeism Crisis 30 ...
Presentation by Andreas Schleicher Tackling the School Absenteeism Crisis 30 ...
 
Employee wellbeing at the workplace.pptx
Employee wellbeing at the workplace.pptxEmployee wellbeing at the workplace.pptx
Employee wellbeing at the workplace.pptx
 
SOCIAL AND HISTORICAL CONTEXT - LFTVD.pptx
SOCIAL AND HISTORICAL CONTEXT - LFTVD.pptxSOCIAL AND HISTORICAL CONTEXT - LFTVD.pptx
SOCIAL AND HISTORICAL CONTEXT - LFTVD.pptx
 
Contemporary philippine arts from the regions_PPT_Module_12 [Autosaved] (1).pptx
Contemporary philippine arts from the regions_PPT_Module_12 [Autosaved] (1).pptxContemporary philippine arts from the regions_PPT_Module_12 [Autosaved] (1).pptx
Contemporary philippine arts from the regions_PPT_Module_12 [Autosaved] (1).pptx
 
Código Creativo y Arte de Software | Unidad 1
Código Creativo y Arte de Software | Unidad 1Código Creativo y Arte de Software | Unidad 1
Código Creativo y Arte de Software | Unidad 1
 
mini mental status format.docx
mini    mental       status     format.docxmini    mental       status     format.docx
mini mental status format.docx
 
Mattingly "AI & Prompt Design: The Basics of Prompt Design"
Mattingly "AI & Prompt Design: The Basics of Prompt Design"Mattingly "AI & Prompt Design: The Basics of Prompt Design"
Mattingly "AI & Prompt Design: The Basics of Prompt Design"
 
Mattingly "AI & Prompt Design: Structured Data, Assistants, & RAG"
Mattingly "AI & Prompt Design: Structured Data, Assistants, & RAG"Mattingly "AI & Prompt Design: Structured Data, Assistants, & RAG"
Mattingly "AI & Prompt Design: Structured Data, Assistants, & RAG"
 
How to Make a Pirate ship Primary Education.pptx
How to Make a Pirate ship Primary Education.pptxHow to Make a Pirate ship Primary Education.pptx
How to Make a Pirate ship Primary Education.pptx
 
Nutritional Needs Presentation - HLTH 104
Nutritional Needs Presentation - HLTH 104Nutritional Needs Presentation - HLTH 104
Nutritional Needs Presentation - HLTH 104
 
Web & Social Media Analytics Previous Year Question Paper.pdf
Web & Social Media Analytics Previous Year Question Paper.pdfWeb & Social Media Analytics Previous Year Question Paper.pdf
Web & Social Media Analytics Previous Year Question Paper.pdf
 
Accessible design: Minimum effort, maximum impact
Accessible design: Minimum effort, maximum impactAccessible design: Minimum effort, maximum impact
Accessible design: Minimum effort, maximum impact
 
The Most Excellent Way | 1 Corinthians 13
The Most Excellent Way | 1 Corinthians 13The Most Excellent Way | 1 Corinthians 13
The Most Excellent Way | 1 Corinthians 13
 
Organic Name Reactions for the students and aspirants of Chemistry12th.pptx
Organic Name Reactions  for the students and aspirants of Chemistry12th.pptxOrganic Name Reactions  for the students and aspirants of Chemistry12th.pptx
Organic Name Reactions for the students and aspirants of Chemistry12th.pptx
 

Unctad fdi 2010

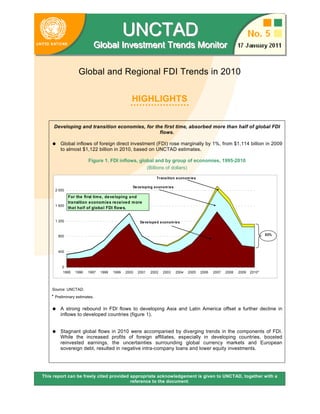
  • 1. UNCTAD Glloball IInvesttmentt Trends Moniittor G oba nves men Trends Mon or Global and Regional FDI Trends in 2010 HIGHLIGHTS Developing and transition economies, for the first time, absorbed more than half of global FDI flows.  Global inflows of foreign direct investment (FDI) rose marginally by 1%, from $1,114 billion in 2009 to almost $1,122 billion in 2010, based on UNCTAD estimates. Figure 1. FDI inflows, global and by group of economies, 1995-2010 (Billions of dollars) Trans ition e conom ie s De ve loping e conom ie s 2 000 For the first time, deve loping and transition economies received more 1 600 that half of global FDI flow s. 1 200 De ve lope d e conom ie s 800 53% 400 0 1995 1996 1997 1998 1999 2000 2001 2002 2003 2004 2005 2006 2007 2008 2009 2010* Source: UNCTAD. * Preliminary estimates.  A strong rebound in FDI flows to developing Asia and Latin America offset a further decline in inflows to developed countries (figure 1).  Stagnant global flows in 2010 were accompanied by diverging trends in the components of FDI. While the increased profits of foreign affiliates, especially in developing countries, boosted reinvested earnings, the uncertainties surrounding global currency markets and European sovereign debt, resulted in negative intra-company loans and lower equity investments. This report can be freely cited provided appropriate acknowledgement is given to UNCTAD, together with a reference to the document.
  • 2.  Cross-border mergers and acquisitions (M&As) increased by 37% in 2010, while international greenfield projects, fell both in number and in value. Nevertheless, the total project value of greenfield investments has been much higher than that of cross-border M&As since the crisis, which was the opposite case before the crisis.  The year was characterized by an unexpected drop in flows during the second quarter and a rebound in the third quarter. UNCTAD’s Global FDI Quarterly Index dropped from 107.7 to 82.5 and then rose to 121 (see table 1 below). Projections for the fourth quarter – based on available data on M&As and greenfield investments – show a continuing flat trend. Cross- border M&As were down in the fourth quarter, compared to the third. Greenfield investments in the fourth quarter showed some improvements, but remained nearly at the same level as that of the previous year’s fourth quarter. Table 1. UNCTAD’s Global FDI Quarterly Index 2009:Q1 62.1 2009:Q2 105.8 2009:Q3 125.7 2009:Q4 119.9 2010:Q1 107.7 2010:Q2 82.5 2010:Q3 121.0 2010:Q4 105.3* *Preliminary estimates. Global FDI flows stagnant in 2010 Global FDI inflows remained stagnant in 2010 at an estimated $1,122 billion (table 2), compared to $1,114 billion in the previous year. However, they showed an uneven pattern among regions, components and modes of FDI. While FDI inflows to developed countries contracted further in 2010, those to developing and transition economies recovered, surpassing the 50% mark of global FDI flows. The improvement of economic conditions in 2010 drove up reinvested earnings, while equity capital and intra-company loans remained relatively subdued. Cross-border M&A volume rebounded in 2010, whereas greenfield investments continued to decline. The quarterly fluctuations during 2010, as reported in previous Global Trends Monitors, indicate that the worldwide FDI recovery is still hesitant, although after an unexpectedly weak second quarter, global FDI flows registered an increase in the third quarter of 2010 (figure 2). UNCTAD’s FDI Global Quarterly Index jumped upwards, reaching 121 for the quarter, its highest reading in 2010. Preliminary data for the fourth quarter suggests that global FDI flows continue to struggle to establish a sustainable growth path. FDI flows in the quarter are likely to be flat, or slightly down, compared to the third quarter. While reinvested earnings will be helped by higher corporate profits, weak equity capital flows – from cross-border M&As and greenfield investments – will continue to keep FDI flows in a holding pattern during the quarter. In particular, cross-border M&As registered a fall in value and in number during the fourth quarter. The high level of announced deals in the latter half of 2010, however, indicates that the fourth quarter’s lull may be temporary and that M&A volumes are likely to improve in early 2011. 2
  • 3. Table 2. FDI inflows and cross-border M&As, by region and major economy, 2009−2010 (Billions of dollars) FDI inflows Net cross-border M&Asb Growth rate Growth rate Region / economy 2009 2010 a 2009 2010 (%) (%) World 1 114.1 1 122.0 0.7 249.7 341.4 36.7 Developed economies 565.9 526.6 -6.9 203.5 252.1 23.9 Europe 378.4 295.4 -21.9 133.9 125.0 -6.6 European Union 361.9 289.8 -19.9 116.2 115.3 -0.8 Austria 7.1 12.6 78.8 1.8 4.9 174.2 Belgium 33.8 50.5 49.5 12.1 9.4 -22.3 Czech Republic 2.7 8.2 199.6 2.7 - 0.5 .. Denmark 7.8 6.3 -19.2 1.7 1.4 -12.6 Finland 2.6 2.6 3.1 0.5 0.3 -36.3 France 59.6 57.4 -3.7 0.7 4.3 500.3 Germany 35.6 34.4 -3.5 12.8 10.8 -15.2 Greece 3.4 2.1 -38.3 0.5 - 1.2 .. Ireland 25.0 8.4 -66.3 1.7 2.3 31.8 Italy 30.5 19.7 -35.5 1.1 7.7 590.2 Luxembourg 27.3 12.1 -55.7 0.4 2.1 368.9 Netherlands 26.9 - 24.7 .. 18.0 3.5 -80.8 Poland 11.4 10.4 -8.9 0.8 1.0 32.5 Portugal 2.9 3.4 17.8 0.5 2.2 338.1 Spain 15.0 15.7 4.3 32.2 8.5 -73.4 Sweden 10.9 12.1 11.6 1.1 0.8 -23.0 United Kingdom 45.7 46.2 1.2 25.2 56.3 123.5 United States 129.9 186.1 43.3 40.1 79.6 98.6 Japan 11.9 2.0 -83.4 - 5.8 7.1 .. Developing economies 478.3 524.8 9.7 39.1 85.1 117.6 Africa 58.6 50.1 -14.4 5.1 7.7 49.3 Egypt 6.7 6.8 1.7 1.0 0.2 -80.4 Nigeria 5.9 2.3 -60.4 - 0.2 0.4 .. South Africa 5.7 1.3 -77.9 4.2 3.9 -6.5 Latin America and the Caribbean 116.6 141.1 21.1 - 4.4 32.0 .. Argentina 4.9 5.1 4.0 0.1 3.5 3001.5 Brazil 25.9 30.2 16.3 - 1.4 9.4 .. Chile 12.7 18.2 43.4 0.8 1.8 121.0 Colombia 7.2 8.7 20.8 - 1.6 0.6 .. Mexico 12.5 19.1 52.9 0.1 8.0 7616.1 Peru 4.8 6.9 44.7 0.0 0.7 1689.7 Asia and Oceania 303.2 333.6 10.0 38.3 45.3 18.4 West Asia 68.3 57.2 -16.2 3.5 4.8 34.5 Turkey 7.6 7.0 -8.0 2.8 2.1 -28.0 South, East and South-East Asia 233.0 274.6 17.8 34.7 31.5 -9.2 China 95.0 101.0 c 6.3 10.9 6.0 -44.6 Hong Kong, China 48.4 62.6 29.2 3.0 12.2 301.5 India 34.6 23.7 -31.5 6.0 5.2 -14.3 Indonesia 4.9 12.8 162.7 1.3 0.9 -33.1 Malaysia 1.4 7.0 409.7 0.4 3.7 939.0 Singapore 16.8 37.4 122.7 9.7 4.7 -51.1 Thailand 5.9 6.8 14.2 0.3 0.5 32.0 South-East Europe and the CIS 69.9 70.5 0.8 7.1 4.3 -39.8 Russian Federation 38.7 39.7 2.5 5.1 2.9 -43.6 Source: UNCTAD. a Preliminary estimates by UNCTAD. b Net cross-border M&As are sales of companies in the host economy to foreign transnational corporations (TNCs) excluding sales of foreign affiliates in the host economy, while table 3 includes all cross-border M&A deals. c Not including the financial sector. Note: World FDI inflows are projected on the basis of 153 economies for which data are available for part of 2009 or full year estimate, as of 7 January 2011. Data are estimated by annualizing their available data, in most cases the first two or three quarters of 2010. The proportion of inflows to these economies in total inflows to their respective region or subregion in 2009 is used to extrapolate the 2010 regional data. 3
  • 4. Figure 2. UNCTAD’s Global FDI Quarterly Indexa 2007 Q1–2010 Q4 (Base 100: quarterly average of 2005) 350 300 250 200 150 100 50 0 Q1 Q2 Q3 Q4 Q1 Q2 Q3 Q4 Q1 Q2 Q3 Q4 Q1 Q2 Q3 Q4* 2007 2008 2009 2010 Source: UNCTAD. * Preliminary estimate. a The Global FDI Quarterly Index is based on quarterly data of FDI inflows for 67 countries, which together account for roughly 90% of global flows. The index has been calibrated such that the average of quarterly flows in 2005 is equivalent to 100. Developed countries: a further contraction Developed countries did not return to FDI growth in 2010. UNCTAD’s latest estimates show that FDI flows to this group of economies fell some 7% to $527 billion, despite the robust recovery in some countries. Most notably, FDI in the United States surged by more than 40% over 2009 levels, an increase worth $56 billion, the single biggest increase in FDI among the major economic regions. This rise is largely due to a significant recovery in reinvested earnings of foreign affiliates. Europe stood out as the subregion where flows fell most sharply, explained largely by two groups of countries. First, the Netherlands and Luxembourg saw significant declines. Negative FDI flows in the former country were caused by more volatile flows related to transactions of financial affiliates. Second, uncertainties about sovereign debts caused drops in FDI, with the largest impacts seen in Ireland and Italy (Greece and Spain are less significant FDI recipients). FDI in the region’s major economies (France and Germany) fell only slightly. Within the group of developed countries, declining FDI flows were also registered in Japan due to a number of large divestments (e.g. Liberty Group, Ford). Developing countries: the recovery has started FDI flows to developing economies rose some 10% to $525 billion in 2010, thanks to a relatively fast economic recovery and increasing South–South flows. The value of cross-border M&As doubled – an increasingly important mode of FDI entry into developing countries. Behind this general increase lie significant differences: while Latin America and South, East and South-East Asia experienced strong growth in FDI inflows, West Asia and Africa continued to see declines (table 2). Inflows to Africa, which peaked in 2008 driven by the resource boom, appear to continue the downward trend of the previous year. For the region as a whole, UNCTAD estimates show that FDI inflows fell by 14% to $50 billion in 2010, although there are significant regional variations. While the downward trends of inflows to North Africa appear to have stabilized, in sub-Saharan Africa, inflows to South Africa declined to barely a quarter of the 2009 level, contributing to the large fall of FDI inflows in the subregion. Cross-border M&As, 4
  • 5. 1 mainly in extractive industries, registered an increase of 49%, while the number and value of greenfield projects − normally the main mode of FDI in Africa − suffered a decline of about 10% in 2010. The rise of FDI from developing Asia and Latin America to Africa was not yet enough to compensate for the decline of FDI from developed countries which still account for the lion’s share of inward FDI flows to many African countries. Thanks to its position as a leader of the global economic recovery, FDI flows to South, East and South- East Asia have picked up markedly, outperforming other developing regions. After a 17% decline in 2009, inflows to the region rose by about 18% in 2010, reaching $275 billion, due to booming inflows in Singapore, Hong Kong (China), China, Indonesia, Malaysia and Viet Nam, in that order. FDI flows (in the non-financial sector) to China, for example, reached more than $100 billion. Breaking this general upward trend, South Asia experienced a 14% drop in FDI, mainly due to declines in flows to India. FDI flows to West Asia, at $57 billion, continued to be affected by the global economic crisis, despite the steady economic recovery registered by the economies of the region. Sizeable increases in government spending by oil-rich countries helped push their economies forward, but conditions in the private sector remained subdued. The picture varies by country, with inflows to the United Arab Emirates rebounding modestly from the relatively low values of 2009, to little change in performance for Lebanon, to a drop in Saudi Arabia due in part to foreign investors pulling out of or freezing large refinery projects (ConocoPhillips, Dow Chemicals). A surge in cross-border M&As is the main factor explaining the significant increase in FDI flows to Latin America and the Caribbean, which attained the level of $141 billion. Compared with negative values in 2009, M&As reached $32 billion in 2010, nearly reaching the high values registered in the region during the 1990s. The targets of these deals were mainly in the oil and gas, metal mining and food and beverages industries. Strong economic growth, spurred by robust domestic and external demand, good macroeconomic fundamentals and higher commodity prices, explain the quick recovery of FDI flows to the region. Nearly all the big recipient countries saw inward flows increase, with Brazil remaining the largest destination for the fourth consecutive year. Transition economies: a halt to the decline The transition economies of South-East Europe and the Commonwealth of Independent States (CIS) registered a marginal increase in FDI inflows, of roughly 1%, in 2010 to $71 billion, after falling more than 40% in the previous year. FDI flows to South-East Europe continued their decline with a further negative 31% due to sluggish investments from European Union countries (traditionally the dominant source of FDI in the subregion). In contrast, the CIS economies saw flows increase by 5% on the back of stronger commodity prices, a faster economic recovery and improving stock markets. Foreign investors in the Russian Federation are increasingly targeting the fast growing local consumer market (the deal agreed by PepsiCo to buy Russian juice and dairy company Wimm-Bill-Dann for $3.8 billion is emblematic). Diverging patterns in FDI components and modes of entry Stagnant FDI flows in 2010 were accompanied by diverging trends in the components of FDI flows (equity, intra-company loans and reinvested earnings) and by modes of entry (M&A and greenfield investments). Improved economic performance in many parts of the world and increased profits of foreign affiliates, especially in developing countries, lifted reinvested earnings to nearly double their 2009 level (figure 3). This increase compensated for the decline in equity capital flows (down slightly despite an up-tick in cross-border M&As) and in other capital flows (mainly intra-company loans) which saw a significant drop. 1 India’s Bharti Airtel acquisition of the African mobile phone networks of Kuwait’s Zain for $10.7 billion (table 3) is not reported as an addition to FDI flows to Africa since it is only a change of foreign ownership. 5
  • 6. Figure 3. Quarterly FDI inflows by components for 37 selected economies, 2007 Q1- 2010 Q4 (Billions of dollars) 600 500 400 300 200 100 0 - 100 Q1 Q2 Q3 Q4 Q1 Q2 Q3 Q4 Q1 Q2 Q3 Q4 Q1 Q2 Q3 Q4* 2007 2008 2009 2010 Equity inflows Reinvested earnings Other capital Source: UNCTAD. * Preliminary estimate. Note: Economies included are: Argentina, Australia, Austria, Belgium, Brazil, Bulgaria, Canada, Chile, Denmark, Estonia, France, Germany, Hong Kong (China), Hungary, India, Ireland, Israel, Japan, Kazakhstan, Latvia, Lithuania, Mexico, Republic of Moldova, Netherlands, New Zealand, Norway, Panama, Philippines, Poland, Portugal, Slovakia, Sweden, Switzerland, Taiwan Province of China, United Kingdom, United States and the Bolivarian Republic of Venezuela. Cross-border M&As, which typically react more quickly to changing economic conditions, jumped 37% in 2010 (figure 4), reflecting both the growing value of assets on the stock market and the increased financial capability of potential buyers to carry out such operations. International greenfield investments, however, still registered a drop in both value and number during the year (figure 4). Figure 4. Value and number of cross-border M&As and greenfield FDI projects, 2007 Q1 - 2010 Q4 (Billion of dollars and number of deals) 500 5 000 450 4 500 400 4 000 350 3 500 300 3 000 $ billion Number 250 2 500 200 2 000 150 1 500 100 1 000 50 500 0 0 Q1 Q2 Q3 Q4 Q1 Q2 Q3 Q4 Q1 Q2 Q3 Q4 Q1 Q2 Q3 Q4 2007 2008 2009 2010 M&A value Greenfield value M&As number Greenfield number Source: UNCTAD. Note: Data for value of greenfield FDI projects refer to estimated amounts of capital investment. Project value of greenfield investments has held up better since the crisis than that of cross-border M&As. While the value of M&As equalled or exceeded greenfield investment before the crisis, it is now significantly lower. 6
  • 7. Improving FDI prospects for 2011 For 2011, UNCTAD estimates FDI flows to be between $1.3 trillion and $1.5 trillion. Improved macroeconomic conditions in 2010 strengthened TNCs’ corporate profits and boosted stock market valuations. These favourable conditions coupled with rising business confidence in 2011 will help translate TNCs’ record levels of cash holdings (in the order of four to five trillion dollars among developed country firms alone) into new investments. TNCs will also face increasing pressure to make strategic investments to cement their business plans for the post-crisis period. Worldwide M&A activity (domestic and cross-border M&As combined) is also expected to rise further in 2011. The current overall favourable policy climate for foreign investors further supports the positive prospects for FDI flows in 2011. Clearly, a number of risks to this positive scenario persist. Worldwide GDP growth, after the “recovery-boost” in 2010, will slow down. In addition, risks related to currency volatility, sovereign debt and investment protectionism could still derail the expected FDI upturn. A strong global FDI recovery depends much on the steady economic and FDI recovery of the developed economies. Table 3. Cross-border M&A deals with a value of over 3 billion in 2010 Value Industry of the acquired (Ultimate) acquiring Ultimate acquiring Acquired company Host economy ($ million) company company nation First quarter 7 603 Solvay Pharmaceuticals SA Pharmaceutical preparations Belgium Abbott Laboratories United States Cable and other pay televis ion Unity Media GmbH Germany Liberty Media Corp United States 5 195 services Radiotelephone Egyptian Co for Mobile Services Egypt France Telecom SA France 4 469 communications Cable and other pay televis ion Liberty Global Inc- Subsidiaries United States KDDI Corp Japan 4 000 services Kraft Foods Inc-North American Frozen specialties, nec United States Nestle SA Switzerland 3 700 Pizza Bus iness Springer Science+Business Media Books: publis hing, or Germany Group of Investors Guernsey 3 363 Deutschland GmbH publishing & printing Second quarter Candy and other confectionery Cadbury PLC United Kingdom Kraft Foods Inc United States 18 769 products Radiotelephone Zain Africa BV Nigeria Bharti Airtel Ltd India 10 700 communications Radiotelephone T-Mobile(UK)Ltd United Kingdom France Telecom SA France 8 496 communications Fomento Economico Mexicano SAB Malt beverages Mexico Group of Investors Netherlands 7 325 de CV-Beer Operations Radiotelephone Russian ZAO Kyivs tar GSM Ukraine Vimpelkom 5 516 communications Federation Republic of Venezuela-Carabobo Crude petroleum and natural Venezuela Group of Investors India 4 848 Block gas 4 031 OSI Pharmaceuticals Inc Pharmaceutical preparations United States Astellas Pharm a Inc Japan Bunge Participacoes e Soybean oil mills Brazil Vale SA Brazil 3 800 Investimentos SA Radio & TV broadcasting & Tandberg ASA Norway Cisco System s Inc United States 3 426 communications equipm ent Tommy Hilfiger Corp Men's s hirts and nightwear Netherlands Phillips-Van Heusen Corp United States 3 160 Crude petroleum and natural Bridas Corp Argentina CNOOC China 3 100 gas Third quarter Radiotelephone Brasilcel NV Brazil Telefonica SA Spain 9 743 communications 9 018 Lihir Gold Ltd Gold ores Papua New Guinea Newcrest Mining Ltd Australia Laboratory analytical Millipore Corp United States Merck KGaA Germany 6 127 instruments 5 959 Sybase Inc Prepackaged Software United States SAP AG Germany 4 931 Ratiopharm International GmbH Pharmaceutical preparations Germany Teva Pharm Inds Ltd Israel Mechanical power transmis sion Tomkins PLC United Kingdom Onex Corp Canada 4 380 equipment, nec Motor vehicle parts and Denway Motors Ltd Hong Kong, China GAIG China 4 110 accessories AXA SA-Life Assurance Life insurance United Kingdom Resolution Ltd Guernsey 4 052 Busines s,UK Valeant Pharm aceuticals Pharmaceutical preparations United States Valeant Pharmaceuticals Canada 3 717 International Inc Piramal Healthcare Ltd- Healthcare Pharmaceutical preparations India Abbott Laboratories United States 3 713 Solutions Business Abertis Infraes tructuras SA Highway and street construction Spain CVC Capital Partners Ltd United Kingdom 3 679 3 330 Interactive Data Corp Information retrieval services United States Interactive Data Corp SPV United States Crude petroleum and natural Arrow Energy Ltd Australia Royal Dutch Shell PLC Netherlands 3 164 gas Crude petroleum and natural BP PLC-Permian Basin Assets United States Apache Corp United States 3 100 gas Fourth quarter EDF Energy PLC-UK Power Electric services United Kingdom Group of Investors Hong Kong, China 9 056 Dis tribution Business 7 625 E.ON US LLC Natural gas distribution United States PPL Corp United States Crude petroleum and natural Repsol YPF Brasil SA Brazil Sinopec Group China 7 111 gas Automobiles and other motor Pors che Automobil Pors che Holding GmbH Austria Germany 4 540 vehicles Holding SE 4 517 Pactiv Corp Plas tics foam products United States Rank Group Ltd New Zealand 3 397 HS1 Ltd Railroads, line-haul operating United Kingdom Group of Investors Canada 3 374 Andean Resources Ltd Gold ores United States Goldcorp Inc Canada General Growth Properties Inc Real es tate inves tment trusts United States Brookfield Asset Mgmt Inc Canada 3 270 Radiotelephone Sunrise Communications AG Switzerland CVC Capital Partners Ltd Luxembourg 3 269 communications BP PLC-Western Canadian Crude petroleum and natural Canada Apache Corp United States 3 250 Ups tream Gas Assets gas Computer integrated systems Nippon Telegraph & Dimens ion Data Holdings PLC South Africa Japan 3 119 design Telephone 3 090 Intoll Group Inves tment offices, nec Australia Canada Pension Plan Canada Functions related to depos itory RBS WorldPay United Kingdom Group of Investors United States 3 019 banking, nec Source: UNCTAD. 7
  • 8. The next issue of UNCTAD’s Global Investment Trends Monitor will be released in mid-April 2011. The next issue of UNCTAD’s Investment Policy Monitor will be released in the last week of January 2011. 8