SlideShare una empresa de Scribd logo
1 de 33
Coaching Young Drivers in a Second Phase Training
                                      Programme
                  Erik Roelofs, Jan Vissers, Marieke van Onna, Gerard Kern

           Cito, National Institute for Educational Measurement, The Netherlands

                           DHV group, Amersfoort, The Netherlands

               Regional Agency for Traffic Safety Gelderland, The Netherlands


Introduction

During the first six to twelve months of solo driving, young novice drivers experience the

most dangerous phase of their driving career: their accident risk reaches a peak by then. This

is why several European countries have introduced obligatory second phase training

programmes. Other European countries provide these training programmes on a voluntary

basis. A recent evaluation of the Austrian model (Gatscha and Brandstaetter, 2008) showed

that the number of personal injury accidents among 18-year-old novice drivers was reduced

with 28 per cent in all regions of Austria after the introduction of the obligatory second phase

system.

      Several studies stress that the content of second phase driving programmes should not

be restricted to lower level vehicle control skills. Moreover, concentrating on the lower

vehicle control skills can even be counterproductive (Glad, 1988). Instead, second phase

driving programmes should rather address driving style variables which refer to the way that

people choose to drive (Elander, West and French, 1993; McKenna, 2009), which can be

explained by the way drivers make decisions on the level of life tasks and on the strategic,

tactical and operational levels of driving tasks.

      In a literature review Helman, Grayson and Parkes (2010) driving style variables on the

strategic and participation level of driving tasks that are associated with collision risk are
reviewed: speed choice, close following of vehicles in front, high-risk overtaking, violation

of traffic laws and engaging in distracting activities, such as speaking on mobile phones

while driving.

      Factors on the lifestyle level, such as fatigue-related factors (Groeger, 2006; McKenna,

2009), and alcohol use, themselves fall outside the driving domain, but are associated with

collision risk. Groeger (2006) points out that fatigue is especially relevant for very young

new drivers, since their lifestyle – often involving extensive weekend and evening socializing

– does not support good sleep hygiene.

      The awareness of these factors, the readiness and the ability to take them into

consideration before and during driving involve higher order skills on the part of the young

driver, as elaborated in the Goals of Driver Education matrix (Hatakka, et al., 2002). Among

these skills are self-reflection and awareness of emotions during driving. The purpose of

second phase training programmes is to further develop higher order driving skills that appear

to play an important role in the reduction of one´s accident risk.

      As in other educational areas, scholars stress that development of complex higher order

skills should involve increased levels of self-regulation. Although varying approaches may

stimulate self-regulation on the part of the learner, there is consensus about the idea that some

form of coaching is likely to be effective. For driving instructors who use direct instruction

and immediate feedback as a dominant method of training, this shift towards coaching

requires a role shift. The driving instructor becomes a driving coach.

      Drawing from the field of educational psychology coaching can be described as

stimulating and supporting self-regulated learning (Boekaerts, 1999; Butler and Winne,

1995). Coaching interventions are expected to stimulate and support cognitive, meta-

cognitive, and affective learning activities (Perry, 1998; Perry, et al., 2004; Shuell, 1993;

Winne and Hadwin, 1998). Cognitive learning activities pertain to the cognitive activities that

learners employ to process relevant task information that contribute to the realization of
learning outcomes in terms of changes in learners’ knowledge base and skills. Affective

learning activities pertain to coping with emotions that arise during learning and that lead to a

mood that may either facilitate or impair the progress of the learning process. Meta-cognitive

activities pertain to thinking activities that learners employ to regulate their learning process.

These include a) the choice of personal learning objectives, the pace and course of the

learning process, and its learning contents, b) the monitoring of learning activities, c) the

evaluation of the outcomes and d) the changes in the regulation aspects that follow from

evaluations (Vermunt and Verloop, 1999).

      Typical coaching interventions that are employed to stimulate and support the learning

process are asking questions and providing feedback on learning activities as employed by

the learner. Using these interventions, the educator makes learners aware of the adequacy,

efficiency, and effectiveness of learning activities (Boekaerts and Simons, 1995; Butler and

Winne, 1995). The ultimate goal of coaching is to foster self-regulated learning (SRL) In

practice, not all learners possess the necessary regulation skills for SRL and need a more

balanced approach between educator-led and learner-led regulation. Questions and feedback

utterances during coaching may therefore vary from extremely open to very structured.

Providing clues, hints, advice, and examples constitute coaching interventions with a high

degree of educator regulation. From a Vygotskian point of view, which was adopted by the

authors in constructing a driver coaching programme, competent coaches provide just enough

support in order to enable students to make the step to the next higher level in employing a

learning activity, which they could not have made on their own (Vygotski, 1978). As the

performance of a learning activity improves, the support of the educator should decrease until

the student can perform the learning activity independently. This is referred to in the

literature as ‘fading’ (Collins, Brown, and Newman, 1989).
Recently, within the field of driver training, principles of coaching have been defined,

which closely resemble the recommendations from educational psychology (Bartl, et al.,

2010). Coaching:

           •   puts the learner in an active role;

           •   builds on the prior knowledge and experience of the learner;

           •   encourages the learner to identify his/her goals and to meet these goals;

           •   raises the awareness, responsibility and self-acceptance of the learner;

           •   raises awareness of the learners’ values, goals, motives and attitudes as well as his sensations and

               emotions, knowledge, skills and habits;

           •   addresses the learner’s internal obstacles to change.


     As coaching builds on the learners’ awareness of their learning progress, a relevant role

can be played by assessments for learning (AFL). AFL are used to inform and support the

learner and their educators about their levels of (driving) competence, and the underlying

performance aspects that need further attention. By using the results of these assessments,

subsequent coaching may be tailored to the learner drivers’ specific needs (Stiggins, 2002).

     To facilitate higher order level learning in driving, formative assessments should go

beyond traditional assessments aimed at isolated testing of knowledge about traffic rules and

technical driving skills. Fitting in with the approach as described above, formative

assessments need to: a) address critical elements of the driving task and its circumstances as

they appear in daily driving and throughout the driving career; b) fit in with the stage of

development of the (learner) driver, c) be informative about various mental processes.

     The current study focused on a Dutch second phase coaching programme that was

developed as part of the EU-project ‘Evaluation of post-licence training schemes for novice

drivers’ (NovEv; Sanders and Keskinen, 2004). The programme, entitled ‘The Drive

Xperience’, was based on recommendations from recent literature on the coaching of young
drivers. Since the first introduction of the programme in 2003, it has been updated and

evaluated on a continuous basis (Vissers, 2006).

      In this study, attention was focused on a description of the participating group of young

drivers. As participation in the Dutch programme is voluntary there may be a form of self-

selection, resulting e.g. in groups of highly motivated responsible drivers or in groups with

drivers with already a rich accident history. For the programme to be successful in addressing

the target group, it aims to attract a representative group of young drivers, who are in need of

various forms of extra insights into their driving styles. The main research questions of this

study entail:

            1.   To what extent does the programme address the envisioned target group?

            2.   To what extent does the design and content of the coaching programme address the driving

                 characteristics of the participating young drivers?


      In order to determine the fit with the target group, the driving characteristics of

participating young drivers in ‘The Drive Xperience Programme’ were compared with a

Dutch reference group of young drivers. Also comparisons were made with characteristics of

experienced drivers who drive in leased cars and who are sent to an advanced driver training

programme, because of their unfavourable driving history.

      More specifically, the following research questions will be addressed:

            •              What are the driving characteristics of young drivers enrolled in a programme for coached

                 driving in terms of their driving behaviour, their personal risk factors, and their self-perceptions

                 regarding driving proficiency?

            •              In what respects do participating young drivers differ from the average young driver, as

                 described in earlier young driver studies in The Netherlands?

            •              In what respects do young drivers differ from experienced drivers, who are enrolled in

                 advanced driver training programmes?


Method

Design characteristics of the second phase coaching programme ‘Drive Xperience’
The design principles and content of the Drive Xperience (DX) programme second phase

coaching programme were drawn from different sources of research, which are described

below.

GDE-matrix: task levels of driving      Throughout the training programme the GDE matrix

(Hatakka et al, 2002) is used as a conceptual framework for all learning experiences. During

discussion about driving styles, it is emphasized that the actual quality of participation in

traffic situations is influenced by decisions on higher level tasks. These include life tasks, e.g.

socializing with peers, recreating, working, and strategic tasks, e.g. choice of transportation

mode, and route decisions.

Driving as a serious task, involving complex task processes         The idea is that at all levels

car, driving needs to be considered as a serious task, in which various aspects need to be

considered simultaneously: the state of the driver, passengers, baggage, presence of other

participants, weather road conditions and so forth.

      Besides, drivers often carry out competing (life level) tasks which can seriously impede

the quality of the driving task execution: e.g. phoning, talking, mental preparation for work,

being angry with other drivers. In the training programme coaches will consider driving as a

cognitive/affective decision making process, during which the driver (ideally verbally) needs

to reflect on his/her own decisions, actions and consequences as depicted in figure 1.


[Insert Figure 1]


      The model, which is used in simplified form, offers a thinking tool for the young driver

during coached trips. During the preparation programme, coaches use the model when

reflecting on explanations of driver behaviour, located inside or outside the driver (referred to

as ‘basis’ and ‘traffic situation’ in the model).
Balancing task complexity and level of proficiency                      One of the problems with young

drivers is that they often fail to safely adapt their choice of traffic situations to their level of

proficiency (Fuller, 2005; De Craen, 2010). Due to a lack of driving experience and to an

inadequate self-assessment of own proficiency young drivers choose to engage in traffic

situations they do not have mastery of yet.

      In the coaching programme young drivers are supported to search for a balance

between their own level of proficiency and the complexity of the traffic situations they

engage in. Disturbance of this balance may cause hazardous situations. Keeping a surplus of

proficiency (in terms of time and space for actions) is considered essential. Task complexity

is addressed in two ways during the young driver coaching programme.

      First, driving coaches are encouraged to choose routes consisting of traffic situations

with varying degrees of complexity, but that never overtax the young driver. By choosing

critical situations where proficiency and task complexity begin to show imbalance, young

drivers become aware of their learning needs. Second, the factors that cause task complexity

and imbalance are discussed during the trip. Borrowing from error-taxonomy studies (Stanton

and Salmon, 2009) critical task environmental attributes are addressed that hamper or

facilitate the driving process in the following way:


            •     Perception/comprehension: This process is hampered by sight obstruction, camouflage, hearing

                obstruction, and discontinuous traffic environment. E.g. a hedge blocking the side view at a crossing;

                unreadable road signs, temporary reduction in the numbers of lanes;

            •     Decision making: This process is hampered by other participants who arrive at the scene at the same

                time, or by reduced time and space to carry out actions. E.g. complex crossroads with many different

                participants, lanes reduced in width, narrow and winding roads.

            •     Action execution: This process is hampered by reduced space, and road or weather conditions

                hindering vehicle control. E.g. wet road surface, snow, cross winds, high gradient percentage.
Referring to different GDE task levels some of the outcomes of the discussions could

be to avoid driving at certain hours of in certain conditions, to take an alternative route

(strategic level) or to reduce speed earlier (tactical level). Discussions about driving

behaviour are facilitated by the use of observation assignments for passengers, who are not

behind the wheel (see next section).


Criteria for driving proficiency       The ultimate goal of the coaching programme is that

young drivers make responsible decisions in traffic tasks at all GDE task levels. To determine

the quality of driving behaviour, coaches are encouraged to pay attention to five inter-related

criteria of driving performance (Roelofs, et al., 2010): 1) Safety: The driver’s ability to solve

traffic situations in such a way that time and space are available for all participants to carry

out driving activities without conflicting or colliding with objects or others. Indicators are

awareness of the situation, correct timing of actions, adapting speed and using “space

cushions”; 2) Facilitating traffic flow: The ability to drive in a way that does not impede the

progress of other road users, and helps an optimal flow of traffic; 3) Consideration with other

road users: The ability to give others opportunities to fulfill their tasks, or to adapt to their

mistakes, without showing aggression or irritation; 4) Controlled driving: Steering and

controlling the car smoothly, without stutters and jerks or departures from smooth lines. 5)

Environmentally-responsible driving: Driving in such a way that emissions of harmful gases

and noise levels are kept to a minimum and that optimal use of fuel is achieved.

      These criteria, with an emphasis on safety, form the basis of discussions about traffic

behaviour. In addition, these criteria are addressed in the web-based assessments for learning

which participants go through as a preparation for the coaching programme.


Overview of the second phase coaching programme

Figure 2 gives a schematic overview of the DX programme.
[Insert figure 2]

      During a pre-test period of four weeks before the start of the training programme the

participants were asked to complete two web-based assessments: The Driver Risk

Assessment and the Driver Self-Assessment. These assessments result in an individual driver

profile for the participant. The individual profiles are also accessible for the driving coaches

and are used for tailoring the training content to individual learning needs and for reflective

purposes on the part of the young drivers. Participating young drivers use the outcomes to

arrive at personal learning objectives for the coached trip. For instance, speed or distraction

may have turned out to be risk factors for a participating young driver.


            •     The driver coaching programme takes place during one day and consists of three parts:

            •     Coached trip: The main objective of the coached trip is to present the driver with feedback about his

                ‘everyday’ driving performance.

            •     Track experience: The main objective of the track experience is for participants to experience the

                limits of their skills in vehicle control and to share these experiences with other group members.

            •     Group discussion: The main objective of the group discussion is to stimulate recognition of

                potentially hazardous situations in rather 'normal' driving situations. Risks of alcohol use and other risky

                driving behaviors are discussed.


      During the coached trip the principles of coaching individual drivers are elaborated in

detail. The trip takes approximately one hour per participant. The driving coach is expected to

choose a route that addresses the specific needs of the young driver. During a 15 minute pre

trip discussion the young drivers and their coaches determine the routes to be taken. In

addition, observation points are chosen by which parts of the trip can be reviewed and

discussed in a non-threatening way. During the trip the young passengers are asked to mark

all observed interactions with other participants in terms of their experienced degree of

comfort, discomfort or even fear (figure 3).
[Insert figure 3]


      At two points the trip is paused to enable a discussion about what has happened during

the trip. First the driver gives his/her own impressions. Then the passengers give their notes

and the driver reacts to them. In this conversation the coach asks clarifying questions and

elicits better solutions by building on the passengers’ and the drivers’ responses. Trends in

driving behaviour are notified, e.g. using big/small space cushions towards other traffic

participants, or scanning timely or too late for the changes in the traffic situations.

      During the trip the coach is expected to give suggestions for changes in the route to

enable the driver to drive in situations that are relevant to his or her personal objectives.

      After the second stop the strong points and the points to improve are reviewed after

which the participants change places, and the previous passenger now drives. At the end of

three trips the young drivers are asked to write down the most important points on which they

want to improve themselves in the near future.

      During a post-test period of four weeks after the programme the participants are

expected to complete a third web-based assessment, the Situation Awareness Test. This

assessment also yields a feedback report which may give additional information about points

to be developed (see section below).


Instrumentation

In this study data from three draft instruments aimed at informing drivers about their risk

profile and their driving behaviour were employed. The instruments were administered

during the coaching programme as described above. At the same time the data were used to

give a detailed description of the participants in terms of the factors and behaviours

mentioned above. As the instruments have also been administered to experienced drivers
(driving in leased cars) enrolled in driver training programmes, comparisons can be made

between young (inexperienced) drivers and older (more experienced) lease car drivers.


Driver Risk Assessment questionnaire          The Driver Risk Assessment is a web-based

questionnaire consisting of 119 questions regarding the driver history and the drivers’

behavioural risk factors. Personal background variables pertain to age, gender, and years of

driving experience. The questions regarding driving history refer to mileage and to the kind

and variety of traffic situations to which the driver is exposed: e.g. driving during rush hours,

on various road types, or driving during weekend nights. In addition, questions are posed

about the number of active and passive accidents the driver was involved in during the past

three years and the number of fines received for various reasons the past year.

      Questions regarding behavioural risk factors pertain to the following topics: speed

choice under various conditions, lane preference on motorways during various traffic

conditions, alcohol use and driving, the use of adversary alcohol strategies in combination

with driving, anger in reaction to others participants’ violations, distraction and fatigue. Most

of the behavioural questions ask for a response on a Likert scale, where each scale point

represents a behavioural option (e.g. speed choice: ‘between 120-125 km/h’, ‘between

125-130 km/h; anger: ‘not angry, ‘a little angry’). Also questions with a dichotomous

response were employed (e.g. I stay calm and don’t let myself get annoyed: yes/no).

      After the participant has completed the assessment an individual score profile is

reported on 10 categories and on the total risk score expressed on a scale between 0 and 100:

age and sex, years of driving experience, mileage, fines, collisions, driving in various

situations, speed, alcohol, concentration-distraction, aggression, and fatigue. Written

feedback is displayed, of which the wording depends on the applicable score level (low risk;

moderate risk, high risk). Provisional cut-off scores for these levels of risk were determined

based on the score for the 33rd and the 66th percentile.
Driver Self-Assessment          The Driver Self-Assessment is a web-based questionnaire

consisting of 45 illustrated questions. It comprises a self-assessment of driving ability

addressing the five criteria for driving competence described above. The questions pertain to

strategic, tactical and operational behaviour choices on different road types. Each question is

accompanied by an illustrative picture, showing the essential features of the traffic situation

to which the question refers.

      An example of a safety question on strategic level is: “How often do you take a longer

route because it is safer (such as driving around rather than through a residential area)?” An

example of an item on the tactical level: “When turning right, how often do you fail to see a

cyclist/moped rider over your right shoulder?” An example of item on the operational level

is: “How often do you have to brake on a bend?” Participants respond by using a four-point

Likert-scale ranging from ‘almost never’ to ‘almost always’.

      After the participant has completed the assessment an individual profile is reported on

the five criteria mentioned above. The scores are expressed in terms of percentages of the

maximum possible score. Detailed written feedback is displayed depending on the score

category, carrying the following labels: 0-60 per cent ‘improvement necessary’; 60-80 per

cent ‘satisfactory, with room for improvement’, 80-100 per cent: ‘well done!’

Situation Awareness Test        The Situation Awareness Test (SAT) intends to assess the

degree in which the driver is aware of changes in traffic situations. The development is

described in Roelofs et al., (2008). During its administration the test was still under

construction, implying that part of its items could be left out of the test for psychometric

reasons.

      The SAT consists of 40 traffic scenarios displayed as video clips during test

administration. Each item starts with a video clip showing a driver activity during a critical
traffic situation from the driver perspective. Four types of questions with different responses

are employed: recollection, decision making, localizing hazards, and timed response.

       The recollection items refer to the recall of a change in the traffic situation which

includes a possible hazard on which should be responded to solve the situation safely. After

the video clip freezes, two types of multiple choice questions can be asked. The first question

type measures to what extent the driver has noticed a signpost or signal by asking about the

consequences (how fast are you allowed to drive?) The second type asks if a specific

behavioural choice can safely be made in a complex traffic situation (can you turn right

safely now?). The decision items require the driver to select the most appropriate risk-

avoiding solution for that moment. After the scenario freezes, the driver is asked to select the

best behaviour option at that moment. The localizing items ask the subject to mark the spot

on the screen (the frozen traffic situation) where immediate attention is required. Finally,

timed response items require the subject to choose the optimal moment for carrying out a

risk-avoiding manoeuvre, leaving a maximum of space to carry out driving activities. The

video clip is shown twice. In the first viewing, the participant is asked to observe the overall

situation. They are told what type of risk avoiding manoeuvre is to be carried out. During the

second viewing, the participant clicks on the screen at the moment they intend to carry out

the manoeuvre. After the participant has completed the assessment, an individual score

profile is reported on the four item types and on the total test score in a similar way as the

DSA:

Participants

For this study data were used from two groups: young drivers enrolled on the young driver

second phase coaching programme and lease car drivers enrolled on advanced driver training

programmes.

       The young drivers group (n=1247) participated in a total of 43 training groups in the

period between August 2010 and June 2011 (mean group size: 29) and consisted of 671 male
and 576 female subjects. This distribution is representative of the Dutch population. The

participants had held their driving licence between six months and two years. They were aged

between 18 and 24 years. Their average mileage 7398 kilometres, which is almost equal to

the average Dutch young driver.

      The group of lease car drivers (n=922) came from 31 companies that sent their

associates to advanced driver training in small groups. The lease car drivers differ in terms of

age and gender composition from the average Dutch population of drivers. The former group

is relatively younger (80 per cent is younger than 45 versus 53.4 per cent for the population),

has fewer years of driving experience (37 per cent less than 10 years versus 22.5 per cent)

and contains more men (79 per cent versus 56 per cent).

      To enable comparison with a reference group of young drivers several analyses were

performed on a database containing data from a large-scale survey using representative

samples of the Dutch population (PROV). This survey has been carried out almost yearly

since 1990 (Eversdijk et al., 2000) until 2005. For purposes of comparison only the most

recent data (2005) were used (n=345), since traffic safety figures have changed considerably

since 1990.


Data analyses

For the purpose of the description of the young drivers and lease drivers in this paper the

assessment instruments were further refined. Principal Component Analyses (PCA) and

reliability analyses were carried out on the responses to items from the three draft

instruments. For the Driver Risk Assessment there were only minor changes in the ordering

of subscales compared to the scales that were used to inform the drivers. For the Driver Self-

Assessment the analyses resulted in a subscale ordering that differs considerably from the

original subscales in terms of the five performance criteria, as used for purposes of feedback

to the participants. Regarding the Situation Awareness Test, only the scale ‘localizing’
reached a satisfactory level of reliability. Data on the other subscales are therefore not

reported. In the next section the results for the subscales as found in the analyses are reported.

Criteria for inclusion in a subscale were: a high loadings on a principle component after a

PCA; b) an item correlation of at least .25 in the reliability analysis.

      The young drivers, the lease car drivers and the young driver reference group were

described by means of descriptive statistics. Differences in group means were tested by

means of one-way analyses of variance. Differences in cell proportions in crosstabs were

tested by means of chi-square tests.


Results

In the forthcoming tables the participating groups of young drivers are characterized in terms

of their driving behaviour, their risk profiles, their self-images related to safe driving and

their levels of situation awareness.


In which situations do young drivers drive?

Young drivers regularly drive during rush hour and on motorways (means 2.9, 3.3, see Table

1). They relatively often drive on roads outside built-up areas which have no separated lanes

(mean 3.8), and which serve participants with different speeds and vehicle masses. In

addition, young drivers regularly drive in the town centre of a big city (mean 3.0). Finally,

they sometimes drive during weekend nights (mean 2.4; about once a month). Lease car

drivers drive (significantly) more often in the situations mentioned (t-values 13.7, 12.9, 2.1,

11.7 and 3.9 respectively; df= 689; all significant at the .01 level).
[insert Table 1]


Accidents and fines

Table 2 shows the accident risk expressed in the average number of accidents and fines per

one million kilometres. Not all participants had completed their annual mileage and accident

report. The participants reported their accidents during the last three years, whereas in the

PROV study it was asked each year. The reported number of accidents was corrected for the

number of years and then related to mileage. The young drivers who participated in the

coaching programme only had their licence for a maximum of two years. Since no precise

information was available about the time they held their licence, this period was assumed to

be two years, which is a very conservative estimate. In order to gauge the robustness of the

results, the analyses were also performed assuming a one-year period for the PROV reference

group. Seventy-four drivers reported driving 1000 km at the most. Since the extrapolation of

their results to one million kilometres seemed unreliable, the results of the reference group

are also presented without these low-mileage drivers.


[Insert Table 2]


       The average mileage for the young driver coaching group was significantly lower than

for the PROV reference group (t=-2.6, df=612, p=.01). The lease car drivers had a higher

average mileage than both young driver groups. Both young driver groups had higher

accidents risks than lease car drivers, both for accidents where the driver was legally liable

(active accidents) and for accidents where the other driver involved was legally liable

(passive accidents). The risk for fines was higher too. Even with the conservative estimate,

the young driver training group seemed to have higher risk for active accidents than the
reference group, when excluding the low-mileage drivers (28.2 versus 23.4). However, a t-

test for independent samples did not yield significant results.

       Since the data concerned frequency data on a fixed number of kilometres that were

skewed to the right, a Poisson model was appropriate for testing the null-hypothesis that the

active accident rates in both groups are equal. This hypothesis was rejected (χ2= 119.4, df = 1,

p<.01). The passive accident rate did not differ significantly between the young driver

coaching group (conservative estimate) and the reference group, excluding the low-mileage

drivers (χ2= 1.9, df=1, p=.17). The young driver coaching group had a lower fine rate than the

reference group, excluding the low-mileage drivers (χ2= 253.8, df=1, p<.01). However, in the

less conservative estimate, assuming an accident report period of one year only, the fine rate

for the young driver coaching group is significantly higher than the fine rate in the reference

group, excluding the low-mileage drivers (χ2= 1931.4, df=1, p<.01).


[Insert Table 3]

Risk factors

Table 3 shows results regarding behavioural risk factors as measured by means of the Driver

Risk Assessment. The participating young drivers sometimes drink alcohol (mean .39) and

they do not differ in this respect from the lease car driver (mean = .42). They rarely combine

alcohol with driving a car, as can be observed form the mean score on the scale ´use of

adversary alcohol strategies (mean: = .05). This scale consists of questions whether the

participant combines drinking alcohol with driving and a series of questions about well-

known but adversary strategies to minimize the effects of alcohol once the participant finds

themselves at places where alcohol is served. E.g. pretending to drink alcohol, wait for a

while before taking the next alcoholic drink, wait a while before driving home, taking a long

time for a drink. Lease car drivers occasionally combine alcohol and driving, including the

use of the adversary strategies (mean = .33)
A next risk factor, loss of concentration rarely occurs with young drivers (mean: = .09).

This scale refers to situations in which drivers are unconscious about the route they have just

driven, or are distracted because they were thinking about something, or appear surprised by

sudden maneuvres of other participants.

      The questions regarding anger referred to the drivers’ reaction on other participants’

violations or deviating driving behaviour. In terms of anger the young drivers very often stay

calm (mean: = .75). Reactions of withheld anger occur rather often (mean = .55). Irritated

reactions towards other participant occur occasionally (mean: = .18). Seriously angry

reactions occur very rarely (mean: = .02). In terms of anger, young drivers do not differ from

lease car drivers. The differences are insignificant. Available data from the PROV reference

group show that average young drivers react less frequently with irritation (t = 2.5; df = 612;

p <.01) and withheld anger (t = 5.2; df = 612; p <.01) than young drivers participating in the

coaching programme. The data on staying calm were not comparable, due to different

wordings in the questionnaire employed in both studies.

      A fourth risk factor is speed and lane preference. Based on the preferred speeds as

reported by the participants, a scale was constructed for the degree in which speed limits are

violated. A higher proportion means that participants violate the limits on a greater number of

different road types (50km, 80km, 120 km limits) and to a greater extent (e.g. ‘maximum 120

km/h’, ‘120-125 km/h’ up to ‘over 150 km/h’). On average young drivers say they rarely

violate the limits (mean: = .14) and even less frequently than lease car drivers (mean: = .17; t

= -5.2; df = 689; p < .001). Under favourable weather and road conditions young drivers

occasionally violate speed limits (mean: = .23). The difference with lease car drivers (mean:

= .26) is significant (t = -2.3; df = 689; p < .05). Under favourable conditions young drivers

more often violate the speed limits than the PROV young driver reference group (means: = .

23 and .20 respectively; (t = 2.1; df = 612; p <.05).
Regarding lane choice, both young drivers and lease car drivers sometimes choose the

outer lanes on the motorways (means: = .33 and .39 respectively). Lease car drivers do this

more often (t = -3.0, df = 689; p < .05) than young drivers.

      The final risk factor pertains to fatigue. The questions asked whether the driver has

experienced problems keeping their eyes open, if they have had micro sleeps during driving,

if they have had less hours of sleep than needed, and if they have been driving at night

without having rested during the day. The scores on this scale suggest that on average young

drivers rarely experience the problem of fatigue while driving (mean: = .09). Lease car driver

experience fatigue a little more frequently (mean: = .11, t = -2.0, df = 689, p < .05).


[Insert Table 4]


Self-Assessment of driving proficiency

In Table 4 the results on the Driver Self-Assessment (DSA) are summarized. The DSA was

administered from the start of the young driver coaching programme to 1226 participants.

      A PCA performed on the DSA data resulted in a different ordering into four subscales

that differ from the subscales that are usually reported for the young drivers during the

coaching programme. The first scale consists of 12 items which address errors that affect

traffic safety (failure to scan for other participants, following too close, braking too late),

traffic flow (blocking other traffic at crossroads or causing others to wait), and vehicle

control (errors when braking, using gears, drifting when operating car equipment). On

average, young drivers occasionally commit errors (mean: = .21) that affect the criteria

mentioned above. They do not differ significantly from lease car drivers in this respect

(mean: = .17).

      The second scale can be labelled as ‘driving in a hurry’. Subjects are asked whether

they really ‘step on the gas’ and drive faster than the speed limits. Young drivers sometimes
drive in a hurry (mean: = .36) and do not differ significantly from lease car drivers in this

respect (mean: = .32).

      The third scale pertains to feelings of irritation caused by other participants’ driving

behaviour (driving errors and driving too slow). Young drivers report that they rather often

feel this irritation (mean: = .64). They report this irritation significantly more frequently than

lease car drivers (t = 12.7, df = 1804; p < .001).

      The overall scale ‘Perceived quality of one’s own driving behavior’ consists of 43

items. Two items have been left out because of a low item-rest correlation coefficient. The

negatively formulated items of the first three subscales were reversed. The scale can be

interpreted as the degree to which the driver reports a safe, flow-aiding, social, controlled and

environmentally considerate way of driving. On average young drivers report that they very

often show this type of behaviour (mean: = .73). They do not differ significantly from

experienced drivers (mean: = .76) in this respect.


Situation awareness


[Insert Table 5]


Psychometric analyses on the responses to the Situation Awareness Test showed that only

one subscale reached an acceptable alpha coefficient (at least .60): ‘localizing hazards’. On

average young drivers score high on this task (mean: = 7.4 on an eight item subtest),

indicating that they are well able to localize possible hazards in a traffic scenario (see Table

5). They even perform significantly better than lease car drivers who reach a mean score of

7.1 (t = 3.0; df= 381; p < .01), which is also relatively high.


Discussion
The results of the study can be summarized in the light of the two main research questions.

The first main question addressed the issue of whether the second phase coaching programme

has attracted a representative group of young drivers in terms of their driving characteristics.

In this study, data from web-based assessments administered over the course of almost one

year as part of the DX programme were analyzed to yield a picture of the participants’

driving characteristics.

      Looking at the driving history in terms of their mileage, the relative accident risk and

the number of fines it becomes clear that participants in the programme form at least an

average group of young drivers. The organizing agency feared that the participants would be

well-educated and good drivers, but this does not seem to be the case.

      On the contrary, there are indications that the relative risks of accidents and fines are

higher than they are in a representative Dutch reference group of young drivers. The latter

group was involved in the 2005 version of the annual monitoring study into traffic safety in

the Netherlands (Eversdijk et al., 2000). In terms of the available comparable risk factors

studies, the DX participants score less favourably than the average young driver: the former

reports irritation towards other drivers, making errors and violating the speed limits more

often than the latter group.

      The second main question was to what extent the design and content of the coaching

programme had addressed the driving characteristics of the participating young drivers? In

other words, does the programme address their specific needs?

      Reflecting on this question, some observations can be made. First, DX participants find

themselves in risky traffic situations, i.e. on roads outside built-up areas and in the town

centre of a large city. While doing so, they occasionally violate the speed limits. They

sometimes choose outer lanes when driving on motorways. Taken together with the reported

relatively high accident involvement, this calls for attention to the risks of speed as is the case

in the DX coaching programme.
Second, a relatively favourable picture emerges regarding the combination of alcohol

use and driving. DX participants mostly refrain from drinking when they have to drive. Most

participants do not give in to adverse alcohol strategies, such as pretending to drink alcohol,

wait for a while before taking the next alcoholic drink, wait a while before driving home, or

drink a cup of strong coffee. Alcohol use is more of an issue for the lease car driver involved

in this study. The available data come from those who are enrolled in advanced driver

training programmes and had completed the same web-based assessments as the DX

participants.

      Fourth, DX participants often respond to certain driving situations with irritation. They

report this irritation more frequently than experienced lease car drivers. They also sometimes

find themselves hurrying through the traffic. At the same time DX participants have a rather

positive self-image of their own driving behaviour. Their self-image does not differ to a large

extent from that of the more experienced lease car drivers. Third, DX participants are very

capable of localizing hazards, as measured by the Situation Awareness Test. They even

performed better than lease car drivers.

      The tendency to drive at higher speeds than is permitted, to react with irritation towards

other drivers combined with a positive self-image may result in overestimation of the own

driving proficiency. In turn this overestimation may result in imbalances between task

demands and real proficiency, causing increased risks, and loss of control (Fuller, 2005; De

Craen, 2010). The average driving profile of DX participants matches well with the design

and content of the coaching programme. During the coached trip the participants are

encouraged to form realistic self-images. The non-judgmental peer feedback during the trip

may contribute to the forming a realistic self-image. Drivers become more conscious about

their driving activities and the immediate consequences for other traffic participants. One

participating young driver put it like this: “Indeed, some of my friends have many ‘Oops’
moments when I am driving. Now that you report five red crosses [on the feedback form] I

remember that”.

      Interest is the finding that the participating young drivers seldom showed the

undesirable combination of alcohol use and driving, and the corresponding adverse alcohol

strategies. In the most current version of the coaching programme a one and a half hour time

slot is reserved exclusively for discussion about the risks of alcohol and driving. One

recommendation following from the participants’ profiles would be to concentrate more

generally on risks of life style attributes that can account for specific problematic young

driver behaviours, such as irritation, and driving in a hurried, stressed way. Following the line

of thought in the GDE matrix the antecedents of these driving behaviours could be disclosed

and discussed. In such a way changing driving habits starts at the understanding that life-style

decisions, all day activities and driving behaviour are strongly interwoven. Although young

drivers may well be capable of participating safely when expected to do so during a coached

trip, they may not choose to do so when they are caught up in daily life activities. Part of the

performance is related to style as mentioned in the first section of this chapter (Elander, et al.,

1993). The results of this study indicate that young drivers are able to localize hazards in a

computer based test environment. The question is, whether they are both capable of and ready

to localize hazards when they are driving their own cars, in the presence of peers, with whom

they are socializing.

      This brings us to two suggestions for follow-up study. First, in this study no attention

has been paid yet to possible short and long term effects of the coaching programme on

reported and actual driving behaviour, as is recently recommended by other authors (cf.

Mynttinen et al., 2010). In the coaching programme a non-judgmental approach was used for

coaching. In a follow-up the young drivers’ styles of driving will be evaluated, employing

trained instructors who will serve as evaluators.
Second, the current study did not shed light on the implementation of the coaching

programme. In a follow-up study the focus will be on the features of the coaching

programme, which contribute to or impede changes in attitudes and driving behaviours of the

participants. Some of the questions are: To what extent do coaches regulate learning activities

and how does that affect the learning orientations of the participants? To what extent is the

approach of connecting to the zone of proximal development as proposed in the coaching

programme effective? In the follow-up study, more intrusive forms of data collection are

needed to delve into these questions and to prevent over reliance on self-reports. Direct

observations, interviews and performance assessments will be employed to sort out the

effective ingredients of coaching on young drivers, even if the effects may be indirect

(McKenna, 2010).


References

Bartl, G., et al. (2010). High impact approach for Enhancing Road safety through More

   Effective communication Skills In the context of category B driver training. EU HERMES

   Project Final Report.

Boekaerts, M., (1999). Self-regulated learning: Where we are today. International Journal of

   Educational Research, 31, 445-457.

Boekaerts, M., & Simons, P.R.J. (1995). Leren en instructie. Psychologie van de leerling en

   het leerproces (Learning and instruction. Psychology concerning student and students’

   learning process). Second edition. Assen:: Van Gorcum.

Butler, D.L., and Winne, P.H., (1995). Feedback and self-regulated learning: A theoretical

   syntheses. Review of Educational Research, 65(3). 245-281.

Collins, A., et al. (1989). Cognitive apprenticeship: teaching the crafts of reading, writing,

   and mathematics. In L.B. Resnick (Ed.), Knowing, learning and instruction: Essays in

   honor of Robert Glaser (pp. 453-494). Hillsdale, NJ: Erlbaum.
De Craen, S., (2010). The X-factor. A longitudinal study of calibration in young novice

   drivers.     Dissertation.      Leischendam:     Stichting      Wetenschappelijk       Onderzoek

   Verkeersveiligheid SWOV

Elander J., et al. (1993). Behavioural correlates of individual differences in road traffi c crash

   risk: an examination of methods and findings. Psychological Bulletin, 113 (2) 279–294.

Eversdijk,    J.J.C.,   et   al.   (2000).   PROV    1999       Periodiek   Regionaal     Onderzoek

   Verkeersveiligheid [PROV 1999: periodic Dutch regional research into traffic safety].

   Report number: TT00-66. Veenendaal: Traffic Test BV.

Fuller, R., (2005). Towards a general theory of driver behaviour. Accident Analysis and

    Prevention, 37, 461-472.

Gatscha, M., and Brandstaetter, C., (2008) Evaluation der zweiten Ausbildungsphase in

   Österreich [Evaluation of the second phase system in Austria]. Forschungsarbeiten aus

   dem Verkehrswesen. Vol. 173. Austrian Federal Ministry of Transport, Innovation and

   Technology. Vienna, Austria.

Glad, A., (1988) Fase 2 I foreoplaringen. Effect pa ultkkes riskoen. [Driver Education’s

   second phase.        Its effect    to the   accdident risk.]       Reprot No.        0015. Oslo,

   Transportokonomiskt institut.

Groeger J A., (2006). Youthfulness, inexperience, and sleep loss: the problems young drivers

   face and those they pose for us. Injury Prevention, 12 19–24.

Hatakka, M., et al. (2002) From control of the vehicle to personal self-control; broadening

   the perspectives to driver education. Transportation Research Part F, 5, 201-215.

Helman, S., et al. (2010). A review of the effects of experience, training and limiting exposure

   on the collision risk of new drivers. TRL Insight Report INS005. Bracknell (UK):

   Transport Research Laboratory.
McKenna, F. P., (2009). Can we predict driver behavior from a person’s sleep habits?

   Behavioural Research in Road Safety, 19th Seminar, 30 March–1 April 2009. London:

   Department for Transport.

McKenna, F. P., (2010). Education in Road Safety Are we getting it right? London: RAC

   Foundation.

Mynttinen, S., et al. (2010). Two-phase driver education models applied in Finland and in

   Austria – Do we have evidence to support the two phase models? Transportation

   Research Part F: Traffic Psychology and Behaviour, 13(1), 63-70.

Perry, N., et al. (2004). Examining features of tasks and their potential to promote self-

   regulated learning. Teachers College Record, 106, 1854-1878.

Perry, N.E., (1998). Young children’s self-regulated learning and the context that support it.

   Journal of Educational Psychology, 90, 715-729.

Roelofs, E.C., et al. (2008). Development of multimedia tests for responsive driving. In L.

     Dorn (ed.) Driver Behaviour and Training, Volume III (pp 251-264), Hampshire:

     Ashgate Publishing Limited.

Roelofs, E.C., at al. (2010). Development of the Driver Performance Assessment: Informing

   Learner Drivers of their Driving Progress. In L. Dorn (Ed.) Driver behavior and training,

   volume IV (pp. 37-50). Hampshire: Ashgate Publishing Limited.

Sanders, N., and Keskinnen, E., (eds.) (2004). EU NovEV project; Evaluation of post-licence

   training schemes for novice drivers. Final Report. International Commission of Driver

   Testing Authorities CIECA, Rijswijk, The Netherlands.

Shuell, T.J., (1993). Toward an integrated theory of teaching and learning. Educational

   Psychologist, 28, 291–311.

Stiggins, R. J., (2002). Assessment crisis: The absence of assessment FOR learning. Phi

   Delta Kappan, 83 (10), 758-765.
Stanton, N.A., and Salmon, P.M., (2009).Human error taxonomies applied to driving: A

   generic driver error taxonomy and its implications for intelligent transport systems. Safety

   Science, 47, 227–237

Vermunt, J.D., and Verloop, N., (1999). Congruence and friction between learning and

   teaching. Learning and Instruction, 9, 257-280.

Vissers, J.A.M.M., (2006). Evaluatie Tweede Fase Opleidingsprogramma Gelderland 2006

   [Evaluation second phase driver training programme]. Amersfoort, DHV.

Vygotsky, L.S., (1978). Mind in society: The development of higher psychological processes.

   Cambridge, MA: Harvard University press.

Winne, P.H., and Hadwin, A.F., (1998). Studying as self-regulated learning. In D.J. Hacker,

   J. Dunlosky, & A.C. Graesser (Eds.), Metacognition in educational theory and practice

   (pp. 277-304). Hillsdale, NJ: Erlbaum.
Table 1. frequency of driving in different traffic situations

                                                        Young drivers             Lease car
                                                           (n=269)             drivers (n=422)
Frequency of driving:                                   Mean      SD            Mean      SD
During rush hour                                         2.9      1.2            4.1      1.0
On motorways                                             3.3      0.9            4.2      0.8
On roads outside built-up areas                          3.8      0.9            4.0      1.0
In the town center of a big city                         3.0      1.1            3.9      0.9
During weekend nights*                                   2.4      1.0            2.7      0.9
Note scale meaning 1= (almost) never; 5= every day; * 1= (almost) never; 4= every weekend


Table 2. Average number of accidents per million kilometers
                                      Mileage in     Active   Passive
Group and age                        km per year accidents accidents                            Fines
Young driver training group2
(aged 18-24 years; n=269)                7,398          28.2      11.8                             39.1
Young driver training group1
(aged 18-24 years; n=269)                7,398          56.3      23.5                             78.3
PROV Young drivers1
(aged 18-24 years; n=345)                9,785         268.0     185.5                             87.1
PROV Young drivers3
(aged 18-24 years; n=271)               12,317          23.4      12.2                             48.2
Lease car drivers4
(aged 18-64 years; n=422)                9,785            9.2       5.0                            32.1
Note 1: Assumed reported accident period 1 year; 2: Assumed reported accident period 2 years; 3: Only
those that drive more than 1000 km per year. 4: Reported accident period 3 years.
Table 3. Self-reported behaviour regarding risk factors
                                                 Young      Lease car     PROV
                                                drivers      drivers      young
                                                (n=269)      (n=422) drivers(n=345)
                                                Mean     S     Mean    S Mean S
                                                         D             D         D
Alcohol:
Frequent and intensive use of alcohol
                                                 .39    .23      .42  .19    -   -
(2 items, alpha=.54)
Use of adversary alcohol strategies
                                                 .05    .16      .33  .32    -   -
(11 items, alpha=.92)
Distractions and concentration
Loss of concentration when driving
                                                 .09    .60      .09  .10    -   -
(13 items, alpha=.81)
Anger:
Shows serious anger to other traffic
participants who commit violations (2 items,     .02    .12      .02  .13 .01 .13
alpha=.64)
Shows irritation to other traffic participants
                                                 .18    .26      .16  .24 .13 .23
who commit violations (4 items, alpha=.61)
Withholds anger towards traffic participants
                                                 .55    .30      .56   .3 .43 .26
who commit violations (4 items, alpha=.59)
Stays calm towards traffic participants who
                                                 .75    .34      .79  .32    -   -
commit violations (2 items, alpha=.45)
Speed and lane preference:
Violation of speed limits on various roads
(50km/h; 80km/hl 120km/h roads) and
                                                 .14    .11      .17  .14    -   -
circumstances (dry-rainy, calm-busy, heavy
traffic; 9 items, alpha=.93)
Violation of speed limits on various roads
under favorable circumstances (dry, calm         .23     16      .26   18 .20 .19
traffic 3 items, alpha=.65)
Driving on the outer lane of motorways under
                                                 .33    .23      .39  .27    -   -
various circumstances (5 items, alpha=.78)
Fatigue:
Degree of fatigue during driving (5 items,
                                                 .09    .09      .11  .12    -   -
alpha=.73)
Note: 0.-.16: rarely; .17-.33: occasionally; .34-.50: sometimes; .51-.67: rather often; .68-.84: very often; .
85-1.0: most of the times
Table 4. driving proficiency as reported on the Driver Self-Assessment
                                                         Young       Lease car
                                                         drivers      drivers
                                                        (n=1226)     (n=579)
                                                                     Mean      SD Mean          SD
- Committing driving errors affecting safety, traffic
flow, social driving, and vehicle control (12 items,                  .21      .11     .17      .13
alpha=.74)
- Driving in a hurry (4 items, alpha=.63)                             .36      .18     .32      .18
- Being irritated by behaviour of other participants
                                                                      .64      .23     .49      .25
(2 items, alpha=.66)
- Perceived quality of one’s own driving behaviour
                                                                      .73      .08     .76      .09
(43 items, alpha=.80)
Note: 0.-.16: rarely; .17-.33: occasionally; .34-.50: sometimes; .51-.67: rather often; .68-0.84: very
often; .85-.1most of the times


Table 5. Scores for situation awareness
                                                        Young drivers          Lease car drivers
                                                          (n=265)                  (n=118)

                                                       Mean          SD        Mean          SD
Subscale ‘Localizing hazards’ (8 items,
alpha=.63)                                                  7.4         1.0          7.1        1.2
Traffic Situation

               1. Basis              3. Action
                                      3. Action
          •   Knowledge              execution
                                      execution
          •   Skills
          •   Attitudes                                  4. Consequences
          •   Moods
          •   Emotions               2.Perception
          •   Personality traits     & decision
                                     making


Competing tasks (e.g. phoning, interacting with peers)


Figure 1. driving as a process of decision making (Roelofs et al, 2008)
Pretest:        Posttest:
                    DRA, DSA          SAT


 Driver Profiling         Driver coaching
 • Risk factors           program
 • Driving behaviour

                               Coached
Meeting coach - driver           trip
                                                   Individual plan
• Personalized                                     for further
  learning objectives           Group
                                                   development
  for driver                  discussion

                               Track
                             experience


   Figure 2. Schematic overview of the Drive Xperience programme
Comments (be specific!)


                                               1. Close encounter crossing Renault on N348
                            1
                                               2. Very near to driver in front on motorway A12
                2


Light grey: felt comfortable
Middle grey: felt uncomfortable
Dark grey: afraid that things would go wring


 Figure 3. observational form for passengers to be used during the coached trip

Más contenido relacionado

Similar a Coaching Young Drivers in a Second Phase Training Programme

EMBED Implementation Guidelines
EMBED Implementation GuidelinesEMBED Implementation Guidelines
EMBED Implementation GuidelinesWiebe Dijkstra
 
Leadership and learning with revisions dr. lisa bertrand-nfeasj (done)
Leadership and learning with revisions dr. lisa bertrand-nfeasj (done)Leadership and learning with revisions dr. lisa bertrand-nfeasj (done)
Leadership and learning with revisions dr. lisa bertrand-nfeasj (done)William Kritsonis
 
chapter 16- part 1. Reflection on Accreditation
chapter 16- part 1. Reflection on Accreditationchapter 16- part 1. Reflection on Accreditation
chapter 16- part 1. Reflection on AccreditationHyzelFaithParan1
 
12 Part 2 Designing TrainingChapter 5 Transfer of Training.docx
12   Part 2   Designing TrainingChapter 5   Transfer of Training.docx12   Part 2   Designing TrainingChapter 5   Transfer of Training.docx
12 Part 2 Designing TrainingChapter 5 Transfer of Training.docxhyacinthshackley2629
 
Learning tool M4T4: Assesment and improving the program
Learning tool M4T4: Assesment and improving the programLearning tool M4T4: Assesment and improving the program
Learning tool M4T4: Assesment and improving the programTOTVET
 
Learning transfer in leadership programs.docx
Learning transfer in leadership programs.docxLearning transfer in leadership programs.docx
Learning transfer in leadership programs.docxSara239500
 
Training need assessment in a 5star ho
Training need assessment in a 5star hoTraining need assessment in a 5star ho
Training need assessment in a 5star hoShamimansary
 
Business Training Evaluation: Application andEffects on Trainee Competencies
Business Training Evaluation: Application andEffects on Trainee CompetenciesBusiness Training Evaluation: Application andEffects on Trainee Competencies
Business Training Evaluation: Application andEffects on Trainee Competenciesiosrjce
 
Evaluation And Futureof Driver Ed
Evaluation And Futureof Driver EdEvaluation And Futureof Driver Ed
Evaluation And Futureof Driver EdDr. Cupid Lucid
 
Senior Leadership Development Case Study
Senior Leadership Development Case Study Senior Leadership Development Case Study
Senior Leadership Development Case Study Abhinandan Chatterjee
 
Coaching challenges lessons learned 2009-2011
Coaching challenges lessons learned 2009-2011Coaching challenges lessons learned 2009-2011
Coaching challenges lessons learned 2009-2011stephenrice1970
 
The Effect of a Leadership Development Program on Behavioral and Financial Ou...
The Effect of a Leadership Development Program on Behavioral and Financial Ou...The Effect of a Leadership Development Program on Behavioral and Financial Ou...
The Effect of a Leadership Development Program on Behavioral and Financial Ou...Maiya Tsyganenko
 
Blended learning combines online and other i.docx
Blended learning combines online and other i.docxBlended learning combines online and other i.docx
Blended learning combines online and other i.docxwrite31
 
Article 01 Vol 8 Issue 1 - Apr 1 to Dec 31_2016
Article 01 Vol 8 Issue 1 - Apr 1 to Dec 31_2016Article 01 Vol 8 Issue 1 - Apr 1 to Dec 31_2016
Article 01 Vol 8 Issue 1 - Apr 1 to Dec 31_2016Dr Zafar Khan
 
IMPADA Recommendations for adult learning providers to improve the effectiven...
IMPADA Recommendations for adult learning providers to improve the effectiven...IMPADA Recommendations for adult learning providers to improve the effectiven...
IMPADA Recommendations for adult learning providers to improve the effectiven...Andrea Ciantar
 

Similar a Coaching Young Drivers in a Second Phase Training Programme (20)

EMBED Implementation Guidelines
EMBED Implementation GuidelinesEMBED Implementation Guidelines
EMBED Implementation Guidelines
 
Understanding Team Building Tranfer
Understanding Team Building TranferUnderstanding Team Building Tranfer
Understanding Team Building Tranfer
 
Leadership and learning with revisions dr. lisa bertrand-nfeasj (done)
Leadership and learning with revisions dr. lisa bertrand-nfeasj (done)Leadership and learning with revisions dr. lisa bertrand-nfeasj (done)
Leadership and learning with revisions dr. lisa bertrand-nfeasj (done)
 
chapter 16- part 1. Reflection on Accreditation
chapter 16- part 1. Reflection on Accreditationchapter 16- part 1. Reflection on Accreditation
chapter 16- part 1. Reflection on Accreditation
 
12 Part 2 Designing TrainingChapter 5 Transfer of Training.docx
12   Part 2   Designing TrainingChapter 5   Transfer of Training.docx12   Part 2   Designing TrainingChapter 5   Transfer of Training.docx
12 Part 2 Designing TrainingChapter 5 Transfer of Training.docx
 
Research In Action #2
Research In Action #2Research In Action #2
Research In Action #2
 
Learning tool M4T4: Assesment and improving the program
Learning tool M4T4: Assesment and improving the programLearning tool M4T4: Assesment and improving the program
Learning tool M4T4: Assesment and improving the program
 
Learning transfer in leadership programs.docx
Learning transfer in leadership programs.docxLearning transfer in leadership programs.docx
Learning transfer in leadership programs.docx
 
Training need assessment in a 5star ho
Training need assessment in a 5star hoTraining need assessment in a 5star ho
Training need assessment in a 5star ho
 
Business Training Evaluation: Application andEffects on Trainee Competencies
Business Training Evaluation: Application andEffects on Trainee CompetenciesBusiness Training Evaluation: Application andEffects on Trainee Competencies
Business Training Evaluation: Application andEffects on Trainee Competencies
 
Evaluation And Futureof Driver Ed
Evaluation And Futureof Driver EdEvaluation And Futureof Driver Ed
Evaluation And Futureof Driver Ed
 
Senior Leadership Development Case Study
Senior Leadership Development Case Study Senior Leadership Development Case Study
Senior Leadership Development Case Study
 
Coaching challenges lessons learned 2009-2011
Coaching challenges lessons learned 2009-2011Coaching challenges lessons learned 2009-2011
Coaching challenges lessons learned 2009-2011
 
Research In Action: Issue 3
Research In Action: Issue 3Research In Action: Issue 3
Research In Action: Issue 3
 
The Effect of a Leadership Development Program on Behavioral and Financial Ou...
The Effect of a Leadership Development Program on Behavioral and Financial Ou...The Effect of a Leadership Development Program on Behavioral and Financial Ou...
The Effect of a Leadership Development Program on Behavioral and Financial Ou...
 
Blended learning combines online and other i.docx
Blended learning combines online and other i.docxBlended learning combines online and other i.docx
Blended learning combines online and other i.docx
 
Article 01 Vol 8 Issue 1 - Apr 1 to Dec 31_2016
Article 01 Vol 8 Issue 1 - Apr 1 to Dec 31_2016Article 01 Vol 8 Issue 1 - Apr 1 to Dec 31_2016
Article 01 Vol 8 Issue 1 - Apr 1 to Dec 31_2016
 
Research In Action #2
Research In Action #2Research In Action #2
Research In Action #2
 
IMPADA Recommendations for adult learning providers to improve the effectiven...
IMPADA Recommendations for adult learning providers to improve the effectiven...IMPADA Recommendations for adult learning providers to improve the effectiven...
IMPADA Recommendations for adult learning providers to improve the effectiven...
 
From source to glass
From source to glassFrom source to glass
From source to glass
 

Más de Erik Roelofs

Roelofs driver training and learning design from a developmental perspective
Roelofs   driver training and learning design from a developmental perspectiveRoelofs   driver training and learning design from a developmental perspective
Roelofs driver training and learning design from a developmental perspectiveErik Roelofs
 
Hoofdstuk 2 toetsen op school
Hoofdstuk 2 toetsen op schoolHoofdstuk 2 toetsen op school
Hoofdstuk 2 toetsen op schoolErik Roelofs
 
Op weg naar congruentie tussen opleiden en beoordelen van docenten: een raamw...
Op weg naar congruentie tussen opleiden en beoordelen van docenten: een raamw...Op weg naar congruentie tussen opleiden en beoordelen van docenten: een raamw...
Op weg naar congruentie tussen opleiden en beoordelen van docenten: een raamw...Erik Roelofs
 
Towards a framework for assessing teacher competence
Towards a framework for assessing teacher competenceTowards a framework for assessing teacher competence
Towards a framework for assessing teacher competenceErik Roelofs
 
Vaststellen van didactische bekwaamheid tijdens de LIO-stage
Vaststellen van didactische bekwaamheid tijdens de LIO-stageVaststellen van didactische bekwaamheid tijdens de LIO-stage
Vaststellen van didactische bekwaamheid tijdens de LIO-stageErik Roelofs
 
Een procesmodel voor de beoordeling van competent handelen
Een procesmodel voor de beoordeling van competent handelenEen procesmodel voor de beoordeling van competent handelen
Een procesmodel voor de beoordeling van competent handelenErik Roelofs
 

Más de Erik Roelofs (6)

Roelofs driver training and learning design from a developmental perspective
Roelofs   driver training and learning design from a developmental perspectiveRoelofs   driver training and learning design from a developmental perspective
Roelofs driver training and learning design from a developmental perspective
 
Hoofdstuk 2 toetsen op school
Hoofdstuk 2 toetsen op schoolHoofdstuk 2 toetsen op school
Hoofdstuk 2 toetsen op school
 
Op weg naar congruentie tussen opleiden en beoordelen van docenten: een raamw...
Op weg naar congruentie tussen opleiden en beoordelen van docenten: een raamw...Op weg naar congruentie tussen opleiden en beoordelen van docenten: een raamw...
Op weg naar congruentie tussen opleiden en beoordelen van docenten: een raamw...
 
Towards a framework for assessing teacher competence
Towards a framework for assessing teacher competenceTowards a framework for assessing teacher competence
Towards a framework for assessing teacher competence
 
Vaststellen van didactische bekwaamheid tijdens de LIO-stage
Vaststellen van didactische bekwaamheid tijdens de LIO-stageVaststellen van didactische bekwaamheid tijdens de LIO-stage
Vaststellen van didactische bekwaamheid tijdens de LIO-stage
 
Een procesmodel voor de beoordeling van competent handelen
Een procesmodel voor de beoordeling van competent handelenEen procesmodel voor de beoordeling van competent handelen
Een procesmodel voor de beoordeling van competent handelen
 

Último

Control-Plan-Training.pptx for the Automotive standard AIAG
Control-Plan-Training.pptx for the Automotive standard AIAGControl-Plan-Training.pptx for the Automotive standard AIAG
Control-Plan-Training.pptx for the Automotive standard AIAGVikrantPawar37
 
ABOUT REGENERATIVE BRAKING SYSTEM ON AUTOMOBILES
ABOUT REGENERATIVE BRAKING SYSTEM ON AUTOMOBILESABOUT REGENERATIVE BRAKING SYSTEM ON AUTOMOBILES
ABOUT REGENERATIVE BRAKING SYSTEM ON AUTOMOBILESsriharshaganjam1
 
Pros and cons of buying used fleet vehicles.pptx
Pros and cons of buying used fleet vehicles.pptxPros and cons of buying used fleet vehicles.pptx
Pros and cons of buying used fleet vehicles.pptxjennifermiller8137
 
Mastering Mercedes Engine Care Top Tips for Rowlett, TX Residents
Mastering Mercedes Engine Care Top Tips for Rowlett, TX ResidentsMastering Mercedes Engine Care Top Tips for Rowlett, TX Residents
Mastering Mercedes Engine Care Top Tips for Rowlett, TX ResidentsRowlett Motorwerks
 
A Comprehensive Exploration of the Components and Parts Found in Diesel Engines
A Comprehensive Exploration of the Components and Parts Found in Diesel EnginesA Comprehensive Exploration of the Components and Parts Found in Diesel Engines
A Comprehensive Exploration of the Components and Parts Found in Diesel EnginesROJANE BERNAS, PhD.
 
Human Resource Practices TATA MOTORS.pdf
Human Resource Practices TATA MOTORS.pdfHuman Resource Practices TATA MOTORS.pdf
Human Resource Practices TATA MOTORS.pdfAditiMishra247289
 
Can't Roll Up Your Audi A4 Power Window Let's Uncover the Issue!
Can't Roll Up Your Audi A4 Power Window Let's Uncover the Issue!Can't Roll Up Your Audi A4 Power Window Let's Uncover the Issue!
Can't Roll Up Your Audi A4 Power Window Let's Uncover the Issue!Mint Automotive
 
Building a Future Where Everyone Can Ride and Drive Electric by Bridget Gilmore
Building a Future Where Everyone Can Ride and Drive Electric by Bridget GilmoreBuilding a Future Where Everyone Can Ride and Drive Electric by Bridget Gilmore
Building a Future Where Everyone Can Ride and Drive Electric by Bridget GilmoreForth
 
Welcome to Auto Know University Orientation
Welcome to Auto Know University OrientationWelcome to Auto Know University Orientation
Welcome to Auto Know University Orientationxlr8sales
 
Lighting the Way Understanding Jaguar Car Check Engine Light Service
Lighting the Way Understanding Jaguar Car Check Engine Light ServiceLighting the Way Understanding Jaguar Car Check Engine Light Service
Lighting the Way Understanding Jaguar Car Check Engine Light ServiceImport Car Center
 
-The-Present-Simple-Tense.pdf english hh
-The-Present-Simple-Tense.pdf english hh-The-Present-Simple-Tense.pdf english hh
-The-Present-Simple-Tense.pdf english hhmhamadhawlery16
 
248649330-Animatronics-Technical-Seminar-Report-by-Aswin-Sarang.pdf
248649330-Animatronics-Technical-Seminar-Report-by-Aswin-Sarang.pdf248649330-Animatronics-Technical-Seminar-Report-by-Aswin-Sarang.pdf
248649330-Animatronics-Technical-Seminar-Report-by-Aswin-Sarang.pdfkushkruthik555
 

Último (12)

Control-Plan-Training.pptx for the Automotive standard AIAG
Control-Plan-Training.pptx for the Automotive standard AIAGControl-Plan-Training.pptx for the Automotive standard AIAG
Control-Plan-Training.pptx for the Automotive standard AIAG
 
ABOUT REGENERATIVE BRAKING SYSTEM ON AUTOMOBILES
ABOUT REGENERATIVE BRAKING SYSTEM ON AUTOMOBILESABOUT REGENERATIVE BRAKING SYSTEM ON AUTOMOBILES
ABOUT REGENERATIVE BRAKING SYSTEM ON AUTOMOBILES
 
Pros and cons of buying used fleet vehicles.pptx
Pros and cons of buying used fleet vehicles.pptxPros and cons of buying used fleet vehicles.pptx
Pros and cons of buying used fleet vehicles.pptx
 
Mastering Mercedes Engine Care Top Tips for Rowlett, TX Residents
Mastering Mercedes Engine Care Top Tips for Rowlett, TX ResidentsMastering Mercedes Engine Care Top Tips for Rowlett, TX Residents
Mastering Mercedes Engine Care Top Tips for Rowlett, TX Residents
 
A Comprehensive Exploration of the Components and Parts Found in Diesel Engines
A Comprehensive Exploration of the Components and Parts Found in Diesel EnginesA Comprehensive Exploration of the Components and Parts Found in Diesel Engines
A Comprehensive Exploration of the Components and Parts Found in Diesel Engines
 
Human Resource Practices TATA MOTORS.pdf
Human Resource Practices TATA MOTORS.pdfHuman Resource Practices TATA MOTORS.pdf
Human Resource Practices TATA MOTORS.pdf
 
Can't Roll Up Your Audi A4 Power Window Let's Uncover the Issue!
Can't Roll Up Your Audi A4 Power Window Let's Uncover the Issue!Can't Roll Up Your Audi A4 Power Window Let's Uncover the Issue!
Can't Roll Up Your Audi A4 Power Window Let's Uncover the Issue!
 
Building a Future Where Everyone Can Ride and Drive Electric by Bridget Gilmore
Building a Future Where Everyone Can Ride and Drive Electric by Bridget GilmoreBuilding a Future Where Everyone Can Ride and Drive Electric by Bridget Gilmore
Building a Future Where Everyone Can Ride and Drive Electric by Bridget Gilmore
 
Welcome to Auto Know University Orientation
Welcome to Auto Know University OrientationWelcome to Auto Know University Orientation
Welcome to Auto Know University Orientation
 
Lighting the Way Understanding Jaguar Car Check Engine Light Service
Lighting the Way Understanding Jaguar Car Check Engine Light ServiceLighting the Way Understanding Jaguar Car Check Engine Light Service
Lighting the Way Understanding Jaguar Car Check Engine Light Service
 
-The-Present-Simple-Tense.pdf english hh
-The-Present-Simple-Tense.pdf english hh-The-Present-Simple-Tense.pdf english hh
-The-Present-Simple-Tense.pdf english hh
 
248649330-Animatronics-Technical-Seminar-Report-by-Aswin-Sarang.pdf
248649330-Animatronics-Technical-Seminar-Report-by-Aswin-Sarang.pdf248649330-Animatronics-Technical-Seminar-Report-by-Aswin-Sarang.pdf
248649330-Animatronics-Technical-Seminar-Report-by-Aswin-Sarang.pdf
 

Coaching Young Drivers in a Second Phase Training Programme

  • 1. Coaching Young Drivers in a Second Phase Training Programme Erik Roelofs, Jan Vissers, Marieke van Onna, Gerard Kern Cito, National Institute for Educational Measurement, The Netherlands DHV group, Amersfoort, The Netherlands Regional Agency for Traffic Safety Gelderland, The Netherlands Introduction During the first six to twelve months of solo driving, young novice drivers experience the most dangerous phase of their driving career: their accident risk reaches a peak by then. This is why several European countries have introduced obligatory second phase training programmes. Other European countries provide these training programmes on a voluntary basis. A recent evaluation of the Austrian model (Gatscha and Brandstaetter, 2008) showed that the number of personal injury accidents among 18-year-old novice drivers was reduced with 28 per cent in all regions of Austria after the introduction of the obligatory second phase system. Several studies stress that the content of second phase driving programmes should not be restricted to lower level vehicle control skills. Moreover, concentrating on the lower vehicle control skills can even be counterproductive (Glad, 1988). Instead, second phase driving programmes should rather address driving style variables which refer to the way that people choose to drive (Elander, West and French, 1993; McKenna, 2009), which can be explained by the way drivers make decisions on the level of life tasks and on the strategic, tactical and operational levels of driving tasks. In a literature review Helman, Grayson and Parkes (2010) driving style variables on the strategic and participation level of driving tasks that are associated with collision risk are
  • 2. reviewed: speed choice, close following of vehicles in front, high-risk overtaking, violation of traffic laws and engaging in distracting activities, such as speaking on mobile phones while driving. Factors on the lifestyle level, such as fatigue-related factors (Groeger, 2006; McKenna, 2009), and alcohol use, themselves fall outside the driving domain, but are associated with collision risk. Groeger (2006) points out that fatigue is especially relevant for very young new drivers, since their lifestyle – often involving extensive weekend and evening socializing – does not support good sleep hygiene. The awareness of these factors, the readiness and the ability to take them into consideration before and during driving involve higher order skills on the part of the young driver, as elaborated in the Goals of Driver Education matrix (Hatakka, et al., 2002). Among these skills are self-reflection and awareness of emotions during driving. The purpose of second phase training programmes is to further develop higher order driving skills that appear to play an important role in the reduction of one´s accident risk. As in other educational areas, scholars stress that development of complex higher order skills should involve increased levels of self-regulation. Although varying approaches may stimulate self-regulation on the part of the learner, there is consensus about the idea that some form of coaching is likely to be effective. For driving instructors who use direct instruction and immediate feedback as a dominant method of training, this shift towards coaching requires a role shift. The driving instructor becomes a driving coach. Drawing from the field of educational psychology coaching can be described as stimulating and supporting self-regulated learning (Boekaerts, 1999; Butler and Winne, 1995). Coaching interventions are expected to stimulate and support cognitive, meta- cognitive, and affective learning activities (Perry, 1998; Perry, et al., 2004; Shuell, 1993; Winne and Hadwin, 1998). Cognitive learning activities pertain to the cognitive activities that learners employ to process relevant task information that contribute to the realization of
  • 3. learning outcomes in terms of changes in learners’ knowledge base and skills. Affective learning activities pertain to coping with emotions that arise during learning and that lead to a mood that may either facilitate or impair the progress of the learning process. Meta-cognitive activities pertain to thinking activities that learners employ to regulate their learning process. These include a) the choice of personal learning objectives, the pace and course of the learning process, and its learning contents, b) the monitoring of learning activities, c) the evaluation of the outcomes and d) the changes in the regulation aspects that follow from evaluations (Vermunt and Verloop, 1999). Typical coaching interventions that are employed to stimulate and support the learning process are asking questions and providing feedback on learning activities as employed by the learner. Using these interventions, the educator makes learners aware of the adequacy, efficiency, and effectiveness of learning activities (Boekaerts and Simons, 1995; Butler and Winne, 1995). The ultimate goal of coaching is to foster self-regulated learning (SRL) In practice, not all learners possess the necessary regulation skills for SRL and need a more balanced approach between educator-led and learner-led regulation. Questions and feedback utterances during coaching may therefore vary from extremely open to very structured. Providing clues, hints, advice, and examples constitute coaching interventions with a high degree of educator regulation. From a Vygotskian point of view, which was adopted by the authors in constructing a driver coaching programme, competent coaches provide just enough support in order to enable students to make the step to the next higher level in employing a learning activity, which they could not have made on their own (Vygotski, 1978). As the performance of a learning activity improves, the support of the educator should decrease until the student can perform the learning activity independently. This is referred to in the literature as ‘fading’ (Collins, Brown, and Newman, 1989).
  • 4. Recently, within the field of driver training, principles of coaching have been defined, which closely resemble the recommendations from educational psychology (Bartl, et al., 2010). Coaching: • puts the learner in an active role; • builds on the prior knowledge and experience of the learner; • encourages the learner to identify his/her goals and to meet these goals; • raises the awareness, responsibility and self-acceptance of the learner; • raises awareness of the learners’ values, goals, motives and attitudes as well as his sensations and emotions, knowledge, skills and habits; • addresses the learner’s internal obstacles to change. As coaching builds on the learners’ awareness of their learning progress, a relevant role can be played by assessments for learning (AFL). AFL are used to inform and support the learner and their educators about their levels of (driving) competence, and the underlying performance aspects that need further attention. By using the results of these assessments, subsequent coaching may be tailored to the learner drivers’ specific needs (Stiggins, 2002). To facilitate higher order level learning in driving, formative assessments should go beyond traditional assessments aimed at isolated testing of knowledge about traffic rules and technical driving skills. Fitting in with the approach as described above, formative assessments need to: a) address critical elements of the driving task and its circumstances as they appear in daily driving and throughout the driving career; b) fit in with the stage of development of the (learner) driver, c) be informative about various mental processes. The current study focused on a Dutch second phase coaching programme that was developed as part of the EU-project ‘Evaluation of post-licence training schemes for novice drivers’ (NovEv; Sanders and Keskinen, 2004). The programme, entitled ‘The Drive Xperience’, was based on recommendations from recent literature on the coaching of young
  • 5. drivers. Since the first introduction of the programme in 2003, it has been updated and evaluated on a continuous basis (Vissers, 2006). In this study, attention was focused on a description of the participating group of young drivers. As participation in the Dutch programme is voluntary there may be a form of self- selection, resulting e.g. in groups of highly motivated responsible drivers or in groups with drivers with already a rich accident history. For the programme to be successful in addressing the target group, it aims to attract a representative group of young drivers, who are in need of various forms of extra insights into their driving styles. The main research questions of this study entail: 1. To what extent does the programme address the envisioned target group? 2. To what extent does the design and content of the coaching programme address the driving characteristics of the participating young drivers? In order to determine the fit with the target group, the driving characteristics of participating young drivers in ‘The Drive Xperience Programme’ were compared with a Dutch reference group of young drivers. Also comparisons were made with characteristics of experienced drivers who drive in leased cars and who are sent to an advanced driver training programme, because of their unfavourable driving history. More specifically, the following research questions will be addressed: • What are the driving characteristics of young drivers enrolled in a programme for coached driving in terms of their driving behaviour, their personal risk factors, and their self-perceptions regarding driving proficiency? • In what respects do participating young drivers differ from the average young driver, as described in earlier young driver studies in The Netherlands? • In what respects do young drivers differ from experienced drivers, who are enrolled in advanced driver training programmes? Method Design characteristics of the second phase coaching programme ‘Drive Xperience’
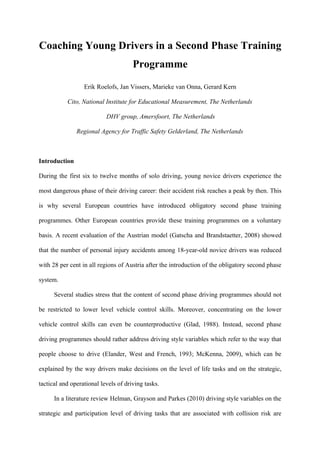
  • 6. The design principles and content of the Drive Xperience (DX) programme second phase coaching programme were drawn from different sources of research, which are described below. GDE-matrix: task levels of driving Throughout the training programme the GDE matrix (Hatakka et al, 2002) is used as a conceptual framework for all learning experiences. During discussion about driving styles, it is emphasized that the actual quality of participation in traffic situations is influenced by decisions on higher level tasks. These include life tasks, e.g. socializing with peers, recreating, working, and strategic tasks, e.g. choice of transportation mode, and route decisions. Driving as a serious task, involving complex task processes The idea is that at all levels car, driving needs to be considered as a serious task, in which various aspects need to be considered simultaneously: the state of the driver, passengers, baggage, presence of other participants, weather road conditions and so forth. Besides, drivers often carry out competing (life level) tasks which can seriously impede the quality of the driving task execution: e.g. phoning, talking, mental preparation for work, being angry with other drivers. In the training programme coaches will consider driving as a cognitive/affective decision making process, during which the driver (ideally verbally) needs to reflect on his/her own decisions, actions and consequences as depicted in figure 1. [Insert Figure 1] The model, which is used in simplified form, offers a thinking tool for the young driver during coached trips. During the preparation programme, coaches use the model when reflecting on explanations of driver behaviour, located inside or outside the driver (referred to as ‘basis’ and ‘traffic situation’ in the model).
  • 7. Balancing task complexity and level of proficiency One of the problems with young drivers is that they often fail to safely adapt their choice of traffic situations to their level of proficiency (Fuller, 2005; De Craen, 2010). Due to a lack of driving experience and to an inadequate self-assessment of own proficiency young drivers choose to engage in traffic situations they do not have mastery of yet. In the coaching programme young drivers are supported to search for a balance between their own level of proficiency and the complexity of the traffic situations they engage in. Disturbance of this balance may cause hazardous situations. Keeping a surplus of proficiency (in terms of time and space for actions) is considered essential. Task complexity is addressed in two ways during the young driver coaching programme. First, driving coaches are encouraged to choose routes consisting of traffic situations with varying degrees of complexity, but that never overtax the young driver. By choosing critical situations where proficiency and task complexity begin to show imbalance, young drivers become aware of their learning needs. Second, the factors that cause task complexity and imbalance are discussed during the trip. Borrowing from error-taxonomy studies (Stanton and Salmon, 2009) critical task environmental attributes are addressed that hamper or facilitate the driving process in the following way: • Perception/comprehension: This process is hampered by sight obstruction, camouflage, hearing obstruction, and discontinuous traffic environment. E.g. a hedge blocking the side view at a crossing; unreadable road signs, temporary reduction in the numbers of lanes; • Decision making: This process is hampered by other participants who arrive at the scene at the same time, or by reduced time and space to carry out actions. E.g. complex crossroads with many different participants, lanes reduced in width, narrow and winding roads. • Action execution: This process is hampered by reduced space, and road or weather conditions hindering vehicle control. E.g. wet road surface, snow, cross winds, high gradient percentage.
  • 8. Referring to different GDE task levels some of the outcomes of the discussions could be to avoid driving at certain hours of in certain conditions, to take an alternative route (strategic level) or to reduce speed earlier (tactical level). Discussions about driving behaviour are facilitated by the use of observation assignments for passengers, who are not behind the wheel (see next section). Criteria for driving proficiency The ultimate goal of the coaching programme is that young drivers make responsible decisions in traffic tasks at all GDE task levels. To determine the quality of driving behaviour, coaches are encouraged to pay attention to five inter-related criteria of driving performance (Roelofs, et al., 2010): 1) Safety: The driver’s ability to solve traffic situations in such a way that time and space are available for all participants to carry out driving activities without conflicting or colliding with objects or others. Indicators are awareness of the situation, correct timing of actions, adapting speed and using “space cushions”; 2) Facilitating traffic flow: The ability to drive in a way that does not impede the progress of other road users, and helps an optimal flow of traffic; 3) Consideration with other road users: The ability to give others opportunities to fulfill their tasks, or to adapt to their mistakes, without showing aggression or irritation; 4) Controlled driving: Steering and controlling the car smoothly, without stutters and jerks or departures from smooth lines. 5) Environmentally-responsible driving: Driving in such a way that emissions of harmful gases and noise levels are kept to a minimum and that optimal use of fuel is achieved. These criteria, with an emphasis on safety, form the basis of discussions about traffic behaviour. In addition, these criteria are addressed in the web-based assessments for learning which participants go through as a preparation for the coaching programme. Overview of the second phase coaching programme Figure 2 gives a schematic overview of the DX programme.
  • 9. [Insert figure 2] During a pre-test period of four weeks before the start of the training programme the participants were asked to complete two web-based assessments: The Driver Risk Assessment and the Driver Self-Assessment. These assessments result in an individual driver profile for the participant. The individual profiles are also accessible for the driving coaches and are used for tailoring the training content to individual learning needs and for reflective purposes on the part of the young drivers. Participating young drivers use the outcomes to arrive at personal learning objectives for the coached trip. For instance, speed or distraction may have turned out to be risk factors for a participating young driver. • The driver coaching programme takes place during one day and consists of three parts: • Coached trip: The main objective of the coached trip is to present the driver with feedback about his ‘everyday’ driving performance. • Track experience: The main objective of the track experience is for participants to experience the limits of their skills in vehicle control and to share these experiences with other group members. • Group discussion: The main objective of the group discussion is to stimulate recognition of potentially hazardous situations in rather 'normal' driving situations. Risks of alcohol use and other risky driving behaviors are discussed. During the coached trip the principles of coaching individual drivers are elaborated in detail. The trip takes approximately one hour per participant. The driving coach is expected to choose a route that addresses the specific needs of the young driver. During a 15 minute pre trip discussion the young drivers and their coaches determine the routes to be taken. In addition, observation points are chosen by which parts of the trip can be reviewed and discussed in a non-threatening way. During the trip the young passengers are asked to mark all observed interactions with other participants in terms of their experienced degree of comfort, discomfort or even fear (figure 3).
  • 10. [Insert figure 3] At two points the trip is paused to enable a discussion about what has happened during the trip. First the driver gives his/her own impressions. Then the passengers give their notes and the driver reacts to them. In this conversation the coach asks clarifying questions and elicits better solutions by building on the passengers’ and the drivers’ responses. Trends in driving behaviour are notified, e.g. using big/small space cushions towards other traffic participants, or scanning timely or too late for the changes in the traffic situations. During the trip the coach is expected to give suggestions for changes in the route to enable the driver to drive in situations that are relevant to his or her personal objectives. After the second stop the strong points and the points to improve are reviewed after which the participants change places, and the previous passenger now drives. At the end of three trips the young drivers are asked to write down the most important points on which they want to improve themselves in the near future. During a post-test period of four weeks after the programme the participants are expected to complete a third web-based assessment, the Situation Awareness Test. This assessment also yields a feedback report which may give additional information about points to be developed (see section below). Instrumentation In this study data from three draft instruments aimed at informing drivers about their risk profile and their driving behaviour were employed. The instruments were administered during the coaching programme as described above. At the same time the data were used to give a detailed description of the participants in terms of the factors and behaviours mentioned above. As the instruments have also been administered to experienced drivers
  • 11. (driving in leased cars) enrolled in driver training programmes, comparisons can be made between young (inexperienced) drivers and older (more experienced) lease car drivers. Driver Risk Assessment questionnaire The Driver Risk Assessment is a web-based questionnaire consisting of 119 questions regarding the driver history and the drivers’ behavioural risk factors. Personal background variables pertain to age, gender, and years of driving experience. The questions regarding driving history refer to mileage and to the kind and variety of traffic situations to which the driver is exposed: e.g. driving during rush hours, on various road types, or driving during weekend nights. In addition, questions are posed about the number of active and passive accidents the driver was involved in during the past three years and the number of fines received for various reasons the past year. Questions regarding behavioural risk factors pertain to the following topics: speed choice under various conditions, lane preference on motorways during various traffic conditions, alcohol use and driving, the use of adversary alcohol strategies in combination with driving, anger in reaction to others participants’ violations, distraction and fatigue. Most of the behavioural questions ask for a response on a Likert scale, where each scale point represents a behavioural option (e.g. speed choice: ‘between 120-125 km/h’, ‘between 125-130 km/h; anger: ‘not angry, ‘a little angry’). Also questions with a dichotomous response were employed (e.g. I stay calm and don’t let myself get annoyed: yes/no). After the participant has completed the assessment an individual score profile is reported on 10 categories and on the total risk score expressed on a scale between 0 and 100: age and sex, years of driving experience, mileage, fines, collisions, driving in various situations, speed, alcohol, concentration-distraction, aggression, and fatigue. Written feedback is displayed, of which the wording depends on the applicable score level (low risk; moderate risk, high risk). Provisional cut-off scores for these levels of risk were determined based on the score for the 33rd and the 66th percentile.
  • 12. Driver Self-Assessment The Driver Self-Assessment is a web-based questionnaire consisting of 45 illustrated questions. It comprises a self-assessment of driving ability addressing the five criteria for driving competence described above. The questions pertain to strategic, tactical and operational behaviour choices on different road types. Each question is accompanied by an illustrative picture, showing the essential features of the traffic situation to which the question refers. An example of a safety question on strategic level is: “How often do you take a longer route because it is safer (such as driving around rather than through a residential area)?” An example of an item on the tactical level: “When turning right, how often do you fail to see a cyclist/moped rider over your right shoulder?” An example of item on the operational level is: “How often do you have to brake on a bend?” Participants respond by using a four-point Likert-scale ranging from ‘almost never’ to ‘almost always’. After the participant has completed the assessment an individual profile is reported on the five criteria mentioned above. The scores are expressed in terms of percentages of the maximum possible score. Detailed written feedback is displayed depending on the score category, carrying the following labels: 0-60 per cent ‘improvement necessary’; 60-80 per cent ‘satisfactory, with room for improvement’, 80-100 per cent: ‘well done!’ Situation Awareness Test The Situation Awareness Test (SAT) intends to assess the degree in which the driver is aware of changes in traffic situations. The development is described in Roelofs et al., (2008). During its administration the test was still under construction, implying that part of its items could be left out of the test for psychometric reasons. The SAT consists of 40 traffic scenarios displayed as video clips during test administration. Each item starts with a video clip showing a driver activity during a critical
  • 13. traffic situation from the driver perspective. Four types of questions with different responses are employed: recollection, decision making, localizing hazards, and timed response. The recollection items refer to the recall of a change in the traffic situation which includes a possible hazard on which should be responded to solve the situation safely. After the video clip freezes, two types of multiple choice questions can be asked. The first question type measures to what extent the driver has noticed a signpost or signal by asking about the consequences (how fast are you allowed to drive?) The second type asks if a specific behavioural choice can safely be made in a complex traffic situation (can you turn right safely now?). The decision items require the driver to select the most appropriate risk- avoiding solution for that moment. After the scenario freezes, the driver is asked to select the best behaviour option at that moment. The localizing items ask the subject to mark the spot on the screen (the frozen traffic situation) where immediate attention is required. Finally, timed response items require the subject to choose the optimal moment for carrying out a risk-avoiding manoeuvre, leaving a maximum of space to carry out driving activities. The video clip is shown twice. In the first viewing, the participant is asked to observe the overall situation. They are told what type of risk avoiding manoeuvre is to be carried out. During the second viewing, the participant clicks on the screen at the moment they intend to carry out the manoeuvre. After the participant has completed the assessment, an individual score profile is reported on the four item types and on the total test score in a similar way as the DSA: Participants For this study data were used from two groups: young drivers enrolled on the young driver second phase coaching programme and lease car drivers enrolled on advanced driver training programmes. The young drivers group (n=1247) participated in a total of 43 training groups in the period between August 2010 and June 2011 (mean group size: 29) and consisted of 671 male
  • 14. and 576 female subjects. This distribution is representative of the Dutch population. The participants had held their driving licence between six months and two years. They were aged between 18 and 24 years. Their average mileage 7398 kilometres, which is almost equal to the average Dutch young driver. The group of lease car drivers (n=922) came from 31 companies that sent their associates to advanced driver training in small groups. The lease car drivers differ in terms of age and gender composition from the average Dutch population of drivers. The former group is relatively younger (80 per cent is younger than 45 versus 53.4 per cent for the population), has fewer years of driving experience (37 per cent less than 10 years versus 22.5 per cent) and contains more men (79 per cent versus 56 per cent). To enable comparison with a reference group of young drivers several analyses were performed on a database containing data from a large-scale survey using representative samples of the Dutch population (PROV). This survey has been carried out almost yearly since 1990 (Eversdijk et al., 2000) until 2005. For purposes of comparison only the most recent data (2005) were used (n=345), since traffic safety figures have changed considerably since 1990. Data analyses For the purpose of the description of the young drivers and lease drivers in this paper the assessment instruments were further refined. Principal Component Analyses (PCA) and reliability analyses were carried out on the responses to items from the three draft instruments. For the Driver Risk Assessment there were only minor changes in the ordering of subscales compared to the scales that were used to inform the drivers. For the Driver Self- Assessment the analyses resulted in a subscale ordering that differs considerably from the original subscales in terms of the five performance criteria, as used for purposes of feedback to the participants. Regarding the Situation Awareness Test, only the scale ‘localizing’
  • 15. reached a satisfactory level of reliability. Data on the other subscales are therefore not reported. In the next section the results for the subscales as found in the analyses are reported. Criteria for inclusion in a subscale were: a high loadings on a principle component after a PCA; b) an item correlation of at least .25 in the reliability analysis. The young drivers, the lease car drivers and the young driver reference group were described by means of descriptive statistics. Differences in group means were tested by means of one-way analyses of variance. Differences in cell proportions in crosstabs were tested by means of chi-square tests. Results In the forthcoming tables the participating groups of young drivers are characterized in terms of their driving behaviour, their risk profiles, their self-images related to safe driving and their levels of situation awareness. In which situations do young drivers drive? Young drivers regularly drive during rush hour and on motorways (means 2.9, 3.3, see Table 1). They relatively often drive on roads outside built-up areas which have no separated lanes (mean 3.8), and which serve participants with different speeds and vehicle masses. In addition, young drivers regularly drive in the town centre of a big city (mean 3.0). Finally, they sometimes drive during weekend nights (mean 2.4; about once a month). Lease car drivers drive (significantly) more often in the situations mentioned (t-values 13.7, 12.9, 2.1, 11.7 and 3.9 respectively; df= 689; all significant at the .01 level).
  • 16. [insert Table 1] Accidents and fines Table 2 shows the accident risk expressed in the average number of accidents and fines per one million kilometres. Not all participants had completed their annual mileage and accident report. The participants reported their accidents during the last three years, whereas in the PROV study it was asked each year. The reported number of accidents was corrected for the number of years and then related to mileage. The young drivers who participated in the coaching programme only had their licence for a maximum of two years. Since no precise information was available about the time they held their licence, this period was assumed to be two years, which is a very conservative estimate. In order to gauge the robustness of the results, the analyses were also performed assuming a one-year period for the PROV reference group. Seventy-four drivers reported driving 1000 km at the most. Since the extrapolation of their results to one million kilometres seemed unreliable, the results of the reference group are also presented without these low-mileage drivers. [Insert Table 2] The average mileage for the young driver coaching group was significantly lower than for the PROV reference group (t=-2.6, df=612, p=.01). The lease car drivers had a higher average mileage than both young driver groups. Both young driver groups had higher accidents risks than lease car drivers, both for accidents where the driver was legally liable (active accidents) and for accidents where the other driver involved was legally liable (passive accidents). The risk for fines was higher too. Even with the conservative estimate, the young driver training group seemed to have higher risk for active accidents than the
  • 17. reference group, when excluding the low-mileage drivers (28.2 versus 23.4). However, a t- test for independent samples did not yield significant results. Since the data concerned frequency data on a fixed number of kilometres that were skewed to the right, a Poisson model was appropriate for testing the null-hypothesis that the active accident rates in both groups are equal. This hypothesis was rejected (χ2= 119.4, df = 1, p<.01). The passive accident rate did not differ significantly between the young driver coaching group (conservative estimate) and the reference group, excluding the low-mileage drivers (χ2= 1.9, df=1, p=.17). The young driver coaching group had a lower fine rate than the reference group, excluding the low-mileage drivers (χ2= 253.8, df=1, p<.01). However, in the less conservative estimate, assuming an accident report period of one year only, the fine rate for the young driver coaching group is significantly higher than the fine rate in the reference group, excluding the low-mileage drivers (χ2= 1931.4, df=1, p<.01). [Insert Table 3] Risk factors Table 3 shows results regarding behavioural risk factors as measured by means of the Driver Risk Assessment. The participating young drivers sometimes drink alcohol (mean .39) and they do not differ in this respect from the lease car driver (mean = .42). They rarely combine alcohol with driving a car, as can be observed form the mean score on the scale ´use of adversary alcohol strategies (mean: = .05). This scale consists of questions whether the participant combines drinking alcohol with driving and a series of questions about well- known but adversary strategies to minimize the effects of alcohol once the participant finds themselves at places where alcohol is served. E.g. pretending to drink alcohol, wait for a while before taking the next alcoholic drink, wait a while before driving home, taking a long time for a drink. Lease car drivers occasionally combine alcohol and driving, including the use of the adversary strategies (mean = .33)
  • 18. A next risk factor, loss of concentration rarely occurs with young drivers (mean: = .09). This scale refers to situations in which drivers are unconscious about the route they have just driven, or are distracted because they were thinking about something, or appear surprised by sudden maneuvres of other participants. The questions regarding anger referred to the drivers’ reaction on other participants’ violations or deviating driving behaviour. In terms of anger the young drivers very often stay calm (mean: = .75). Reactions of withheld anger occur rather often (mean = .55). Irritated reactions towards other participant occur occasionally (mean: = .18). Seriously angry reactions occur very rarely (mean: = .02). In terms of anger, young drivers do not differ from lease car drivers. The differences are insignificant. Available data from the PROV reference group show that average young drivers react less frequently with irritation (t = 2.5; df = 612; p <.01) and withheld anger (t = 5.2; df = 612; p <.01) than young drivers participating in the coaching programme. The data on staying calm were not comparable, due to different wordings in the questionnaire employed in both studies. A fourth risk factor is speed and lane preference. Based on the preferred speeds as reported by the participants, a scale was constructed for the degree in which speed limits are violated. A higher proportion means that participants violate the limits on a greater number of different road types (50km, 80km, 120 km limits) and to a greater extent (e.g. ‘maximum 120 km/h’, ‘120-125 km/h’ up to ‘over 150 km/h’). On average young drivers say they rarely violate the limits (mean: = .14) and even less frequently than lease car drivers (mean: = .17; t = -5.2; df = 689; p < .001). Under favourable weather and road conditions young drivers occasionally violate speed limits (mean: = .23). The difference with lease car drivers (mean: = .26) is significant (t = -2.3; df = 689; p < .05). Under favourable conditions young drivers more often violate the speed limits than the PROV young driver reference group (means: = . 23 and .20 respectively; (t = 2.1; df = 612; p <.05).
  • 19. Regarding lane choice, both young drivers and lease car drivers sometimes choose the outer lanes on the motorways (means: = .33 and .39 respectively). Lease car drivers do this more often (t = -3.0, df = 689; p < .05) than young drivers. The final risk factor pertains to fatigue. The questions asked whether the driver has experienced problems keeping their eyes open, if they have had micro sleeps during driving, if they have had less hours of sleep than needed, and if they have been driving at night without having rested during the day. The scores on this scale suggest that on average young drivers rarely experience the problem of fatigue while driving (mean: = .09). Lease car driver experience fatigue a little more frequently (mean: = .11, t = -2.0, df = 689, p < .05). [Insert Table 4] Self-Assessment of driving proficiency In Table 4 the results on the Driver Self-Assessment (DSA) are summarized. The DSA was administered from the start of the young driver coaching programme to 1226 participants. A PCA performed on the DSA data resulted in a different ordering into four subscales that differ from the subscales that are usually reported for the young drivers during the coaching programme. The first scale consists of 12 items which address errors that affect traffic safety (failure to scan for other participants, following too close, braking too late), traffic flow (blocking other traffic at crossroads or causing others to wait), and vehicle control (errors when braking, using gears, drifting when operating car equipment). On average, young drivers occasionally commit errors (mean: = .21) that affect the criteria mentioned above. They do not differ significantly from lease car drivers in this respect (mean: = .17). The second scale can be labelled as ‘driving in a hurry’. Subjects are asked whether they really ‘step on the gas’ and drive faster than the speed limits. Young drivers sometimes
  • 20. drive in a hurry (mean: = .36) and do not differ significantly from lease car drivers in this respect (mean: = .32). The third scale pertains to feelings of irritation caused by other participants’ driving behaviour (driving errors and driving too slow). Young drivers report that they rather often feel this irritation (mean: = .64). They report this irritation significantly more frequently than lease car drivers (t = 12.7, df = 1804; p < .001). The overall scale ‘Perceived quality of one’s own driving behavior’ consists of 43 items. Two items have been left out because of a low item-rest correlation coefficient. The negatively formulated items of the first three subscales were reversed. The scale can be interpreted as the degree to which the driver reports a safe, flow-aiding, social, controlled and environmentally considerate way of driving. On average young drivers report that they very often show this type of behaviour (mean: = .73). They do not differ significantly from experienced drivers (mean: = .76) in this respect. Situation awareness [Insert Table 5] Psychometric analyses on the responses to the Situation Awareness Test showed that only one subscale reached an acceptable alpha coefficient (at least .60): ‘localizing hazards’. On average young drivers score high on this task (mean: = 7.4 on an eight item subtest), indicating that they are well able to localize possible hazards in a traffic scenario (see Table 5). They even perform significantly better than lease car drivers who reach a mean score of 7.1 (t = 3.0; df= 381; p < .01), which is also relatively high. Discussion
  • 21. The results of the study can be summarized in the light of the two main research questions. The first main question addressed the issue of whether the second phase coaching programme has attracted a representative group of young drivers in terms of their driving characteristics. In this study, data from web-based assessments administered over the course of almost one year as part of the DX programme were analyzed to yield a picture of the participants’ driving characteristics. Looking at the driving history in terms of their mileage, the relative accident risk and the number of fines it becomes clear that participants in the programme form at least an average group of young drivers. The organizing agency feared that the participants would be well-educated and good drivers, but this does not seem to be the case. On the contrary, there are indications that the relative risks of accidents and fines are higher than they are in a representative Dutch reference group of young drivers. The latter group was involved in the 2005 version of the annual monitoring study into traffic safety in the Netherlands (Eversdijk et al., 2000). In terms of the available comparable risk factors studies, the DX participants score less favourably than the average young driver: the former reports irritation towards other drivers, making errors and violating the speed limits more often than the latter group. The second main question was to what extent the design and content of the coaching programme had addressed the driving characteristics of the participating young drivers? In other words, does the programme address their specific needs? Reflecting on this question, some observations can be made. First, DX participants find themselves in risky traffic situations, i.e. on roads outside built-up areas and in the town centre of a large city. While doing so, they occasionally violate the speed limits. They sometimes choose outer lanes when driving on motorways. Taken together with the reported relatively high accident involvement, this calls for attention to the risks of speed as is the case in the DX coaching programme.
  • 22. Second, a relatively favourable picture emerges regarding the combination of alcohol use and driving. DX participants mostly refrain from drinking when they have to drive. Most participants do not give in to adverse alcohol strategies, such as pretending to drink alcohol, wait for a while before taking the next alcoholic drink, wait a while before driving home, or drink a cup of strong coffee. Alcohol use is more of an issue for the lease car driver involved in this study. The available data come from those who are enrolled in advanced driver training programmes and had completed the same web-based assessments as the DX participants. Fourth, DX participants often respond to certain driving situations with irritation. They report this irritation more frequently than experienced lease car drivers. They also sometimes find themselves hurrying through the traffic. At the same time DX participants have a rather positive self-image of their own driving behaviour. Their self-image does not differ to a large extent from that of the more experienced lease car drivers. Third, DX participants are very capable of localizing hazards, as measured by the Situation Awareness Test. They even performed better than lease car drivers. The tendency to drive at higher speeds than is permitted, to react with irritation towards other drivers combined with a positive self-image may result in overestimation of the own driving proficiency. In turn this overestimation may result in imbalances between task demands and real proficiency, causing increased risks, and loss of control (Fuller, 2005; De Craen, 2010). The average driving profile of DX participants matches well with the design and content of the coaching programme. During the coached trip the participants are encouraged to form realistic self-images. The non-judgmental peer feedback during the trip may contribute to the forming a realistic self-image. Drivers become more conscious about their driving activities and the immediate consequences for other traffic participants. One participating young driver put it like this: “Indeed, some of my friends have many ‘Oops’
  • 23. moments when I am driving. Now that you report five red crosses [on the feedback form] I remember that”. Interest is the finding that the participating young drivers seldom showed the undesirable combination of alcohol use and driving, and the corresponding adverse alcohol strategies. In the most current version of the coaching programme a one and a half hour time slot is reserved exclusively for discussion about the risks of alcohol and driving. One recommendation following from the participants’ profiles would be to concentrate more generally on risks of life style attributes that can account for specific problematic young driver behaviours, such as irritation, and driving in a hurried, stressed way. Following the line of thought in the GDE matrix the antecedents of these driving behaviours could be disclosed and discussed. In such a way changing driving habits starts at the understanding that life-style decisions, all day activities and driving behaviour are strongly interwoven. Although young drivers may well be capable of participating safely when expected to do so during a coached trip, they may not choose to do so when they are caught up in daily life activities. Part of the performance is related to style as mentioned in the first section of this chapter (Elander, et al., 1993). The results of this study indicate that young drivers are able to localize hazards in a computer based test environment. The question is, whether they are both capable of and ready to localize hazards when they are driving their own cars, in the presence of peers, with whom they are socializing. This brings us to two suggestions for follow-up study. First, in this study no attention has been paid yet to possible short and long term effects of the coaching programme on reported and actual driving behaviour, as is recently recommended by other authors (cf. Mynttinen et al., 2010). In the coaching programme a non-judgmental approach was used for coaching. In a follow-up the young drivers’ styles of driving will be evaluated, employing trained instructors who will serve as evaluators.
  • 24. Second, the current study did not shed light on the implementation of the coaching programme. In a follow-up study the focus will be on the features of the coaching programme, which contribute to or impede changes in attitudes and driving behaviours of the participants. Some of the questions are: To what extent do coaches regulate learning activities and how does that affect the learning orientations of the participants? To what extent is the approach of connecting to the zone of proximal development as proposed in the coaching programme effective? In the follow-up study, more intrusive forms of data collection are needed to delve into these questions and to prevent over reliance on self-reports. Direct observations, interviews and performance assessments will be employed to sort out the effective ingredients of coaching on young drivers, even if the effects may be indirect (McKenna, 2010). References Bartl, G., et al. (2010). High impact approach for Enhancing Road safety through More Effective communication Skills In the context of category B driver training. EU HERMES Project Final Report. Boekaerts, M., (1999). Self-regulated learning: Where we are today. International Journal of Educational Research, 31, 445-457. Boekaerts, M., & Simons, P.R.J. (1995). Leren en instructie. Psychologie van de leerling en het leerproces (Learning and instruction. Psychology concerning student and students’ learning process). Second edition. Assen:: Van Gorcum. Butler, D.L., and Winne, P.H., (1995). Feedback and self-regulated learning: A theoretical syntheses. Review of Educational Research, 65(3). 245-281. Collins, A., et al. (1989). Cognitive apprenticeship: teaching the crafts of reading, writing, and mathematics. In L.B. Resnick (Ed.), Knowing, learning and instruction: Essays in honor of Robert Glaser (pp. 453-494). Hillsdale, NJ: Erlbaum.
  • 25. De Craen, S., (2010). The X-factor. A longitudinal study of calibration in young novice drivers. Dissertation. Leischendam: Stichting Wetenschappelijk Onderzoek Verkeersveiligheid SWOV Elander J., et al. (1993). Behavioural correlates of individual differences in road traffi c crash risk: an examination of methods and findings. Psychological Bulletin, 113 (2) 279–294. Eversdijk, J.J.C., et al. (2000). PROV 1999 Periodiek Regionaal Onderzoek Verkeersveiligheid [PROV 1999: periodic Dutch regional research into traffic safety]. Report number: TT00-66. Veenendaal: Traffic Test BV. Fuller, R., (2005). Towards a general theory of driver behaviour. Accident Analysis and Prevention, 37, 461-472. Gatscha, M., and Brandstaetter, C., (2008) Evaluation der zweiten Ausbildungsphase in Österreich [Evaluation of the second phase system in Austria]. Forschungsarbeiten aus dem Verkehrswesen. Vol. 173. Austrian Federal Ministry of Transport, Innovation and Technology. Vienna, Austria. Glad, A., (1988) Fase 2 I foreoplaringen. Effect pa ultkkes riskoen. [Driver Education’s second phase. Its effect to the accdident risk.] Reprot No. 0015. Oslo, Transportokonomiskt institut. Groeger J A., (2006). Youthfulness, inexperience, and sleep loss: the problems young drivers face and those they pose for us. Injury Prevention, 12 19–24. Hatakka, M., et al. (2002) From control of the vehicle to personal self-control; broadening the perspectives to driver education. Transportation Research Part F, 5, 201-215. Helman, S., et al. (2010). A review of the effects of experience, training and limiting exposure on the collision risk of new drivers. TRL Insight Report INS005. Bracknell (UK): Transport Research Laboratory.
  • 26. McKenna, F. P., (2009). Can we predict driver behavior from a person’s sleep habits? Behavioural Research in Road Safety, 19th Seminar, 30 March–1 April 2009. London: Department for Transport. McKenna, F. P., (2010). Education in Road Safety Are we getting it right? London: RAC Foundation. Mynttinen, S., et al. (2010). Two-phase driver education models applied in Finland and in Austria – Do we have evidence to support the two phase models? Transportation Research Part F: Traffic Psychology and Behaviour, 13(1), 63-70. Perry, N., et al. (2004). Examining features of tasks and their potential to promote self- regulated learning. Teachers College Record, 106, 1854-1878. Perry, N.E., (1998). Young children’s self-regulated learning and the context that support it. Journal of Educational Psychology, 90, 715-729. Roelofs, E.C., et al. (2008). Development of multimedia tests for responsive driving. In L. Dorn (ed.) Driver Behaviour and Training, Volume III (pp 251-264), Hampshire: Ashgate Publishing Limited. Roelofs, E.C., at al. (2010). Development of the Driver Performance Assessment: Informing Learner Drivers of their Driving Progress. In L. Dorn (Ed.) Driver behavior and training, volume IV (pp. 37-50). Hampshire: Ashgate Publishing Limited. Sanders, N., and Keskinnen, E., (eds.) (2004). EU NovEV project; Evaluation of post-licence training schemes for novice drivers. Final Report. International Commission of Driver Testing Authorities CIECA, Rijswijk, The Netherlands. Shuell, T.J., (1993). Toward an integrated theory of teaching and learning. Educational Psychologist, 28, 291–311. Stiggins, R. J., (2002). Assessment crisis: The absence of assessment FOR learning. Phi Delta Kappan, 83 (10), 758-765.
  • 27. Stanton, N.A., and Salmon, P.M., (2009).Human error taxonomies applied to driving: A generic driver error taxonomy and its implications for intelligent transport systems. Safety Science, 47, 227–237 Vermunt, J.D., and Verloop, N., (1999). Congruence and friction between learning and teaching. Learning and Instruction, 9, 257-280. Vissers, J.A.M.M., (2006). Evaluatie Tweede Fase Opleidingsprogramma Gelderland 2006 [Evaluation second phase driver training programme]. Amersfoort, DHV. Vygotsky, L.S., (1978). Mind in society: The development of higher psychological processes. Cambridge, MA: Harvard University press. Winne, P.H., and Hadwin, A.F., (1998). Studying as self-regulated learning. In D.J. Hacker, J. Dunlosky, & A.C. Graesser (Eds.), Metacognition in educational theory and practice (pp. 277-304). Hillsdale, NJ: Erlbaum.
  • 28. Table 1. frequency of driving in different traffic situations Young drivers Lease car (n=269) drivers (n=422) Frequency of driving: Mean SD Mean SD During rush hour 2.9 1.2 4.1 1.0 On motorways 3.3 0.9 4.2 0.8 On roads outside built-up areas 3.8 0.9 4.0 1.0 In the town center of a big city 3.0 1.1 3.9 0.9 During weekend nights* 2.4 1.0 2.7 0.9 Note scale meaning 1= (almost) never; 5= every day; * 1= (almost) never; 4= every weekend Table 2. Average number of accidents per million kilometers Mileage in Active Passive Group and age km per year accidents accidents Fines Young driver training group2 (aged 18-24 years; n=269) 7,398 28.2 11.8 39.1 Young driver training group1 (aged 18-24 years; n=269) 7,398 56.3 23.5 78.3 PROV Young drivers1 (aged 18-24 years; n=345) 9,785 268.0 185.5 87.1 PROV Young drivers3 (aged 18-24 years; n=271) 12,317 23.4 12.2 48.2 Lease car drivers4 (aged 18-64 years; n=422) 9,785 9.2 5.0 32.1 Note 1: Assumed reported accident period 1 year; 2: Assumed reported accident period 2 years; 3: Only those that drive more than 1000 km per year. 4: Reported accident period 3 years.
  • 29. Table 3. Self-reported behaviour regarding risk factors Young Lease car PROV drivers drivers young (n=269) (n=422) drivers(n=345) Mean S Mean S Mean S D D D Alcohol: Frequent and intensive use of alcohol .39 .23 .42 .19 - - (2 items, alpha=.54) Use of adversary alcohol strategies .05 .16 .33 .32 - - (11 items, alpha=.92) Distractions and concentration Loss of concentration when driving .09 .60 .09 .10 - - (13 items, alpha=.81) Anger: Shows serious anger to other traffic participants who commit violations (2 items, .02 .12 .02 .13 .01 .13 alpha=.64) Shows irritation to other traffic participants .18 .26 .16 .24 .13 .23 who commit violations (4 items, alpha=.61) Withholds anger towards traffic participants .55 .30 .56 .3 .43 .26 who commit violations (4 items, alpha=.59) Stays calm towards traffic participants who .75 .34 .79 .32 - - commit violations (2 items, alpha=.45) Speed and lane preference: Violation of speed limits on various roads (50km/h; 80km/hl 120km/h roads) and .14 .11 .17 .14 - - circumstances (dry-rainy, calm-busy, heavy traffic; 9 items, alpha=.93) Violation of speed limits on various roads under favorable circumstances (dry, calm .23 16 .26 18 .20 .19 traffic 3 items, alpha=.65) Driving on the outer lane of motorways under .33 .23 .39 .27 - - various circumstances (5 items, alpha=.78) Fatigue: Degree of fatigue during driving (5 items, .09 .09 .11 .12 - - alpha=.73) Note: 0.-.16: rarely; .17-.33: occasionally; .34-.50: sometimes; .51-.67: rather often; .68-.84: very often; . 85-1.0: most of the times
  • 30. Table 4. driving proficiency as reported on the Driver Self-Assessment Young Lease car drivers drivers (n=1226) (n=579) Mean SD Mean SD - Committing driving errors affecting safety, traffic flow, social driving, and vehicle control (12 items, .21 .11 .17 .13 alpha=.74) - Driving in a hurry (4 items, alpha=.63) .36 .18 .32 .18 - Being irritated by behaviour of other participants .64 .23 .49 .25 (2 items, alpha=.66) - Perceived quality of one’s own driving behaviour .73 .08 .76 .09 (43 items, alpha=.80) Note: 0.-.16: rarely; .17-.33: occasionally; .34-.50: sometimes; .51-.67: rather often; .68-0.84: very often; .85-.1most of the times Table 5. Scores for situation awareness Young drivers Lease car drivers (n=265) (n=118) Mean SD Mean SD Subscale ‘Localizing hazards’ (8 items, alpha=.63) 7.4 1.0 7.1 1.2
  • 31. Traffic Situation 1. Basis 3. Action 3. Action • Knowledge execution execution • Skills • Attitudes 4. Consequences • Moods • Emotions 2.Perception • Personality traits & decision making Competing tasks (e.g. phoning, interacting with peers) Figure 1. driving as a process of decision making (Roelofs et al, 2008)
  • 32. Pretest: Posttest: DRA, DSA SAT Driver Profiling Driver coaching • Risk factors program • Driving behaviour Coached Meeting coach - driver trip Individual plan • Personalized for further learning objectives Group development for driver discussion Track experience Figure 2. Schematic overview of the Drive Xperience programme
  • 33. Comments (be specific!) 1. Close encounter crossing Renault on N348 1 2. Very near to driver in front on motorway A12 2 Light grey: felt comfortable Middle grey: felt uncomfortable Dark grey: afraid that things would go wring Figure 3. observational form for passengers to be used during the coached trip