SlideShare una empresa de Scribd logo
1 de 4
Descargar para leer sin conexión
Top level analysis of 2008/09 HESA data
Good news as student numbers continue
to rise…
The 2008–09 HESA data reveals that there were a total of 415,585 non-UK domiciled students in UK
HE institutions in 2008–09. This represents an increase of 6.7 per cent on the previous year and a
growth of 38 per cent over the last six years. The number of non-EU domiciled students stands at
277,800 (growth of 7.9 per cent on 2007–08).

Where do our international students come from?
China is still the number one sending country, while Saudi Arabia’s significant 45 per cent growth secures it a place in the top-ten.


Top 10 non-EU sending countries

    Rank              Country                                             2008-09               2007-08              % Growth
    1                 China                                               50,460                49,090               2.8%
    2                 India                                               36,105                27,905               29.4%
    3                 United States                                       21,815                21,985               -0.8%
    4                 Nigeria                                             15,105                12,680               19.1%
    5                 Malaysia                                            13,355                12,435               7.4%
    6                 Pakistan                                            10,190                9,840                3.6%
    7                 Hong Kong                                           10,080                10,250               -1.7%
    8                 Canada                                              6,475                 6,070                6.7%
    9                 Taiwan                                              5,885                 6,390                -7.9%
    10                Saudi Arabia                                        5,640                 3,880                45.4%


I       China remains the major sending country to the UK with over 50,000 students – an increase of 2.8 per cent on 2007–08.
        This is the first positive growth from China since 2004–05.

I       India continues to grow quickly with over 36,000 students in the UK in 2008–09. This is an increase of 29.4 per cent on
        2007–08 and is a huge 189 per cent growth since 2002–03.

I       There has been a slight decline in the number of students from the USA, Hong Kong and Taiwan.
I     Saudi Arabia has risen from 13th place to 10th place, with a year on year growth of 45.4 per cent.

I     There are now 1 countries (seven non-EU countries) that send over 10,000 students to the UK.
                     1

I     Just three countries – China, India, USA – account for 40 per cent of all non-EU students in UK HE.


Education UK Partnership countries
In addition to India and Nigeria, particularly strong growth was reported in students coming to the UK from Russia, Turkey,
UAE and Vietnam.


    Country                   2008-09                   2007-08                  % Growth                   Absolute
                                                                                 2007-08 to                 growth 2007-08
                                                                                 2008-09                    to 2008-09
    China                     50,460                    49,090                   2.8%                       1,370
    India                     36,105                    27,905                   29.4%                      8,200
    United States             21,815                    21,985                   -0.8%                      -170
    Nigeria                   15,105                    12,680                   19.1%                      2,425
    Malaysia                  13,355                    12,435                   7.4%                       920
    Pakistan                  10,190                    9,840                    3.6%                       350
    Hong Kong                 10,080                    10,250                   -1.6%                      -170
    Thailand                  5,160                     4,765                    8.3%                       395
    Korea                     4,840                     4,585                    5.5%                       255
    Japan                     4,505                     5,235                    -13.9%                     -730
    Singapore                 3,515                     3,205                    9.6%                       310
    Russia                    3,115                     2,810                    10.9%                      305
    Turkey                    3,045                     2,690                    13.3%                      355
    UAE                       2,825                     2,425                    16.5%                      400
    Vietnam                   2,150                     1,880                    14.5%                      270
    Mexico                    1,755                     1,745                    0.5%                       10
    Brazil                    1,580                     1,495                    5.6%                       85
    Indonesia                 1,120                     1,030                    8.5%                       90
Countries recording significant growth
The graph below shows a selection of non-EU sending countries, which have recorded a significant growth over the last year
(i.e. more than 15 per cent growth and sending more than 1,000 students).

These countries are predominantly from the regions of Middle East and North Africa and Central and South Asia.


                Growth        2007/8       2008/9

                    700
  Philippines
                     1125                                                                                                         61.00%
                     1230
 Kazakhstan
                      1585                                                                                                        28.90%
                     1340
      Kuwait
                      1615                                                                                                        20.40%
                      1825
        Libya
                       2335                                                                                                       27.90%
                         2425
         UAE              2825
                                                                                                                                  16.50%
                         2675
         Iran
                          3165                                                                                                    18.30%
 Bangladesh                 2955
                                   3625
                                                                                                                                  22.70%
                                   3880
Saudi Arabia
                                    5640
                                                                                                                                  45.40%
                                                    12680
      Nigeria
                                                            15105
                                                                                                                                  19.10%
                                                                                              27805
        India
                                                                                                                     36105        29.40%

                0        5000             10000     15000           20000       25000        30000         35000         40000


Growth in first year student numbers
155,890 non-EU first year students enrolled in UK HE in 2008–09. This is an increase of 13.1 per cent on 2007–08.

First year students from India grew by 40.9 per cent, Nigeria saw a 27.5 per cent increase, Saudi Arabia 71.8 per cent, Thailand
16.8 per cent, Bangladesh 37.8 per cent.


What level are they studying at?
First Degree candidates are the largest group of non-EU students (38 per cent, 155,610 students) closely followed by Post
Graduate Taught (36 per cent, 150,975). Other Undergraduate (54,275) and Postgraduate Research (54,730) each account for
just over 13 per cent.
                                                                       180000
How does this compare to previous years?
                                                                       160000                                                155610
2002-03 – 2008–09 witnessed a steady increase at
                                                                       140000
Postgraduate Taught and First Degree level. Postgraduate
                                                                                 109260                                    150975
Research numbers have also risen over the same period but              120000
less significantly. The total for Other Undergraduate has              100000
plateaued since 2006–07.                                                         100505
                                                                       80000

                                                                       60000                                                 54730
                    Other
                                                                                  50270
                Undergraduate
                                                                       40000                                                 54275
                   13.1%
                                           Postgraduate                           40920
   Postgraduate                            Taught 36.3%                20000
   Research 13.2%
                                                                            0
                                                                                2002/03 2003/04 2004/05 2005/06 2006/07 2007/08 2008/09


                First Degree 37.4%                                                   Postgraduate Research          Postgraduate Taught
                                                                                     First Degree        Other Undergraduate
What subjects are they studying?
The most popular subject areas for non-EU students in 08-09 continue to be Business and Administrative studies (81,245
students), and Engineering and Technology (37,600 students).

Focussing once more on new (first year) students by subject area, it appears that the real growth area is Computer Science; a
35.1per cent increase compared to 2007–08, moving from fifth place to fourth place. A sizeable proportion of these new
students were recruited from India; the number of first year Indian students studying Computer Science courses more than
doubled in 2008–09 compared to 2007–08. In addition, Law moved up from seventh place to sixth, Education 1 place to
                                                                                                          1th
tenth and Historical and Philosophical studies 13th to 12th, representing a significant increase in first year students.

A wealth of data at your fingertips
Members can use our online interactive HESA data-mining tool to produce further statistical reports and charts in a user-friendly
format. This allows you to analyse, cross-tabulate and drill-down to investigate where students are coming from and what they
are studying. To use the tool, please visit: http://www.britishcouncil.org/eumd/statistics/

Our holistic EMI portfolio also includes the following innovations:
Student Decision Making (SDM) – A global on-line survey capturing aspirational data from over 100,000 prospective
applicants looking to study overseas, thereby empowering a UK institution to tailor their marketing approaches accordingly.
Members can access primary data collected by our SDM survey in a real-time, online, interactive, data-mining tool and via
tailor-made automated reports.

Early reporting of international student data – This is an initiative to improve the immediacy of international student data. It
allows for an instant insight into enrolment trends of other institutions by country, by subject, by year of course.

To find out more about how you can use these tools and more, please visit: http://www.britishcouncil.org/eumd-emi-data-
products.htm


Contact us
We hope that you have found this summary useful. If you have any
questions or comments, please get in touch.

Education UK Partnership
British Council
Bridgewater House
58 Whitworth Street
Manchester M1 6BB
United Kingdom

T: +44 (0) 161 957 7069

E: education.market.intelligence@britishcouncil.org
www.britishcouncil.org/eumd-partnership.htm

Más contenido relacionado

Destacado

visual CV, Ilya Talovskiy
visual CV, Ilya Talovskiyvisual CV, Ilya Talovskiy
visual CV, Ilya TalovskiyIlya Talovskiy
 
Proposed Rule Text from DHS on H4 Visa
Proposed Rule Text from DHS on H4 VisaProposed Rule Text from DHS on H4 Visa
Proposed Rule Text from DHS on H4 Visahappyschools
 
Pole product presentation 25.05.2015
Pole product presentation 25.05.2015Pole product presentation 25.05.2015
Pole product presentation 25.05.2015Anar Akbarli
 
Email marketing best practices + benchmark data - final
Email marketing   best practices + benchmark data - finalEmail marketing   best practices + benchmark data - final
Email marketing best practices + benchmark data - finalHubSpot
 

Destacado (7)

visual CV, Ilya Talovskiy
visual CV, Ilya Talovskiyvisual CV, Ilya Talovskiy
visual CV, Ilya Talovskiy
 
Proposed Rule Text from DHS on H4 Visa
Proposed Rule Text from DHS on H4 VisaProposed Rule Text from DHS on H4 Visa
Proposed Rule Text from DHS on H4 Visa
 
Pole product presentation 25.05.2015
Pole product presentation 25.05.2015Pole product presentation 25.05.2015
Pole product presentation 25.05.2015
 
Tissot
TissotTissot
Tissot
 
Email marketing best practices + benchmark data - final
Email marketing   best practices + benchmark data - finalEmail marketing   best practices + benchmark data - final
Email marketing best practices + benchmark data - final
 
Мұғалім портфолиосы
Мұғалім портфолиосыМұғалім портфолиосы
Мұғалім портфолиосы
 
Cashbox EOI
Cashbox EOICashbox EOI
Cashbox EOI
 

Más de ESEI International Business School (14)

Stock market presentation
Stock market presentationStock market presentation
Stock market presentation
 
ESEI_Personal branding seminar
ESEI_Personal branding seminarESEI_Personal branding seminar
ESEI_Personal branding seminar
 
Esei_Your image and you
Esei_Your image and youEsei_Your image and you
Esei_Your image and you
 
ESEI - Creating a powerful CV and Cover Letter
ESEI - Creating a powerful CV and Cover LetterESEI - Creating a powerful CV and Cover Letter
ESEI - Creating a powerful CV and Cover Letter
 
Syllabus B Sc Hons In Business Administration
Syllabus  B Sc   Hons  In  Business  AdministrationSyllabus  B Sc   Hons  In  Business  Administration
Syllabus B Sc Hons In Business Administration
 
Syllabus International Advanced Diploma In Business
Syllabus  International  Advanced   Diploma In  BusinessSyllabus  International  Advanced   Diploma In  Business
Syllabus International Advanced Diploma In Business
 
Syllabus International Diploma In Business
Syllabus  International  Diploma In  BusinessSyllabus  International  Diploma In  Business
Syllabus International Diploma In Business
 
Uo W B Sc B A Programme Sheet E S E I
Uo W  B Sc  B A  Programme  Sheet  E S E IUo W  B Sc  B A  Programme  Sheet  E S E I
Uo W B Sc B A Programme Sheet E S E I
 
I A D B Programme Sheet E S E I 2
I A D B  Programme  Sheet  E S E I 2I A D B  Programme  Sheet  E S E I 2
I A D B Programme Sheet E S E I 2
 
I D B Programme Sheet E S E I
I D B  Programme  Sheet  E S E II D B  Programme  Sheet  E S E I
I D B Programme Sheet E S E I
 
Entrepreneurship
EntrepreneurshipEntrepreneurship
Entrepreneurship
 
Strategic Thinking
Strategic ThinkingStrategic Thinking
Strategic Thinking
 
Hesa Data 2009 2010 Summary
Hesa  Data 2009 2010 SummaryHesa  Data 2009 2010 Summary
Hesa Data 2009 2010 Summary
 
ESEI International Business School Presentation
ESEI International Business School PresentationESEI International Business School Presentation
ESEI International Business School Presentation
 

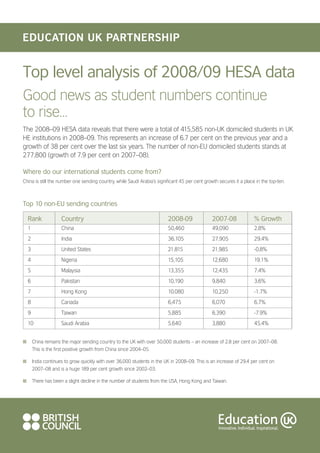
Hesa Data 2008 2009 Summary

  • 1. Top level analysis of 2008/09 HESA data Good news as student numbers continue to rise… The 2008–09 HESA data reveals that there were a total of 415,585 non-UK domiciled students in UK HE institutions in 2008–09. This represents an increase of 6.7 per cent on the previous year and a growth of 38 per cent over the last six years. The number of non-EU domiciled students stands at 277,800 (growth of 7.9 per cent on 2007–08). Where do our international students come from? China is still the number one sending country, while Saudi Arabia’s significant 45 per cent growth secures it a place in the top-ten. Top 10 non-EU sending countries Rank Country 2008-09 2007-08 % Growth 1 China 50,460 49,090 2.8% 2 India 36,105 27,905 29.4% 3 United States 21,815 21,985 -0.8% 4 Nigeria 15,105 12,680 19.1% 5 Malaysia 13,355 12,435 7.4% 6 Pakistan 10,190 9,840 3.6% 7 Hong Kong 10,080 10,250 -1.7% 8 Canada 6,475 6,070 6.7% 9 Taiwan 5,885 6,390 -7.9% 10 Saudi Arabia 5,640 3,880 45.4% I China remains the major sending country to the UK with over 50,000 students – an increase of 2.8 per cent on 2007–08. This is the first positive growth from China since 2004–05. I India continues to grow quickly with over 36,000 students in the UK in 2008–09. This is an increase of 29.4 per cent on 2007–08 and is a huge 189 per cent growth since 2002–03. I There has been a slight decline in the number of students from the USA, Hong Kong and Taiwan.
  • 2. I Saudi Arabia has risen from 13th place to 10th place, with a year on year growth of 45.4 per cent. I There are now 1 countries (seven non-EU countries) that send over 10,000 students to the UK. 1 I Just three countries – China, India, USA – account for 40 per cent of all non-EU students in UK HE. Education UK Partnership countries In addition to India and Nigeria, particularly strong growth was reported in students coming to the UK from Russia, Turkey, UAE and Vietnam. Country 2008-09 2007-08 % Growth Absolute 2007-08 to growth 2007-08 2008-09 to 2008-09 China 50,460 49,090 2.8% 1,370 India 36,105 27,905 29.4% 8,200 United States 21,815 21,985 -0.8% -170 Nigeria 15,105 12,680 19.1% 2,425 Malaysia 13,355 12,435 7.4% 920 Pakistan 10,190 9,840 3.6% 350 Hong Kong 10,080 10,250 -1.6% -170 Thailand 5,160 4,765 8.3% 395 Korea 4,840 4,585 5.5% 255 Japan 4,505 5,235 -13.9% -730 Singapore 3,515 3,205 9.6% 310 Russia 3,115 2,810 10.9% 305 Turkey 3,045 2,690 13.3% 355 UAE 2,825 2,425 16.5% 400 Vietnam 2,150 1,880 14.5% 270 Mexico 1,755 1,745 0.5% 10 Brazil 1,580 1,495 5.6% 85 Indonesia 1,120 1,030 8.5% 90
  • 3. Countries recording significant growth The graph below shows a selection of non-EU sending countries, which have recorded a significant growth over the last year (i.e. more than 15 per cent growth and sending more than 1,000 students). These countries are predominantly from the regions of Middle East and North Africa and Central and South Asia. Growth 2007/8 2008/9 700 Philippines 1125 61.00% 1230 Kazakhstan 1585 28.90% 1340 Kuwait 1615 20.40% 1825 Libya 2335 27.90% 2425 UAE 2825 16.50% 2675 Iran 3165 18.30% Bangladesh 2955 3625 22.70% 3880 Saudi Arabia 5640 45.40% 12680 Nigeria 15105 19.10% 27805 India 36105 29.40% 0 5000 10000 15000 20000 25000 30000 35000 40000 Growth in first year student numbers 155,890 non-EU first year students enrolled in UK HE in 2008–09. This is an increase of 13.1 per cent on 2007–08. First year students from India grew by 40.9 per cent, Nigeria saw a 27.5 per cent increase, Saudi Arabia 71.8 per cent, Thailand 16.8 per cent, Bangladesh 37.8 per cent. What level are they studying at? First Degree candidates are the largest group of non-EU students (38 per cent, 155,610 students) closely followed by Post Graduate Taught (36 per cent, 150,975). Other Undergraduate (54,275) and Postgraduate Research (54,730) each account for just over 13 per cent. 180000 How does this compare to previous years? 160000 155610 2002-03 – 2008–09 witnessed a steady increase at 140000 Postgraduate Taught and First Degree level. Postgraduate 109260 150975 Research numbers have also risen over the same period but 120000 less significantly. The total for Other Undergraduate has 100000 plateaued since 2006–07. 100505 80000 60000 54730 Other 50270 Undergraduate 40000 54275 13.1% Postgraduate 40920 Postgraduate Taught 36.3% 20000 Research 13.2% 0 2002/03 2003/04 2004/05 2005/06 2006/07 2007/08 2008/09 First Degree 37.4% Postgraduate Research Postgraduate Taught First Degree Other Undergraduate
  • 4. What subjects are they studying? The most popular subject areas for non-EU students in 08-09 continue to be Business and Administrative studies (81,245 students), and Engineering and Technology (37,600 students). Focussing once more on new (first year) students by subject area, it appears that the real growth area is Computer Science; a 35.1per cent increase compared to 2007–08, moving from fifth place to fourth place. A sizeable proportion of these new students were recruited from India; the number of first year Indian students studying Computer Science courses more than doubled in 2008–09 compared to 2007–08. In addition, Law moved up from seventh place to sixth, Education 1 place to 1th tenth and Historical and Philosophical studies 13th to 12th, representing a significant increase in first year students. A wealth of data at your fingertips Members can use our online interactive HESA data-mining tool to produce further statistical reports and charts in a user-friendly format. This allows you to analyse, cross-tabulate and drill-down to investigate where students are coming from and what they are studying. To use the tool, please visit: http://www.britishcouncil.org/eumd/statistics/ Our holistic EMI portfolio also includes the following innovations: Student Decision Making (SDM) – A global on-line survey capturing aspirational data from over 100,000 prospective applicants looking to study overseas, thereby empowering a UK institution to tailor their marketing approaches accordingly. Members can access primary data collected by our SDM survey in a real-time, online, interactive, data-mining tool and via tailor-made automated reports. Early reporting of international student data – This is an initiative to improve the immediacy of international student data. It allows for an instant insight into enrolment trends of other institutions by country, by subject, by year of course. To find out more about how you can use these tools and more, please visit: http://www.britishcouncil.org/eumd-emi-data- products.htm Contact us We hope that you have found this summary useful. If you have any questions or comments, please get in touch. Education UK Partnership British Council Bridgewater House 58 Whitworth Street Manchester M1 6BB United Kingdom T: +44 (0) 161 957 7069 E: education.market.intelligence@britishcouncil.org www.britishcouncil.org/eumd-partnership.htm