SlideShare una empresa de Scribd logo
1 de 18
EN UNA ENCUESTA QUE SE HIZO A 50
ESTUDIANTES SE LES PREGUNTO SI SABIAN
        QUE ERA LA BASURA.
SABE=A SABE=B
      NO

A    A        A           A         A
A    A        B           A         A
A    A        A           A         B
A    A        A           A         A
B    B        A           A         A
A    A        A           A         A
B    B        B           A         A
A    B        A           A         B
A    A        A           B         B
A    A        A           A         B

     ni       fi          Ni        fi          Fi          fi%        Fi%
SABE    38         0.76        38        0.76        0.76         76      76
NO SABE 12         0.24        50        0.24           1         24     100
                                            1
n              50
MINIMO         12
MAXIMO         38
RANGO          26
ANCHO DE CLASE 7
NRO DE INTERVALOS
                4


                                                              ni
                                                     38            ni


     ni                                                                  12
SABE    38
NO SABE 12                                      SABE
                                                                   NO SABE


                                                              fi
                                     0.8
     fi
SABE   0.76                          0.6
NOSABE 0.24                          0.4
                                                                                fi
                                     0.2
                                         0
                                          SABE                                 NOSABE
fi
              0.8
              0.6
              0.4
          1                                     fi
              0.2
                   0
                    SABE                    NOSABE


                                  Ni
              50
     Ni       40
SABE    38
              30
NOSABE 50
              20                                     Ni
              10
               0
                           SABE        NOSABE


                                  Fi
              1.2
                1
     Fi       0.8
SABE   0.76   0.6
NOSABE    1                                     Fi
              0.4
              0.2
                0
                 SABE                       NOSABE
4. ¿convives con la basura ?
    NO           NO             NO         NO            NO
    NO           SI             SI         NO            NO
    SI           NO             NO         NO            NO
    SI           SI             SI         SI            SI
    NO           SI             NO         SI            SI
    NO           SI             NO         NO            NO
    NO           NO             SI         NO            NO
    NO           SI             NO         NO            NO
    SI           SI             SI         NO            NO
    NO           NO             SI         SI            SI

                 ni             Ni          fi            Fi                   fi%   Fi%
    SI           20             20         0.4           0.4                   40     40
   NO            30             50         0.6            1                    60    100
  TOTAL          50                         1


                                          ni
                      40

                      30

                      20
                                                                     ni
                      10

                       0
                                Row 14              Row 15


Con respecto al grafico nos muestan que 20 personas si conviven con la basura y 30 personas
                                 no convive con la basura


                                          Ni
                       60
                       50
                       40
                       30
                                                                Ni
                       20
                       10
                        0
                       Row 14                                  Row 15


                                           fi
                      0.8
                      0.6
                      0.4
                                                                          fi
                      0.2
                       0
                                 Row 14              Row 15
fi
                    0.8
                    0.6
                    0.4
                                                                           fi
                    0.2
                      0
                                Row 14                     Row 15


                                            Fi
                    1.5

                      1

                    0.5                                               Fi

                      0
                     Row 14                                         Row 15


                                            fi%

                                40
                                                                    Row 14
                                                                    Row 15
                                                           60


Con respecto al grafico nos muestan que 60% de las personas si conviven con la basura y el
                       40% de las personas no convive con la basura

                                            Fi%
                                                  40

                                      100                           Row 14
                                                                    Row 15


                                      EDAD

J           J             J           J                J
J           A             J           A                J
J           J             J           J                A
J           J             J           J                J
J           J             A           J                J
A           J             J           J                J
J           J             A           J                J
J           J             J           J                J
J              A                     J              A               J
J              J                     J              J               J

                           ni             Ni            fi              Fi             fi%        Fi%
JOVEN                           42             42            0.84            0.84            84          84
ADULTO                           8             50            0.16               1            16         100
TOTAL                           50                              1


                                                ni
                50

                40

                30

                20                                                                ni

                10

                   0
                                     Row 113                  Row 114


     el grafico con demuestra que 42 encuestados son jovenes y 8 personas son
                                      adultos


                                               Ni
                52
                50
                48
                46
                44                                                                Ni
                42
                40
                38
                                 Row 113                      Row 114


                                               fi
                       1


                   0.5
                                                                             fi

                       0
                                     Row 113                 Row 114
    el grafico con demuestra que 0,84 de encuestados son jovenes y el 0,16 de los encuestados
                                           son adultos
Fi
                 1

             0.9

             0.8                                                Fi

             0.7
                       Row 113               Row 114


                                    fi%


                                                            Row 113
                                                            Row 114


el grafico con demuestra que el 84% de los encuestados son jovenes y el 16 %
                       de los encuestados son adultos


                                    Fi%


                                                            Row 113
                                                            Row 114


                                             SEXO
F           F              F            F              F
F           M              F            M              M
M           F              M            F              F
F           F              F            F              F
F           M              M            F              F
F           F              F            M              M
M           F              F            F              F
F           F              M            F              F
F           F              F            F              M
M           F              F            M              F

            ni             Ni           fi             Fi               fi%        Fi%
FEMENINO              36           36           0.72             0.72         72          72
MASCULINO             14           50           0.28                1         28         100
TOTAL                 50                           1
ni
                   40
                   30
                   20
                                                                        ni
                   10
                    0
                                Row 212             Row 213

 El grafico nos muestra que 36 personas son de sexo femenino y 14 personas son de sexo
                                       masculino


                                               Ni
                    60

                    40

                    20                                                  Ni

                     0
                    Row 212                                        Row 213


                                          fi
                  Row 213


                                                                   fi
                  Row 212


                            0   0.1 0.2 0.3 0.4 0.5 0.6 0.7 0.8

El grafico nos muestra que 0,72 de personas son de sexo femenino y el 0,28 de personas son
                                     de sexo masculino


                                          Fi
                   1.5
                    1
                   0.5                                        Fi
                    0
                   Row 212                               Row 213
1.5
                        1
                      0.5                                         Fi
                        0
                       Row 212                                 Row 213


                                           fi%

                                                              Row 212
                                                              Row 213


    El grafico nos muestra que el 72% de las personas encuestadas son de sexo femenino y 28%
                        de las personas encuestadas son de sexo masculino


                                           Fi%


                                                              Row 212
                                                              Row 213


                                        ESTADO CIVIL

S                S               S         S             S
S                C               S         S             C
S                S               S         S             S
C                S               C         S             S
S                S               S         C             V
S                C               S         S             S
S                S               S         S             S
C                S               S         V             S
S                S               C         S             S
S                S               S         S             S

                 ni              Ni        fi            Fi              fi%        Fi%
SOLTERO                     40        40           0.8             0.8         80          80
CASADO                       8        48          0.16            0.96         16          96
VIUDO                        2        50          0.04               1          4         100
TOTAL                       50                       1


                                       ni
            40

            30

            20
                                                                         ni
            10
ni
           40

           30

           20
                                                                        ni
           10

            0
                  Row 313         Row 314          Row 315

   el grafico nos muestra que 40 encuestados son solteros, 8 son casados y 2 son viudos


                                   Ni
       60
       50
       40
       30
                                                              Ni
       20
       10
        0
       Row 313                   Row 314                   Row 315


                                  fi
       1

     0.5
                                                                   fi

       0
                Row 313         Row 314          Row 315


el grafico nos muestra que el 0,8 encuestados son solteros, el 0,16 son casados y el 0,04 son
                                          viudos


                                  Fi
     1.5

      1

     0.5                                                      Fi

      0
     Row 313                   Row 314                     Row 315


                                  fi%

                                                           Row 313
                                                           Row 314
                                                           Row 315
fi%

                                                         Row 313
                                                         Row 314
                                                         Row 315


el grafico nos muestra que el 80% de los encuestados son solteros, el 16%de los encuestados
                     son casados y el 4% de lose encuestados son viudos


                               Fi%

                                                       Row 313
                                                       Row 314
                                                       Row 315
Encuesta sobre conocimientos de basura entre estudiantes

Más contenido relacionado

Destacado

2024 State of Marketing Report – by Hubspot
2024 State of Marketing Report – by Hubspot2024 State of Marketing Report – by Hubspot
2024 State of Marketing Report – by HubspotMarius Sescu
 
Everything You Need To Know About ChatGPT
Everything You Need To Know About ChatGPTEverything You Need To Know About ChatGPT
Everything You Need To Know About ChatGPTExpeed Software
 
Product Design Trends in 2024 | Teenage Engineerings
Product Design Trends in 2024 | Teenage EngineeringsProduct Design Trends in 2024 | Teenage Engineerings
Product Design Trends in 2024 | Teenage EngineeringsPixeldarts
 
How Race, Age and Gender Shape Attitudes Towards Mental Health
How Race, Age and Gender Shape Attitudes Towards Mental HealthHow Race, Age and Gender Shape Attitudes Towards Mental Health
How Race, Age and Gender Shape Attitudes Towards Mental HealthThinkNow
 
AI Trends in Creative Operations 2024 by Artwork Flow.pdf
AI Trends in Creative Operations 2024 by Artwork Flow.pdfAI Trends in Creative Operations 2024 by Artwork Flow.pdf
AI Trends in Creative Operations 2024 by Artwork Flow.pdfmarketingartwork
 
PEPSICO Presentation to CAGNY Conference Feb 2024
PEPSICO Presentation to CAGNY Conference Feb 2024PEPSICO Presentation to CAGNY Conference Feb 2024
PEPSICO Presentation to CAGNY Conference Feb 2024Neil Kimberley
 
Content Methodology: A Best Practices Report (Webinar)
Content Methodology: A Best Practices Report (Webinar)Content Methodology: A Best Practices Report (Webinar)
Content Methodology: A Best Practices Report (Webinar)contently
 
How to Prepare For a Successful Job Search for 2024
How to Prepare For a Successful Job Search for 2024How to Prepare For a Successful Job Search for 2024
How to Prepare For a Successful Job Search for 2024Albert Qian
 
Social Media Marketing Trends 2024 // The Global Indie Insights
Social Media Marketing Trends 2024 // The Global Indie InsightsSocial Media Marketing Trends 2024 // The Global Indie Insights
Social Media Marketing Trends 2024 // The Global Indie InsightsKurio // The Social Media Age(ncy)
 
Trends In Paid Search: Navigating The Digital Landscape In 2024
Trends In Paid Search: Navigating The Digital Landscape In 2024Trends In Paid Search: Navigating The Digital Landscape In 2024
Trends In Paid Search: Navigating The Digital Landscape In 2024Search Engine Journal
 
5 Public speaking tips from TED - Visualized summary
5 Public speaking tips from TED - Visualized summary5 Public speaking tips from TED - Visualized summary
5 Public speaking tips from TED - Visualized summarySpeakerHub
 
ChatGPT and the Future of Work - Clark Boyd
ChatGPT and the Future of Work - Clark Boyd ChatGPT and the Future of Work - Clark Boyd
ChatGPT and the Future of Work - Clark Boyd Clark Boyd
 
Getting into the tech field. what next
Getting into the tech field. what next Getting into the tech field. what next
Getting into the tech field. what next Tessa Mero
 
Google's Just Not That Into You: Understanding Core Updates & Search Intent
Google's Just Not That Into You: Understanding Core Updates & Search IntentGoogle's Just Not That Into You: Understanding Core Updates & Search Intent
Google's Just Not That Into You: Understanding Core Updates & Search IntentLily Ray
 
Time Management & Productivity - Best Practices
Time Management & Productivity -  Best PracticesTime Management & Productivity -  Best Practices
Time Management & Productivity - Best PracticesVit Horky
 
The six step guide to practical project management
The six step guide to practical project managementThe six step guide to practical project management
The six step guide to practical project managementMindGenius
 
Beginners Guide to TikTok for Search - Rachel Pearson - We are Tilt __ Bright...
Beginners Guide to TikTok for Search - Rachel Pearson - We are Tilt __ Bright...Beginners Guide to TikTok for Search - Rachel Pearson - We are Tilt __ Bright...
Beginners Guide to TikTok for Search - Rachel Pearson - We are Tilt __ Bright...RachelPearson36
 

Destacado (20)

2024 State of Marketing Report – by Hubspot
2024 State of Marketing Report – by Hubspot2024 State of Marketing Report – by Hubspot
2024 State of Marketing Report – by Hubspot
 
Everything You Need To Know About ChatGPT
Everything You Need To Know About ChatGPTEverything You Need To Know About ChatGPT
Everything You Need To Know About ChatGPT
 
Product Design Trends in 2024 | Teenage Engineerings
Product Design Trends in 2024 | Teenage EngineeringsProduct Design Trends in 2024 | Teenage Engineerings
Product Design Trends in 2024 | Teenage Engineerings
 
How Race, Age and Gender Shape Attitudes Towards Mental Health
How Race, Age and Gender Shape Attitudes Towards Mental HealthHow Race, Age and Gender Shape Attitudes Towards Mental Health
How Race, Age and Gender Shape Attitudes Towards Mental Health
 
AI Trends in Creative Operations 2024 by Artwork Flow.pdf
AI Trends in Creative Operations 2024 by Artwork Flow.pdfAI Trends in Creative Operations 2024 by Artwork Flow.pdf
AI Trends in Creative Operations 2024 by Artwork Flow.pdf
 
Skeleton Culture Code
Skeleton Culture CodeSkeleton Culture Code
Skeleton Culture Code
 
PEPSICO Presentation to CAGNY Conference Feb 2024
PEPSICO Presentation to CAGNY Conference Feb 2024PEPSICO Presentation to CAGNY Conference Feb 2024
PEPSICO Presentation to CAGNY Conference Feb 2024
 
Content Methodology: A Best Practices Report (Webinar)
Content Methodology: A Best Practices Report (Webinar)Content Methodology: A Best Practices Report (Webinar)
Content Methodology: A Best Practices Report (Webinar)
 
How to Prepare For a Successful Job Search for 2024
How to Prepare For a Successful Job Search for 2024How to Prepare For a Successful Job Search for 2024
How to Prepare For a Successful Job Search for 2024
 
Social Media Marketing Trends 2024 // The Global Indie Insights
Social Media Marketing Trends 2024 // The Global Indie InsightsSocial Media Marketing Trends 2024 // The Global Indie Insights
Social Media Marketing Trends 2024 // The Global Indie Insights
 
Trends In Paid Search: Navigating The Digital Landscape In 2024
Trends In Paid Search: Navigating The Digital Landscape In 2024Trends In Paid Search: Navigating The Digital Landscape In 2024
Trends In Paid Search: Navigating The Digital Landscape In 2024
 
5 Public speaking tips from TED - Visualized summary
5 Public speaking tips from TED - Visualized summary5 Public speaking tips from TED - Visualized summary
5 Public speaking tips from TED - Visualized summary
 
ChatGPT and the Future of Work - Clark Boyd
ChatGPT and the Future of Work - Clark Boyd ChatGPT and the Future of Work - Clark Boyd
ChatGPT and the Future of Work - Clark Boyd
 
Getting into the tech field. what next
Getting into the tech field. what next Getting into the tech field. what next
Getting into the tech field. what next
 
Google's Just Not That Into You: Understanding Core Updates & Search Intent
Google's Just Not That Into You: Understanding Core Updates & Search IntentGoogle's Just Not That Into You: Understanding Core Updates & Search Intent
Google's Just Not That Into You: Understanding Core Updates & Search Intent
 
How to have difficult conversations
How to have difficult conversations How to have difficult conversations
How to have difficult conversations
 
Introduction to Data Science
Introduction to Data ScienceIntroduction to Data Science
Introduction to Data Science
 
Time Management & Productivity - Best Practices
Time Management & Productivity -  Best PracticesTime Management & Productivity -  Best Practices
Time Management & Productivity - Best Practices
 
The six step guide to practical project management
The six step guide to practical project managementThe six step guide to practical project management
The six step guide to practical project management
 
Beginners Guide to TikTok for Search - Rachel Pearson - We are Tilt __ Bright...
Beginners Guide to TikTok for Search - Rachel Pearson - We are Tilt __ Bright...Beginners Guide to TikTok for Search - Rachel Pearson - We are Tilt __ Bright...
Beginners Guide to TikTok for Search - Rachel Pearson - We are Tilt __ Bright...
 

Encuesta sobre conocimientos de basura entre estudiantes

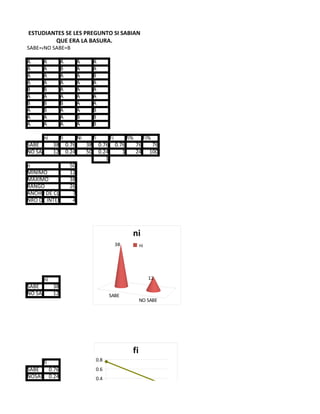
  • 1. EN UNA ENCUESTA QUE SE HIZO A 50 ESTUDIANTES SE LES PREGUNTO SI SABIAN QUE ERA LA BASURA. SABE=A SABE=B NO A A A A A A A B A A A A A A B A A A A A B B A A A A A A A A B B B A A A B A A B A A A B B A A A A B ni fi Ni fi Fi fi% Fi% SABE 38 0.76 38 0.76 0.76 76 76 NO SABE 12 0.24 50 0.24 1 24 100 1 n 50 MINIMO 12 MAXIMO 38 RANGO 26 ANCHO DE CLASE 7 NRO DE INTERVALOS 4 ni 38 ni ni 12 SABE 38 NO SABE 12 SABE NO SABE fi 0.8 fi SABE 0.76 0.6 NOSABE 0.24 0.4 fi 0.2 0 SABE NOSABE
  • 2. fi 0.8 0.6 0.4 1 fi 0.2 0 SABE NOSABE Ni 50 Ni 40 SABE 38 30 NOSABE 50 20 Ni 10 0 SABE NOSABE Fi 1.2 1 Fi 0.8 SABE 0.76 0.6 NOSABE 1 Fi 0.4 0.2 0 SABE NOSABE
  • 3. 4. ¿convives con la basura ? NO NO NO NO NO NO SI SI NO NO SI NO NO NO NO SI SI SI SI SI NO SI NO SI SI NO SI NO NO NO NO NO SI NO NO NO SI NO NO NO SI SI SI NO NO NO NO SI SI SI ni Ni fi Fi fi% Fi% SI 20 20 0.4 0.4 40 40 NO 30 50 0.6 1 60 100 TOTAL 50 1 ni 40 30 20 ni 10 0 Row 14 Row 15 Con respecto al grafico nos muestan que 20 personas si conviven con la basura y 30 personas no convive con la basura Ni 60 50 40 30 Ni 20 10 0 Row 14 Row 15 fi 0.8 0.6 0.4 fi 0.2 0 Row 14 Row 15
  • 4. fi 0.8 0.6 0.4 fi 0.2 0 Row 14 Row 15 Fi 1.5 1 0.5 Fi 0 Row 14 Row 15 fi% 40 Row 14 Row 15 60 Con respecto al grafico nos muestan que 60% de las personas si conviven con la basura y el 40% de las personas no convive con la basura Fi% 40 100 Row 14 Row 15 EDAD J J J J J J A J A J J J J J A J J J J J J J A J J A J J J J J J A J J J J J J J
  • 5. J A J A J J J J J J ni Ni fi Fi fi% Fi% JOVEN 42 42 0.84 0.84 84 84 ADULTO 8 50 0.16 1 16 100 TOTAL 50 1 ni 50 40 30 20 ni 10 0 Row 113 Row 114 el grafico con demuestra que 42 encuestados son jovenes y 8 personas son adultos Ni 52 50 48 46 44 Ni 42 40 38 Row 113 Row 114 fi 1 0.5 fi 0 Row 113 Row 114 el grafico con demuestra que 0,84 de encuestados son jovenes y el 0,16 de los encuestados son adultos
  • 6. Fi 1 0.9 0.8 Fi 0.7 Row 113 Row 114 fi% Row 113 Row 114 el grafico con demuestra que el 84% de los encuestados son jovenes y el 16 % de los encuestados son adultos Fi% Row 113 Row 114 SEXO F F F F F F M F M M M F M F F F F F F F F M M F F F F F M M M F F F F F F M F F F F F F M M F F M F ni Ni fi Fi fi% Fi% FEMENINO 36 36 0.72 0.72 72 72 MASCULINO 14 50 0.28 1 28 100 TOTAL 50 1
  • 7. ni 40 30 20 ni 10 0 Row 212 Row 213 El grafico nos muestra que 36 personas son de sexo femenino y 14 personas son de sexo masculino Ni 60 40 20 Ni 0 Row 212 Row 213 fi Row 213 fi Row 212 0 0.1 0.2 0.3 0.4 0.5 0.6 0.7 0.8 El grafico nos muestra que 0,72 de personas son de sexo femenino y el 0,28 de personas son de sexo masculino Fi 1.5 1 0.5 Fi 0 Row 212 Row 213
  • 8. 1.5 1 0.5 Fi 0 Row 212 Row 213 fi% Row 212 Row 213 El grafico nos muestra que el 72% de las personas encuestadas son de sexo femenino y 28% de las personas encuestadas son de sexo masculino Fi% Row 212 Row 213 ESTADO CIVIL S S S S S S C S S C S S S S S C S C S S S S S C V S C S S S S S S S S C S S V S S S C S S S S S S S ni Ni fi Fi fi% Fi% SOLTERO 40 40 0.8 0.8 80 80 CASADO 8 48 0.16 0.96 16 96 VIUDO 2 50 0.04 1 4 100 TOTAL 50 1 ni 40 30 20 ni 10
  • 9. ni 40 30 20 ni 10 0 Row 313 Row 314 Row 315 el grafico nos muestra que 40 encuestados son solteros, 8 son casados y 2 son viudos Ni 60 50 40 30 Ni 20 10 0 Row 313 Row 314 Row 315 fi 1 0.5 fi 0 Row 313 Row 314 Row 315 el grafico nos muestra que el 0,8 encuestados son solteros, el 0,16 son casados y el 0,04 son viudos Fi 1.5 1 0.5 Fi 0 Row 313 Row 314 Row 315 fi% Row 313 Row 314 Row 315
  • 10. fi% Row 313 Row 314 Row 315 el grafico nos muestra que el 80% de los encuestados son solteros, el 16%de los encuestados son casados y el 4% de lose encuestados son viudos Fi% Row 313 Row 314 Row 315