
Recomendados
Más contenido relacionado
La actualidad más candente
La actualidad más candente (20)
Destacado
Destacado (20)
Similar a Bars
Similar a Bars (20)
Bars
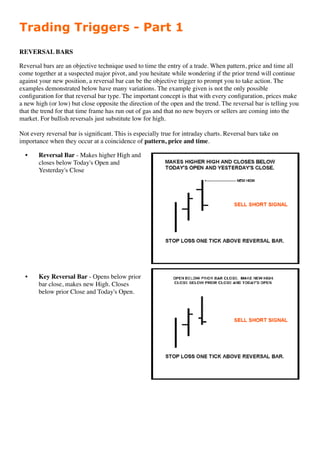
- 1. Trading Triggers - Part 1 REVERSAL BARS Reversal bars are an objective technique used to time the entry of a trade. When pattern, price and time all come together at a suspected major pivot, and you hesitate while wondering if the prior trend will continue against your new position, a reversal bar can be the objective trigger to prompt you to take action. The examples demonstrated below have many variations. The example given is not the only possible configuration for that reversal bar type. The important concept is that with every configuration, prices make a new high (or low) but close opposite the direction of the open and the trend. The reversal bar is telling you that the trend for that time frame has run out of gas and that no new buyers or sellers are coming into the market. For bullish reversals just substitute low for high. Not every reversal bar is significant. This is especially true for intraday charts. Reversal bars take on importance when they occur at a coincidence of pattern, price and time. • Reversal Bar - Makes higher High and closes below Today's Open and Yesterday's Close • Key Reversal Bar - Opens below prior bar close, makes new High. Closes below prior Close and Today's Open.
- 2. Outside Key Reversal Bar - Opens below prior bar close, makes new High. Closes below prior Close and Today's Open. Signal Bar - Opens above prior Close, makes new High. Closes below Today's Open
- 3. Gap Signal Bar - Opens above prior Close, makes new High. Closes below Today's Open but Gap is not filled. Snap Back Reversal Bar - Day 1 makes new High, opens bottom 1/3 of the bar, closes top 1/3. Day 2 opens top 1/3 of the bar, closes bottom 1/3, does not have to make new High.
- 4. Reversal Confirmation - First day that Close is below Open. Better signal if it makes lower Low.
- 5. Trading Triggers - Part 2 CONTINUATION BARS Not every major pivot point is marked by a reversal bar. Continuation set-ups can still get you in a trade relatively close to the pivot point. Continuation bars are easily identified on a bar or candlestick chart. They always start with either an inside bar or an outside bar. Inside Bar - Today's high and low do not exceed yesterday's high and low. Outside Bar - Today's high and low both exceed yesterday's high and low. Inside Bar Outside Bar
- 6. Outside Plus Bar STOP LOSSES Losses are part and parcel of trading. Successful traders learn to manage their losses, or shortly find something else to occupy their time. Trade entries are relatively easy. You have an objective set of criteria and when those conditions are met you enter the trade. Stop losses are more difficult because now you are in the trade. The cool hand that pulled the trigger to enter is now firmly wedged between the rock of fear and the hard place of greed. Just a few ideas for objective stop loss points. There are many more. Pattern stops occur when price moves to an extreme that negates the working Elliott Wave scenario. For example, a Wave 2 entry is stopped out if prices violate the pivot price that initiated the swing (Wave Zero). All the pattern stops that we use are set out in the Trading Signals section. Robert Miner, a successful trader and teacher, posits that three, two and one day bar extremes are logical stops. For example, for a long trade that is in the early stages of a Wave 3, the lowest low of the most recent three daily bars (including today) is an objective stop loss point. As Wave 3 progresses into its later stages the stop is moved to two bars or even to one bar. Miner does not count inside bars when computing the extremes. Another method presented by Williams that ties into Miner's one day stop is the Zone Stop. When price bars have run for five consecutive bars in the same zone (shown as five consecutive red or green bars) place a one day stop and move it every day until it gets hit. The important concept is to let the market, not your emotions, take you out of the trade - with a profit if the trade works out for you, and with a manageable loss if it does not. You don't know what the market is going to do next. Don't anticipate. You'll experience a lot less stress and probably make more money too.
- 7. When Disaster Strikes… Holding trades overnight has certain benefits and risks. We consider it a necessary part of a trading plan to have a "Wealth Building Account" for swing and core trades, which would all be overnight holds. So following your trading plan and playing the proper share size are very important. Properly handled, over time the benefits should outweigh the risks. However, no matter how careful you are, you will have a morning where a position you have is gapping open against you. Remember, overnight there are no stops. Let us say you are long XYZ at $30.00, and at 7:00 a.m. EST the next morning company XYZ makes some announcements. Let us say they are going to miss their next earnings number, and that the CEO just resigned, and that they suspect they have accounting problems. There is a good chance (about 99.99%) that when trading starts the next morning at 8:00 a.m. EST (pre- market trading starts with ECNs at this time) that your stock will be trading much lower. Let's say at 8:00 it starts trading at $26.00. From 8:00-9:30 it ranges from $26.00 - $25.00. Then at 9:00 it opens at 25.10. It will not matter that you have a stop in place at $28.50. During pre-market, stops are not in effect. Then when the market opens, your stop will be filled (if it is GTC, or if you re-entered it at open) at the best price at the time, $25.10, not your desired price of $28.50. So, how do you handle these 'disaster' situations? Here are some tips to put the odds in your favor to manage these situations in the best way over the long term: First, do not panic. Easy to say, but hard to do. However, it will not be hard to do if you have a strategy in place out for these situations. Second, ignore the pre-market trading. From 8:00 until 9:30 only ECNs are trading; some stocks don't trade at all. If your stock is gapping down like this, it will likely be trading, but will likely be trading erratically. Third, when it opens officially at 9:30 EST, do nothing for five minutes. That is right, just watch it. After five minutes, mark off the low and put a stop for half your shares $.05-.10 under that five-minute low. Fourth, let it trade for 30 minutes. Then put a stop for the other half of your shares $.05-.10 under that 30- minute low. At this point, if the stock did not violate the five-minute low, you will still have all your shares, half with a stop under the five-minute low, half under the 30-minute low. You will find on many occasions, that you may still have all your shares, or at least half. Often, after a large gap, the opening half hour puts in the lows for the upcoming days. If your shares do stop, you are usually risking a relatively small amount extra. From there, you can treat the trade as a swing with a one-day trailing stop, or the stock may rebound to prior levels and you can follow your prior plan. While the example given was for a gap down on a long position, the exact same rules hold true for gapping up on a short position. Use 5- and 30-minute highs as stops. Having this as your plan for disaster will help you minimize the losses over the long term.