SlideShare una empresa de Scribd logo
1 de 10
Descargar para leer sin conexión
Reconciliation of GAAP Financial Measures to Non-GAAP Financial Measures
                                                   March 2004 Quarter


                                                                                                                  Three
                                                                                                               Months Ended
Operating Expenses                                                                                              March 31,
                                                                                                           2004               2003
(in millions)
Operating expenses                                                                                             $3,680            $3,690
Less: fuel expense                                                                                               (574)             (511)
Unusual item:
    Pension benefits for 2002 workforce reductions                                                                -                 (43)
Operating expenses - excluding fuel expense and unusual item                                                   $3,106            $3,136
Year over year change                                                                                           -1.0%


                                                                                                                  Three
                                                                                                               Months Ended
Mainline - Operating Expenses                                                                                   March 31,
                                                                                                           2004               2003
(in millions)
Operating expenses                                                                                             $3,165            $3,236
Less: fuel expense                                                                                               (470)             (424)
Unusual item:
    Pension benefits for 2002 workforce reductions                                                                -                 (43)
Operating expenses - excluding fuel expense and unusual item                                                   $2,695            $2,768
Year over year change                                                                                           -2.7%


                                                                                                                  Three
                                                                                                               Months Ended
CASM and Fuel Price Neutralized CASM                                                                            March 31,
                                                                                                           2004               2003
(in cents, except where noted)
Operating expenses (millions)                                                                                  $3,680            $3,690
ASMs (millions)                                                                                                34,363            33,204
CASM                                                                                                            10.71              11.11
Less: fuel expense                                                                                              (1.67)
                                                          (1)
Plus: current year fuel gallons x prior year fuel price                                                          1.52
Fuel price neutralized CASM                                                                                     10.56
vs. March 2003 quarter CASM                                                                                     11.11
Change                                                                                                          -4.9%

CASM (see above)                                                                                                10.71             11.11
Unusual item:
 Pension benefits for 2002 workforce reductions                                                                   -               (0.13)
CASM - excluding unusual item (2)                                                                               10.71             10.98
Year over year change                                                                                           -2.5%
CASM - excluding unusual item (2)                                                                               10.71
Less: fuel expense                                                                                              (1.67)
Plus: current year fuel gallons x prior year fuel price (1)                                                      1.52
Fuel price neutralized CASM - excluding unusual item (2) (3) (4)                                                10.56
vs. March 2003 quarter CASM - excluding unusual item                                                            10.98
Change                                                                                                          -3.8%


(1)
    603 million gallons x 86.89 cents/gallon divided by 34.363 billion ASMs for the three months ended
March 31, 2004.
(2)
    In the March 2004 quarter there were no unusual items to exclude.
(3)
    Operating cost per available seat mile (ASM), adjusting average fuel price per gallon for the period
to equal the average fuel price per gallon for the corresponding period in the prior year.
(4)
    We believe this non-GAAP financial measure assists investors in understanding the impact
of changes in fuel costs on our operations.
Reconciliation of GAAP Financial Measures to Non-GAAP Financial Measures
                                                     March 2004 Quarter


                                                                                                            As of
                                                                                                           March 31,
Net Debt-to-Capital Ratio
                                                                                                             2004
(in millions)
Debt (including current maturities)                                                                              $12,479
Capital leases (including current portion)                                                                            95
Net implied debt (5)                                                                                               5,801
Total net debt                                                                                                   $18,375

Total net debt                                                                                                   $18,375
ESOP preferred stock                                                                                                  275
Shareowners' deficit                                                                                              (1,028)
Total capital                                                                                                    $17,622

Net debt-to-capital ratio                                                                                          104%

(5)
  Net implied debt represents the present value of our operating lease obligations, net of cash,
cash equivalents and short term investments.


                                                                                                            As of
                                                                                                           March 31,
Total Debt including Operating Leases
                                                                                                             2004
(in millions)
Debt (including current maturities)                                                                              $12,479
Capital leases (including current portion)                                                                            95
Implied debt (6)                                                                                                   7,981
Total debt                                                                                                       $20,555

(6)
      Implied debt represents the present value of our obligations under operating leases.


                                                                                                        Three
                                                                                                     Months Ended
                                                                                                       March 31,
Capital Expenditures
                                                                                                         2004
(in millions)
Cash used by investing activities - GAAP
    Flight equipment additions                                                                                     (157)
    Ground property and equipment additions                                                                         (92)

Add:
   Aircraft delivered under seller-financing                                                                         (55)

Less:
   Advanced deposits, net                                                                                            27
   Boston airport terminal project expenditures                                                                      50

Capital expenditures                                                                                              ($227)


                                                                                                        Three
                                                                                                     Months Ended
                                                                                                       March 31,
Cash Flow from Operations
                                                                                                         2004
(in millions)
Cash used in operating activities - GAAP                                                                      ($280)

Add:
   Pension funding                                                                                                  396

Adjusted cash flow                                                                                                 $116


June 2004 Quarter and Full Year 2004 Guidance on CASM and Fuel Price Neutralized CASM
Reconciliations for forward-looking guidance for CASM and fuel price neutralized CASM, excluding
unusual items, have not been provided because Delta cannot project specific unusual items that may occur
in future periods.
Reconciliation of GAAP Financial Measures to Non-GAAP Financial Measures
                                             June 2004 Quarter


                                                                                             Three
                                                                                          Months Ended
                                                                                          June 30, 2004
                                                                                 Net Loss            Basic and
Financial Information                                                          (in millions)        Diluted EPS
                                                                                                           ($15.79)
GAAP                                                                                   ($1,963)
Items excluded:
    Pension settlements                                                                   117                  0.94
    Deferred income tax asset reserve                                                   1,534                 12.30
            (1)
Non-GAAP                                                                                ($312)               ($2.55)


                                                                                             Three
                                                                                          Months Ended
Mainline - Operating Expenses                                                               June 30,
(in millions, except where noted)                                                  2004                   2003
Mainline operating expenses                                                           $3,426                 $2,738
Less: fuel expense                                                                      (555)                  (361)
Items excluded:
    Pension settlements                                                                  (117)                  -
    Appropriations Act reimbursements                                                     -                     319
Mainline operating expenses - excluding items above and fuel expense (1) (2)           $2,754                $2,696
Year over year change                                                                    2.2%


                                                                                             Three
                                                                                          Months Ended
CASM and Fuel Price Neutralized CASM                                                        June 30,
(in cents, except where noted)                                                     2004                   2003
CASM                                                                                      10.88                   9.92
Items excluded:
     Pension settlements                                                                  (0.30)                   -
     Appropriations Act reimbursements                                                      -                     1.20
CASM - excluding (1)                                                                      10.58                  11.12
Year over year change                                                                     -4.9%
                   (1)
CASM - excluding                                                                          10.58
                    (3)
Less: fuel expense                                                                        (1.73)
                                                        (4)
Plus: current year fuel gallons x prior year fuel price                                    1.26
                                           (1) (5) (6)
Fuel price neutralized CASM - excluding                                                   10.11
vs. June 2003 quarter CASM - excluding                                                    11.12
Change                                                                                    -9.1%


                                                                                             Three
                                                                                          Months Ended
Mainline - CASM and Fuel Price Neutralized CASM                                             June 30,
(in cents, except where noted)                                                     2004                   2003
Mainline CASM                                                                             10.32                   9.56
Items excluded:
     Pension settlements                                                                (0.35)                     -
     Appropriations Act reimbursements                                                    -                       1.12
Mainline CASM - excluding (1)                                                            9.97                    10.68
                      (7)
Less: fuel expense                                                                      (1.67)
Plus: current year fuel gallons x prior year fuel price (8)                              1.21
                                                     (1) (5) (9)
Mainline fuel price neutralized CASM - excluding                                         9.51
vs. June 2003 quarter Mainline CASM - excluding                                         10.68
Change                                                                                 -11.0%
Reconciliation of GAAP Financial Measures to Non-GAAP Financial Measures
                                           June 2004 Quarter


Net Debt-to-Capital Ratio                                                                     As of
(in millions, except where noted)                                                         June 30, 2004
Debt and capital leases (including current maturities and short-term)                            $12,552
                  (10)
Net implied debt                                                                                    6,015
Total net debt                                                                                   $18,567

Total net debt                                                                                     $18,567
ESOP preferred stock                                                                                    281
Shareowners' deficit                                                                                (2,952)
Total capital                                                                                      $15,896

Net debt-to-capital ratio                                                                            117%


Total Debt including Operating Leases                                                         As of
(in millions)                                                                             June 30, 2004
Debt and capital leases (including current maturities and short-term)                            $12,552
              (11)
Implied debt                                                                                        7,981
Total debt                                                                                       $20,533


                                                                                             Three
Capital Expenditures                                                                      Months Ended
(in millions)                                                                             June 30, 2004
Cash used by investing activities - GAAP:
    Aircraft (including advanced payments)                                                          ($104)
    Aircraft modifications and parts                                                                 ($56)
    Total flight equipment additions                                                                 (160)
    Ground property and equipment additions                                                          (111)

Less:
   Advanced payments on aircraft, net                                                                   24
   Boston airport terminal project expenditures                                                         45

Capital expenditures                                                                                  (202)


(1)
    We believe that providing financial and statistical data that excludes the items above is helpful to
investors to evaluate recurring operational performance because (1) the deferred income tax reserve and
pension settlements are not representative of current period operations and (2) the reimbursements
received under the Appropriations Act in 2003 were a one-time item.
(2)
    We believe that the exclusion of fuel expense, which has increased significantly due to historic high
fuel prices, allows investors to better understand the changes in our Mainline operating expenses.
(3)
    $669 million divided by 38.620 billion ASMs for the three months ended June 30, 2004.
(4)
    639 million gallons x 76.29 cents/gallon divided by 38.620 billion ASMs for the three months ended
June 30, 2004.
(5)
    Operating cost per available seat mile (ASM), adjusting average fuel price per gallon for the period
to equal the average fuel price per gallon for the corresponding period in the prior year.
(6)
    We believe this non-GAAP financial measure assists investors in understanding the impact
of changes in fuel costs on our operations.
(7)
    $555 million divided by 33.198 billion ASMs for the three months ended June 30, 2004.
(8)
    542 million gallons x 74.49 cents/gallon divided by 33.198 billion ASMs for the three months ended
June 30, 2004.
(9)
    We believe this non-GAAP financial measure assists investors in understanding the impact
of changes in fuel costs on our Mainline operations.
(10)
     Net implied debt represents the present value of our operating lease obligations, net of cash,
cash equivalents and short term investments.
(11)
     Implied debt represents the present value of our obligations under operating leases.


September 2004 Quarter and Full Year 2004 Guidance on CASM and Fuel Price Neutralized CASM
Reconciliations for forward-looking guidance for CASM and fuel price neutralized CASM, excluding
unusual items, have not been provided because Delta cannot project specific unusual items that may occur
in future periods.
Reconciliation of GAAP Financial Measures to Non-GAAP Financial Measures
                                  Twelve Months Ended June 2004


                                                                                                               Twelve
                                                                                                            Months Ended
Mainline CASM - Excluding Unusual Items                                                                       June 30,
(in millions, except where noted)                                                                               2004
Operating expenses                                                                                                $15,832
Less regional affiliates' operating expenses                                                                        (2,916)
Mainline operating expenses                                                                                        12,916
Less: Pension-related charges                                                                                         (329)
        Loss on future sale of aircraft                                                                                (41)
        Restructuring and other reserve adjustments                                                                     21
Mainline operating expenses - excluding unusual items                                                             $12,567
Mainline ASMs                                                                                                     125,385
                                                                                                                      10.02 ¢
Mainline CASM - excluding unusual items


                                                                                                               Twelve
                                                                                                            Months Ended
Mainline CASM - Excluding Unusual Items and Pilot Costs                                                       June 30,
(in millions, except where noted)                                                                               2004
Mainline operating expenses - excluding unusual items (see above)                                                 $12,567
Less: Delta pilot costs                                                                                             (1,984)   **
Mainline operating expenses - excluding unusual items and pilot costs                                             $10,583
Mainline ASMs                                                                                                     125,385
                                                                                                                       8.44 ¢
Mainline CASM - excluding unusual items and pilot costs


                                                                                                               Twelve
                                                                                                            Months Ended
Mainline CASM - Excluding Unusual Items and Labor Cost                                                        June 30,
(in millions, except where noted)                                                                               2004
Mainline operating expenses - excluding unusual items (see above)                                                 $12,567
Less: Labor costs                                                                                                   (5,688)
Mainline operating expenses - excluding unusual items and labor costs                                              $6,879
Mainline ASMs                                                                                                     125,385
                                                                                                                       5.49 ¢
Mainline CASM - excluding unusual items and labor costs


** Pilot benefits for the 3rd and 4th quarters of 2003 were restated in 2004 once it was determined that the allocated benefit
rates for pilot benefits, which were from 2002 but still being used for 2003, were too low. The restatement moved
approximately $299 million into pilot benefits from various other divisions. The net effect of the restatement on a
consolidated basis was $0. This CASM calculation uses the pre-restatement pilot cost amounts for Q3 and Q4 2003.
Essbase now shows the amounts post-restatement; therefore, this pilot cost amount does not agree to Essbase. If the
current Essbase amounts (post-restatement) were used, the pilot costs would be $2,067 and the Mainline CASM excluding
unusual items and pilot costs would be 8.37¢.


Note: The presentation also includes a number for quot;interest expense per ASMquot; for the 12 months ended June 30, 2004.
This number was actually calculated using consolidated non-op expense (which includes items other than just interest
expense) divided by the Mainline ASMs.
Reconciliation of GAAP Financial Measures to Non-GAAP Financial Measures
                                    Six Months Ended June 2004


                                                                                    Six
                                                                               Months Ended
Mainline CASM - Excluding Unusual Items                                          June 30,
(in millions, except where noted)                                                  2004
Operating expenses                                                                     $8,119
Less regional affiliates' operating expenses                                            (1,528)
Mainline operating expenses                                                              6,591
Less: Pension-related charges                                                             (117)
Mainline operating expenses - excluding unusual items                                  $6,474
Mainline ASMs                                                                          63,684
                                                                                         10.17 ¢
Mainline CASM - excluding unusual items


                                                                                    Six
                                                                               Months Ended
Mainline CASM - Excluding Unusual Items and Pilot Costs                          June 30,
(in millions, except where noted)                                                  2004
Mainline operating expenses - excluding unusual items (see above)                      $6,474
Less: Delta pilot costs                                                                 (1,036)
Mainline operating expenses - excluding unusual items and pilot costs                  $5,438
Mainline ASMs                                                                          63,684
                                                                                           8.54 ¢
Mainline CASM - excluding unusual items and pilot costs
Reconciliation of GAAP Financial Measures to Non-GAAP Financial Measures
                         Three Months Ended September 2004


Reconciliations of GAAP financial measures to non-GAAP financial measures for the September quarter were not required
to be posted on Delta's web site since there was no analyst call for the third quarter.

If you need information on the items Delta considered unusual for the third quarter, please refer to Delta's third quarter
earnings press release dated October 20, 2004, which includes reconciliations for non-GAAP financial measures
presented in that press release.
Reconciliation of GAAP Financial Measures to Non-GAAP Financial Measures
                                          December 2004 Quarter


                                                                                                Three
                                                                                             Months Ended
                                                                                           December 31, 2004
                                                                                      Net Loss           Basic and
Financial Information                                                               (in millions)       Diluted EPS
                                                                                                               ($16.58)
GAAP                                                                                        ($2,206)
Items excluded:
                                                                                              1,875               14.06
     Impairment of intangible assets
     Pension settlements, asset writedowns, restructuring and related items, net              (212)                (1.59)
     Gain from sale of investments                                                            (123)               (0.92)
     Deferred income tax asset reserve                                                        (114)               (0.85)
    Total items excluded                                                                     1,426                10.70
             (1)
Non-GAAP                                                                                     ($780)              ($5.88)


                                                                                                  Three
                                                                                               Months Ended
CASM and Fuel Price Neutralized CASM                                                           December 31,
(in cents, except where noted)                                                          2004                  2003
CASM                                                                                           15.46                 11.03
Items excluded:
     Impairment of intangible assets                                                           (4.92)                  -
     Restructuring, asset writedowns, pension settlements, and related items, net               0.56                 (0.65)
                    (1)
CASM - excluding                                                                               11.10                 10.38
Year over year change                                                                           6.9%
CASM - excluding (1)                                                                           11.10
                      (3)
Less: fuel expense                                                                             (2.35)
                                                        (4)
Plus: current year fuel gallons x prior year fuel price                                         1.40
                                           (1) (5) (6)
Fuel price neutralized CASM - excluding                                                        10.15
vs. December 2003 quarter CASM - excluding                                                     10.38
Change                                                                                         -2.2%


                                                                                                  Three
                                                                                               Months Ended
Mainline - CASM and Fuel Price Neutralized CASM                                                December 31,
(in cents, except where noted)                                                          2004                  2003
Mainline CASM                                                                                   9.75                 10.61
Items excluded:
     Restructuring, asset writedowns, pension settlements, and related items, net               0.65                 (0.76)
                             (1)
Mainline CASM - excluding                                                                      10.40                  9.85
Less: fuel expense (7)                                                                         (2.26)
Plus: current year fuel gallons x prior year fuel price (8)                                     1.33
                                                     (1) (5) (6)
Mainline fuel price neutralized CASM - excluding                                                9.47
vs. December 2003 quarter Mainline CASM - excluding                                             9.85
Change                                                                                         -3.9%
Total Debt including Operating Leases                                                             As of
                                                                                              December 31,
(in millions)                                                                                     2004
Debt and capital leases                                                                              $13,898
              (9)
Implied debt                                                                                            6,533
Total debt                                                                                           $20,431


                                                                                                Three
Capital Expenditures                                                                         Months Ended
                                                                                             December 31,
(in millions)                                                                                    2004
Cash used by investing activities - GAAP:
    Flight equipment additions, including advance payments                                                 ($3)
    Ground property and equipment additions                                                                 95

Add:
   Aircraft seller financing                                                                              111
   Advanced payments on aircraft, net                                                                      20

Less:
   Boston airport terminal project expenditures                                                            (32)

Capital expenditures                                                                                     $191


(1)
   We believe that providing financial and statistical data that excludes the items above is helpful to investors
to evaluate recurring operational performance because (1) the goodwill impairment charge is a one-time event
and (2) the charges related to pension settlements, asset writedowns, restructuring and related items, net and
the gains from the sale of equity investments are not representative of recurring operations.
(2)
    We believe that the exclusion of fuel expense, which has increased significantly due to historic high fuel
prices, allows investors to better understand the changes in our Mainline operating expenses.
(3)
    $895 million divided by 38.143 billion ASMs for the three months ended December 31, 2004.
(4)
    631 million gallons x 84.65 cents/gallon divided by 38.143 billion ASMs for the three months ended
December 31, 2004.
(5)
    Operating cost per available seat mile (ASM), adjusting average fuel price per gallon for the period to equal
the average fuel price per gallon for the corresponding period in the prior year.
(6)
    We believe this non-GAAP financial measure assists investors in understanding the impact of changes in
fuel costs on our operations.
(7)
    $739 million divided by 32.714 billion ASMs for the three months ended December 31, 2004.
(8)
    529 million gallons x 82.45 cents/gallon divided by 32.714 billion ASMs for the three months ended
December 31, 2004.
(9)
    Implied debt represents the present value of our obligations under operating leases.


March 2005 Quarter and Full Year 2005 Guidance on CASM and Fuel Price Neutralized CASM
Reconciliations for forward-looking guidance for CASM and fuel price neutralized CASM, excluding
unusual items, have not been provided because Delta cannot project specific unusual items that may occur
in future periods.
Reconciliation of GAAP Financial Measures to Non-GAAP Financial Measures
                                  Twelve Months Ended December 2004


                                                                                                           Twelve
                                                                                                        Months Ended
                                                                                                      December 31, 2004
                                                                                                 Net Loss             Basic and
Financial Information                                                                          (in millions)         Diluted EPS
                                                                                                                            ($41.07)
GAAP                                                                                                   ($5,198)
Items excluded:
                                                                                                        1,875                14.76
     Impairment of intangible assets
     Pension settlements, asset writedowns, restructuring and related items, net                          (41)                (0.33)
     Gain from sale of investments                                                                       (123)               (0.97)
     Deferred income tax asset reserve                                                                  1,206                  9.51
    Total items excluded                                                                                2,917                22.97
             (1)
Non-GAAP                                                                                              ($2,281)             ($18.10)


(1)
    We believe that providing financial and statistical data that excludes the items above is helpful to investors
to evaluate recurring operational performance because (1) the goodwill impairment charge is a one-time event
and (2) the charges related to pension settlements, asset writedowns, restructuring and related items, net and
the gains from the sale of equity investments are not representative of recurring operations.


March 2005 Quarter and Full Year 2005 Guidance on CASM and Fuel Price Neutralized CASM
Reconciliations for forward-looking guidance for CASM and fuel price neutralized CASM, excluding
unusual items, have not been provided because Delta cannot project specific unusual items that may occur
in future periods.

Más contenido relacionado

La actualidad más candente

onoco phillips 2004First Quarter
onoco phillips 2004First Quarteronoco phillips 2004First Quarter
onoco phillips 2004First Quarterfinance1
 
delta air line Reconciliations 2005
delta air line Reconciliations 2005delta air line Reconciliations 2005
delta air line Reconciliations 2005finance13
 
aetna table 2006 1st
aetna table 2006 1staetna table 2006 1st
aetna table 2006 1stfinance9
 
unum group 8_1_2ReconofNonGAAPMeasures2Q07
unum group  8_1_2ReconofNonGAAPMeasures2Q07unum group  8_1_2ReconofNonGAAPMeasures2Q07
unum group 8_1_2ReconofNonGAAPMeasures2Q07finance26
 
aetna table 2005 3rd
aetna table 2005 3rdaetna table 2005 3rd
aetna table 2005 3rdfinance9
 
Duke Energy 02/0/05_EPS_Recon
Duke Energy 02/0/05_EPS_ReconDuke Energy 02/0/05_EPS_Recon
Duke Energy 02/0/05_EPS_Reconfinance21
 
unum group Q1 06_Non-GAAP
unum group  Q1 06_Non-GAAPunum group  Q1 06_Non-GAAP
unum group Q1 06_Non-GAAPfinance26
 
ameren 2003_am_ar_fin_stmts
ameren  2003_am_ar_fin_stmtsameren  2003_am_ar_fin_stmts
ameren 2003_am_ar_fin_stmtsfinance30
 
11/03/06_RegG
11/03/06_RegG11/03/06_RegG
11/03/06_RegGfinance21
 
spectra energy q305
spectra energy q305spectra energy q305
spectra energy q305finance49
 
Duke Energy 01/29/04_PMA_and_DLH_4Q03_Earnings_Call
 Duke Energy 01/29/04_PMA_and_DLH_4Q03_Earnings_Call Duke Energy 01/29/04_PMA_and_DLH_4Q03_Earnings_Call
Duke Energy 01/29/04_PMA_and_DLH_4Q03_Earnings_Callfinance21
 
Duke Energy DEC_3Q04_EPS_Reconciliation
Duke Energy DEC_3Q04_EPS_ReconciliationDuke Energy DEC_3Q04_EPS_Reconciliation
Duke Energy DEC_3Q04_EPS_Reconciliationfinance21
 
March 2012 Energy Index - Bord Gáis Energy
March 2012 Energy Index - Bord Gáis EnergyMarch 2012 Energy Index - Bord Gáis Energy
March 2012 Energy Index - Bord Gáis EnergyBord Gáis Energy
 
Duke Energy reconciliation_consolidated_eps
 Duke Energy reconciliation_consolidated_eps Duke Energy reconciliation_consolidated_eps
Duke Energy reconciliation_consolidated_epsfinance21
 
anheuser-busch 2004AR_FinancialSummaries
anheuser-busch 2004AR_FinancialSummariesanheuser-busch 2004AR_FinancialSummaries
anheuser-busch 2004AR_FinancialSummariesfinance15
 
Q303_EPS-ExCharges
Q303_EPS-ExChargesQ303_EPS-ExCharges
Q303_EPS-ExChargesfinance50
 
Duke Energy 1Q/05_Slides
Duke Energy 1Q/05_SlidesDuke Energy 1Q/05_Slides
Duke Energy 1Q/05_Slidesfinance21
 

La actualidad más candente (20)

onoco phillips 2004First Quarter
onoco phillips 2004First Quarteronoco phillips 2004First Quarter
onoco phillips 2004First Quarter
 
delta air line Reconciliations 2005
delta air line Reconciliations 2005delta air line Reconciliations 2005
delta air line Reconciliations 2005
 
aetna table 2006 1st
aetna table 2006 1staetna table 2006 1st
aetna table 2006 1st
 
unum group 8_1_2ReconofNonGAAPMeasures2Q07
unum group  8_1_2ReconofNonGAAPMeasures2Q07unum group  8_1_2ReconofNonGAAPMeasures2Q07
unum group 8_1_2ReconofNonGAAPMeasures2Q07
 
aetna table 2005 3rd
aetna table 2005 3rdaetna table 2005 3rd
aetna table 2005 3rd
 
Duke Energy 02/0/05_EPS_Recon
Duke Energy 02/0/05_EPS_ReconDuke Energy 02/0/05_EPS_Recon
Duke Energy 02/0/05_EPS_Recon
 
unum group Q1 06_Non-GAAP
unum group  Q1 06_Non-GAAPunum group  Q1 06_Non-GAAP
unum group Q1 06_Non-GAAP
 
Q1 2009 Earning Report of Covanta Holdings
Q1 2009 Earning Report of Covanta HoldingsQ1 2009 Earning Report of Covanta Holdings
Q1 2009 Earning Report of Covanta Holdings
 
ameren 2003_am_ar_fin_stmts
ameren  2003_am_ar_fin_stmtsameren  2003_am_ar_fin_stmts
ameren 2003_am_ar_fin_stmts
 
11/03/06_RegG
11/03/06_RegG11/03/06_RegG
11/03/06_RegG
 
spectra energy q305
spectra energy q305spectra energy q305
spectra energy q305
 
2012 Annual and Special Meeting of Shareholders
2012 Annual and Special Meeting of Shareholders2012 Annual and Special Meeting of Shareholders
2012 Annual and Special Meeting of Shareholders
 
Duke Energy 01/29/04_PMA_and_DLH_4Q03_Earnings_Call
 Duke Energy 01/29/04_PMA_and_DLH_4Q03_Earnings_Call Duke Energy 01/29/04_PMA_and_DLH_4Q03_Earnings_Call
Duke Energy 01/29/04_PMA_and_DLH_4Q03_Earnings_Call
 
Duke Energy DEC_3Q04_EPS_Reconciliation
Duke Energy DEC_3Q04_EPS_ReconciliationDuke Energy DEC_3Q04_EPS_Reconciliation
Duke Energy DEC_3Q04_EPS_Reconciliation
 
March 2012 Energy Index - Bord Gáis Energy
March 2012 Energy Index - Bord Gáis EnergyMarch 2012 Energy Index - Bord Gáis Energy
March 2012 Energy Index - Bord Gáis Energy
 
Duke Energy reconciliation_consolidated_eps
 Duke Energy reconciliation_consolidated_eps Duke Energy reconciliation_consolidated_eps
Duke Energy reconciliation_consolidated_eps
 
anheuser-busch 2004AR_FinancialSummaries
anheuser-busch 2004AR_FinancialSummariesanheuser-busch 2004AR_FinancialSummaries
anheuser-busch 2004AR_FinancialSummaries
 
Q303_EPS-ExCharges
Q303_EPS-ExChargesQ303_EPS-ExCharges
Q303_EPS-ExCharges
 
Duke Energy 1Q/05_Slides
Duke Energy 1Q/05_SlidesDuke Energy 1Q/05_Slides
Duke Energy 1Q/05_Slides
 
Release 1Q02
Release 1Q02Release 1Q02
Release 1Q02
 

Destacado

Qwest 4Q 02 Release FIN
Qwest 4Q 02 Release FINQwest 4Q 02 Release FIN
Qwest 4Q 02 Release FINfinance19
 
Does india has the capacity to lead the
Does india has the capacity to lead theDoes india has the capacity to lead the
Does india has the capacity to lead theNandeesh Laxetty
 
Aruba banking & offshore bank accounts
Aruba banking & offshore bank accountsAruba banking & offshore bank accounts
Aruba banking & offshore bank accountsHomealoneagain
 
Debata 2012 własność Bachowice
Debata 2012 własność BachowiceDebata 2012 własność Bachowice
Debata 2012 własność Bachowicewojtex140
 
Prezentacja2
Prezentacja2Prezentacja2
Prezentacja2jozwa
 
Fair work and payroll
Fair work and payrollFair work and payroll
Fair work and payrollTracy Angwin
 

Destacado (7)

Qwest 4Q 02 Release FIN
Qwest 4Q 02 Release FINQwest 4Q 02 Release FIN
Qwest 4Q 02 Release FIN
 
Konfa Sejm 2010 03 05 Hyla
Konfa Sejm 2010 03 05 HylaKonfa Sejm 2010 03 05 Hyla
Konfa Sejm 2010 03 05 Hyla
 
Does india has the capacity to lead the
Does india has the capacity to lead theDoes india has the capacity to lead the
Does india has the capacity to lead the
 
Aruba banking & offshore bank accounts
Aruba banking & offshore bank accountsAruba banking & offshore bank accounts
Aruba banking & offshore bank accounts
 
Debata 2012 własność Bachowice
Debata 2012 własność BachowiceDebata 2012 własność Bachowice
Debata 2012 własność Bachowice
 
Prezentacja2
Prezentacja2Prezentacja2
Prezentacja2
 
Fair work and payroll
Fair work and payrollFair work and payroll
Fair work and payroll
 

Similar a delta air line Reconciliations 2004

RYDERFINAL Q107_tables
RYDERFINAL Q107_tablesRYDERFINAL Q107_tables
RYDERFINAL Q107_tablesfinance44
 
RYDERFINAL Q107_tables
RYDERFINAL Q107_tablesRYDERFINAL Q107_tables
RYDERFINAL Q107_tablesfinance44
 
RYDERFINAL NewnewFINALPRTABLESQ108
RYDERFINAL NewnewFINALPRTABLESQ108RYDERFINAL NewnewFINALPRTABLESQ108
RYDERFINAL NewnewFINALPRTABLESQ108finance44
 
RYDERFINAL NewnewFINALPRTABLESQ108
RYDERFINAL NewnewFINALPRTABLESQ108RYDERFINAL NewnewFINALPRTABLESQ108
RYDERFINAL NewnewFINALPRTABLESQ108finance44
 
NewnewFINALPRTABLESQ108
NewnewFINALPRTABLESQ108NewnewFINALPRTABLESQ108
NewnewFINALPRTABLESQ108finance44
 
tech data Q4 and Fiscal Year 2006 Restated for Discontinued Operations
tech data Q4 and Fiscal Year 2006 Restated for Discontinued Operationstech data Q4 and Fiscal Year 2006 Restated for Discontinued Operations
tech data Q4 and Fiscal Year 2006 Restated for Discontinued Operationsfinance11
 
RYDERFINAL 1Q06FinancialInfo
RYDERFINAL 1Q06FinancialInfoRYDERFINAL 1Q06FinancialInfo
RYDERFINAL 1Q06FinancialInfofinance44
 
RYDERFINAL 1Q06FinancialInfo
RYDERFINAL  1Q06FinancialInfoRYDERFINAL  1Q06FinancialInfo
RYDERFINAL 1Q06FinancialInfofinance44
 
RYDERFINAL Q405tables
RYDERFINAL Q405tablesRYDERFINAL Q405tables
RYDERFINAL Q405tablesfinance44
 
RYDERFINAL Q405tables
RYDERFINAL Q405tablesRYDERFINAL Q405tables
RYDERFINAL Q405tablesfinance44
 
RYDERFINAL Q105financialinfo
RYDERFINAL Q105financialinfoRYDERFINAL Q105financialinfo
RYDERFINAL Q105financialinfofinance44
 
RYDERFINAL Q105financialinfo
RYDERFINAL Q105financialinfoRYDERFINAL Q105financialinfo
RYDERFINAL Q105financialinfofinance44
 
Q404netincome
Q404netincomeQ404netincome
Q404netincomefinance50
 
RYDERFINAL Q406tables
RYDERFINAL Q406tablesRYDERFINAL Q406tables
RYDERFINAL Q406tablesfinance44
 
RYDERFINAL Q406tables
RYDERFINAL Q406tablesRYDERFINAL Q406tables
RYDERFINAL Q406tablesfinance44
 
unum group 1Q 05Recon
unum group 1Q 05Reconunum group 1Q 05Recon
unum group 1Q 05Reconfinance26
 

Similar a delta air line Reconciliations 2004 (20)

RYDERFINAL Q107_tables
RYDERFINAL Q107_tablesRYDERFINAL Q107_tables
RYDERFINAL Q107_tables
 
RYDERFINAL Q107_tables
RYDERFINAL Q107_tablesRYDERFINAL Q107_tables
RYDERFINAL Q107_tables
 
RYDERFINAL NewnewFINALPRTABLESQ108
RYDERFINAL NewnewFINALPRTABLESQ108RYDERFINAL NewnewFINALPRTABLESQ108
RYDERFINAL NewnewFINALPRTABLESQ108
 
RYDERFINAL NewnewFINALPRTABLESQ108
RYDERFINAL NewnewFINALPRTABLESQ108RYDERFINAL NewnewFINALPRTABLESQ108
RYDERFINAL NewnewFINALPRTABLESQ108
 
NewnewFINALPRTABLESQ108
NewnewFINALPRTABLESQ108NewnewFINALPRTABLESQ108
NewnewFINALPRTABLESQ108
 
tech data Q4 and Fiscal Year 2006 Restated for Discontinued Operations
tech data Q4 and Fiscal Year 2006 Restated for Discontinued Operationstech data Q4 and Fiscal Year 2006 Restated for Discontinued Operations
tech data Q4 and Fiscal Year 2006 Restated for Discontinued Operations
 
RYDERFINAL 1Q06FinancialInfo
RYDERFINAL 1Q06FinancialInfoRYDERFINAL 1Q06FinancialInfo
RYDERFINAL 1Q06FinancialInfo
 
RYDERFINAL 1Q06FinancialInfo
RYDERFINAL  1Q06FinancialInfoRYDERFINAL  1Q06FinancialInfo
RYDERFINAL 1Q06FinancialInfo
 
RYDERFINAL Q405tables
RYDERFINAL Q405tablesRYDERFINAL Q405tables
RYDERFINAL Q405tables
 
RYDERFINAL Q405tables
RYDERFINAL Q405tablesRYDERFINAL Q405tables
RYDERFINAL Q405tables
 
RYDERFINAL Q105financialinfo
RYDERFINAL Q105financialinfoRYDERFINAL Q105financialinfo
RYDERFINAL Q105financialinfo
 
RYDERFINAL Q105financialinfo
RYDERFINAL Q105financialinfoRYDERFINAL Q105financialinfo
RYDERFINAL Q105financialinfo
 
Q404netincome
Q404netincomeQ404netincome
Q404netincome
 
RYDERFINAL Q406tables
RYDERFINAL Q406tablesRYDERFINAL Q406tables
RYDERFINAL Q406tables
 
RYDERFINAL Q406tables
RYDERFINAL Q406tablesRYDERFINAL Q406tables
RYDERFINAL Q406tables
 
Q403_EPS
Q403_EPSQ403_EPS
Q403_EPS
 
dte_1q1999
dte_1q1999dte_1q1999
dte_1q1999
 
dte_1q1999
dte_1q1999dte_1q1999
dte_1q1999
 
Q1 2009 Earning Report of Encana Corp.
Q1 2009 Earning Report of Encana Corp.Q1 2009 Earning Report of Encana Corp.
Q1 2009 Earning Report of Encana Corp.
 
unum group 1Q 05Recon
unum group 1Q 05Reconunum group 1Q 05Recon
unum group 1Q 05Recon
 

Más de finance13

capital oneQ1 2008 Capital One Financial Earnings Conference Call Presentation
capital oneQ1 2008 Capital One Financial Earnings Conference Call Presentationcapital oneQ1 2008 Capital One Financial Earnings Conference Call Presentation
capital oneQ1 2008 Capital One Financial Earnings Conference Call Presentationfinance13
 
capital oneCapital One Financial Corp. Shareholders Meeting Presentation
capital oneCapital One Financial Corp. Shareholders Meeting Presentationcapital oneCapital One Financial Corp. Shareholders Meeting Presentation
capital oneCapital One Financial Corp. Shareholders Meeting Presentationfinance13
 
capital oneLehman Brothers Eleventh Annual Lehman Financial Services Conferen...
capital oneLehman Brothers Eleventh Annual Lehman Financial Services Conferen...capital oneLehman Brothers Eleventh Annual Lehman Financial Services Conferen...
capital oneLehman Brothers Eleventh Annual Lehman Financial Services Conferen...finance13
 
capital oneSanford C. Bernstein & Co. Strategic Decisions Conference Presenta...
capital oneSanford C. Bernstein & Co. Strategic Decisions Conference Presenta...capital oneSanford C. Bernstein & Co. Strategic Decisions Conference Presenta...
capital oneSanford C. Bernstein & Co. Strategic Decisions Conference Presenta...finance13
 
capital one Keefe, Bruyette & Woods, Inc. Diversified Financial Services Conf...
capital one Keefe, Bruyette & Woods, Inc. Diversified Financial Services Conf...capital one Keefe, Bruyette & Woods, Inc. Diversified Financial Services Conf...
capital one Keefe, Bruyette & Woods, Inc. Diversified Financial Services Conf...finance13
 
capital one Q2 2008 Capital One Financial Earnings Conference Call Presentation
capital one Q2 2008 Capital One Financial Earnings Conference Call Presentationcapital one Q2 2008 Capital One Financial Earnings Conference Call Presentation
capital one Q2 2008 Capital One Financial Earnings Conference Call Presentationfinance13
 
capital one Lehman Conference Presentation
capital one Lehman Conference Presentationcapital one Lehman Conference Presentation
capital one Lehman Conference Presentationfinance13
 
capital one Q3 2008 Capital One Financial Earnings Conference Call Presentation
capital one Q3 2008 Capital One Financial Earnings Conference Call Presentationcapital one Q3 2008 Capital One Financial Earnings Conference Call Presentation
capital one Q3 2008 Capital One Financial Earnings Conference Call Presentationfinance13
 
capital one Capital One Acquisition of Chevy Chase Bank
capital one Capital One Acquisition of Chevy Chase Bankcapital one Capital One Acquisition of Chevy Chase Bank
capital one Capital One Acquisition of Chevy Chase Bankfinance13
 
capital one Printer Friendly Version of the Press Release
capital one Printer Friendly Version of the Press Releasecapital one Printer Friendly Version of the Press Release
capital one Printer Friendly Version of the Press Releasefinance13
 
capital one Printer Friendly Version of the Financial Supplement
capital one Printer Friendly Version of the Financial Supplementcapital one Printer Friendly Version of the Financial Supplement
capital one Printer Friendly Version of the Financial Supplementfinance13
 
capital onePrinter Friendly Version of the Conference Call Presentation
capital onePrinter Friendly Version of the Conference Call Presentationcapital onePrinter Friendly Version of the Conference Call Presentation
capital onePrinter Friendly Version of the Conference Call Presentationfinance13
 
capital one Annual Report1996
capital one  Annual Report1996capital one  Annual Report1996
capital one Annual Report1996finance13
 
capital one Annual Report1997
capital one  Annual Report1997capital one  Annual Report1997
capital one Annual Report1997finance13
 
capital one Annual Report1998
capital one  Annual Report1998capital one  Annual Report1998
capital one Annual Report1998finance13
 
capital one Annual Report1999
capital one  Annual Report1999capital one  Annual Report1999
capital one Annual Report1999finance13
 
capital one Annual Report2001
capital one  Annual Report2001capital one  Annual Report2001
capital one Annual Report2001finance13
 
capital one Annual Report2005
capital one  Annual Report2005capital one  Annual Report2005
capital one Annual Report2005finance13
 
capital one Annual Report2000
capital one  Annual Report2000capital one  Annual Report2000
capital one Annual Report2000finance13
 
capital one Annual Report2002
capital one  Annual Report2002capital one  Annual Report2002
capital one Annual Report2002finance13
 

Más de finance13 (20)

capital oneQ1 2008 Capital One Financial Earnings Conference Call Presentation
capital oneQ1 2008 Capital One Financial Earnings Conference Call Presentationcapital oneQ1 2008 Capital One Financial Earnings Conference Call Presentation
capital oneQ1 2008 Capital One Financial Earnings Conference Call Presentation
 
capital oneCapital One Financial Corp. Shareholders Meeting Presentation
capital oneCapital One Financial Corp. Shareholders Meeting Presentationcapital oneCapital One Financial Corp. Shareholders Meeting Presentation
capital oneCapital One Financial Corp. Shareholders Meeting Presentation
 
capital oneLehman Brothers Eleventh Annual Lehman Financial Services Conferen...
capital oneLehman Brothers Eleventh Annual Lehman Financial Services Conferen...capital oneLehman Brothers Eleventh Annual Lehman Financial Services Conferen...
capital oneLehman Brothers Eleventh Annual Lehman Financial Services Conferen...
 
capital oneSanford C. Bernstein & Co. Strategic Decisions Conference Presenta...
capital oneSanford C. Bernstein & Co. Strategic Decisions Conference Presenta...capital oneSanford C. Bernstein & Co. Strategic Decisions Conference Presenta...
capital oneSanford C. Bernstein & Co. Strategic Decisions Conference Presenta...
 
capital one Keefe, Bruyette & Woods, Inc. Diversified Financial Services Conf...
capital one Keefe, Bruyette & Woods, Inc. Diversified Financial Services Conf...capital one Keefe, Bruyette & Woods, Inc. Diversified Financial Services Conf...
capital one Keefe, Bruyette & Woods, Inc. Diversified Financial Services Conf...
 
capital one Q2 2008 Capital One Financial Earnings Conference Call Presentation
capital one Q2 2008 Capital One Financial Earnings Conference Call Presentationcapital one Q2 2008 Capital One Financial Earnings Conference Call Presentation
capital one Q2 2008 Capital One Financial Earnings Conference Call Presentation
 
capital one Lehman Conference Presentation
capital one Lehman Conference Presentationcapital one Lehman Conference Presentation
capital one Lehman Conference Presentation
 
capital one Q3 2008 Capital One Financial Earnings Conference Call Presentation
capital one Q3 2008 Capital One Financial Earnings Conference Call Presentationcapital one Q3 2008 Capital One Financial Earnings Conference Call Presentation
capital one Q3 2008 Capital One Financial Earnings Conference Call Presentation
 
capital one Capital One Acquisition of Chevy Chase Bank
capital one Capital One Acquisition of Chevy Chase Bankcapital one Capital One Acquisition of Chevy Chase Bank
capital one Capital One Acquisition of Chevy Chase Bank
 
capital one Printer Friendly Version of the Press Release
capital one Printer Friendly Version of the Press Releasecapital one Printer Friendly Version of the Press Release
capital one Printer Friendly Version of the Press Release
 
capital one Printer Friendly Version of the Financial Supplement
capital one Printer Friendly Version of the Financial Supplementcapital one Printer Friendly Version of the Financial Supplement
capital one Printer Friendly Version of the Financial Supplement
 
capital onePrinter Friendly Version of the Conference Call Presentation
capital onePrinter Friendly Version of the Conference Call Presentationcapital onePrinter Friendly Version of the Conference Call Presentation
capital onePrinter Friendly Version of the Conference Call Presentation
 
capital one Annual Report1996
capital one  Annual Report1996capital one  Annual Report1996
capital one Annual Report1996
 
capital one Annual Report1997
capital one  Annual Report1997capital one  Annual Report1997
capital one Annual Report1997
 
capital one Annual Report1998
capital one  Annual Report1998capital one  Annual Report1998
capital one Annual Report1998
 
capital one Annual Report1999
capital one  Annual Report1999capital one  Annual Report1999
capital one Annual Report1999
 
capital one Annual Report2001
capital one  Annual Report2001capital one  Annual Report2001
capital one Annual Report2001
 
capital one Annual Report2005
capital one  Annual Report2005capital one  Annual Report2005
capital one Annual Report2005
 
capital one Annual Report2000
capital one  Annual Report2000capital one  Annual Report2000
capital one Annual Report2000
 
capital one Annual Report2002
capital one  Annual Report2002capital one  Annual Report2002
capital one Annual Report2002
 

Último

Interimreport1 January–31 March2024 Elo Mutual Pension Insurance Company
Interimreport1 January–31 March2024 Elo Mutual Pension Insurance CompanyInterimreport1 January–31 March2024 Elo Mutual Pension Insurance Company
Interimreport1 January–31 March2024 Elo Mutual Pension Insurance CompanyTyöeläkeyhtiö Elo
 
NO1 Certified Ilam kala Jadu Specialist Expert In Bahawalpur, Sargodha, Sialk...
NO1 Certified Ilam kala Jadu Specialist Expert In Bahawalpur, Sargodha, Sialk...NO1 Certified Ilam kala Jadu Specialist Expert In Bahawalpur, Sargodha, Sialk...
NO1 Certified Ilam kala Jadu Specialist Expert In Bahawalpur, Sargodha, Sialk...Amil Baba Dawood bangali
 
Call Girls In Yusuf Sarai Women Seeking Men 9654467111
Call Girls In Yusuf Sarai Women Seeking Men 9654467111Call Girls In Yusuf Sarai Women Seeking Men 9654467111
Call Girls In Yusuf Sarai Women Seeking Men 9654467111Sapana Sha
 
BPPG response - Options for Defined Benefit schemes - 19Apr24.pdf
BPPG response - Options for Defined Benefit schemes - 19Apr24.pdfBPPG response - Options for Defined Benefit schemes - 19Apr24.pdf
BPPG response - Options for Defined Benefit schemes - 19Apr24.pdfHenry Tapper
 
(中央兰开夏大学毕业证学位证成绩单-案例)
(中央兰开夏大学毕业证学位证成绩单-案例)(中央兰开夏大学毕业证学位证成绩单-案例)
(中央兰开夏大学毕业证学位证成绩单-案例)twfkn8xj
 
(办理学位证)加拿大萨省大学毕业证成绩单原版一比一
(办理学位证)加拿大萨省大学毕业证成绩单原版一比一(办理学位证)加拿大萨省大学毕业证成绩单原版一比一
(办理学位证)加拿大萨省大学毕业证成绩单原版一比一S SDS
 
Economic Risk Factor Update: April 2024 [SlideShare]
Economic Risk Factor Update: April 2024 [SlideShare]Economic Risk Factor Update: April 2024 [SlideShare]
Economic Risk Factor Update: April 2024 [SlideShare]Commonwealth
 
chapter_2.ppt The labour market definitions and trends
chapter_2.ppt The labour market definitions and trendschapter_2.ppt The labour market definitions and trends
chapter_2.ppt The labour market definitions and trendslemlemtesfaye192
 
The Core Functions of the Bangko Sentral ng Pilipinas
The Core Functions of the Bangko Sentral ng PilipinasThe Core Functions of the Bangko Sentral ng Pilipinas
The Core Functions of the Bangko Sentral ng PilipinasCherylouCamus
 
原版1:1复刻温哥华岛大学毕业证Vancouver毕业证留信学历认证
原版1:1复刻温哥华岛大学毕业证Vancouver毕业证留信学历认证原版1:1复刻温哥华岛大学毕业证Vancouver毕业证留信学历认证
原版1:1复刻温哥华岛大学毕业证Vancouver毕业证留信学历认证rjrjkk
 
Stock Market Brief Deck for "this does not happen often".pdf
Stock Market Brief Deck for "this does not happen often".pdfStock Market Brief Deck for "this does not happen often".pdf
Stock Market Brief Deck for "this does not happen often".pdfMichael Silva
 
NO1 WorldWide online istikhara for love marriage vashikaran specialist love p...
NO1 WorldWide online istikhara for love marriage vashikaran specialist love p...NO1 WorldWide online istikhara for love marriage vashikaran specialist love p...
NO1 WorldWide online istikhara for love marriage vashikaran specialist love p...Amil Baba Dawood bangali
 
Governor Olli Rehn: Dialling back monetary restraint
Governor Olli Rehn: Dialling back monetary restraintGovernor Olli Rehn: Dialling back monetary restraint
Governor Olli Rehn: Dialling back monetary restraintSuomen Pankki
 
magnetic-pensions-a-new-blueprint-for-the-dc-landscape.pdf
magnetic-pensions-a-new-blueprint-for-the-dc-landscape.pdfmagnetic-pensions-a-new-blueprint-for-the-dc-landscape.pdf
magnetic-pensions-a-new-blueprint-for-the-dc-landscape.pdfHenry Tapper
 
212MTAMount Durham University Bachelor's Diploma in Technology
212MTAMount Durham University Bachelor's Diploma in Technology212MTAMount Durham University Bachelor's Diploma in Technology
212MTAMount Durham University Bachelor's Diploma in Technologyz xss
 
Quantitative Analysis of Retail Sector Companies
Quantitative Analysis of Retail Sector CompaniesQuantitative Analysis of Retail Sector Companies
Quantitative Analysis of Retail Sector Companiesprashantbhati354
 
Current Economic situation of Pakistan .pptx
Current Economic situation of Pakistan .pptxCurrent Economic situation of Pakistan .pptx
Current Economic situation of Pakistan .pptxuzma244191
 
NO1 WorldWide Love marriage specialist baba ji Amil Baba Kala ilam powerful v...
NO1 WorldWide Love marriage specialist baba ji Amil Baba Kala ilam powerful v...NO1 WorldWide Love marriage specialist baba ji Amil Baba Kala ilam powerful v...
NO1 WorldWide Love marriage specialist baba ji Amil Baba Kala ilam powerful v...Amil baba
 
Call Girls Near Golden Tulip Essential Hotel, New Delhi 9873777170
Call Girls Near Golden Tulip Essential Hotel, New Delhi 9873777170Call Girls Near Golden Tulip Essential Hotel, New Delhi 9873777170
Call Girls Near Golden Tulip Essential Hotel, New Delhi 9873777170Sonam Pathan
 

Último (20)

Interimreport1 January–31 March2024 Elo Mutual Pension Insurance Company
Interimreport1 January–31 March2024 Elo Mutual Pension Insurance CompanyInterimreport1 January–31 March2024 Elo Mutual Pension Insurance Company
Interimreport1 January–31 March2024 Elo Mutual Pension Insurance Company
 
NO1 Certified Ilam kala Jadu Specialist Expert In Bahawalpur, Sargodha, Sialk...
NO1 Certified Ilam kala Jadu Specialist Expert In Bahawalpur, Sargodha, Sialk...NO1 Certified Ilam kala Jadu Specialist Expert In Bahawalpur, Sargodha, Sialk...
NO1 Certified Ilam kala Jadu Specialist Expert In Bahawalpur, Sargodha, Sialk...
 
Call Girls In Yusuf Sarai Women Seeking Men 9654467111
Call Girls In Yusuf Sarai Women Seeking Men 9654467111Call Girls In Yusuf Sarai Women Seeking Men 9654467111
Call Girls In Yusuf Sarai Women Seeking Men 9654467111
 
BPPG response - Options for Defined Benefit schemes - 19Apr24.pdf
BPPG response - Options for Defined Benefit schemes - 19Apr24.pdfBPPG response - Options for Defined Benefit schemes - 19Apr24.pdf
BPPG response - Options for Defined Benefit schemes - 19Apr24.pdf
 
(中央兰开夏大学毕业证学位证成绩单-案例)
(中央兰开夏大学毕业证学位证成绩单-案例)(中央兰开夏大学毕业证学位证成绩单-案例)
(中央兰开夏大学毕业证学位证成绩单-案例)
 
(办理学位证)加拿大萨省大学毕业证成绩单原版一比一
(办理学位证)加拿大萨省大学毕业证成绩单原版一比一(办理学位证)加拿大萨省大学毕业证成绩单原版一比一
(办理学位证)加拿大萨省大学毕业证成绩单原版一比一
 
Economic Risk Factor Update: April 2024 [SlideShare]
Economic Risk Factor Update: April 2024 [SlideShare]Economic Risk Factor Update: April 2024 [SlideShare]
Economic Risk Factor Update: April 2024 [SlideShare]
 
chapter_2.ppt The labour market definitions and trends
chapter_2.ppt The labour market definitions and trendschapter_2.ppt The labour market definitions and trends
chapter_2.ppt The labour market definitions and trends
 
The Core Functions of the Bangko Sentral ng Pilipinas
The Core Functions of the Bangko Sentral ng PilipinasThe Core Functions of the Bangko Sentral ng Pilipinas
The Core Functions of the Bangko Sentral ng Pilipinas
 
Monthly Economic Monitoring of Ukraine No 231, April 2024
Monthly Economic Monitoring of Ukraine No 231, April 2024Monthly Economic Monitoring of Ukraine No 231, April 2024
Monthly Economic Monitoring of Ukraine No 231, April 2024
 
原版1:1复刻温哥华岛大学毕业证Vancouver毕业证留信学历认证
原版1:1复刻温哥华岛大学毕业证Vancouver毕业证留信学历认证原版1:1复刻温哥华岛大学毕业证Vancouver毕业证留信学历认证
原版1:1复刻温哥华岛大学毕业证Vancouver毕业证留信学历认证
 
Stock Market Brief Deck for "this does not happen often".pdf
Stock Market Brief Deck for "this does not happen often".pdfStock Market Brief Deck for "this does not happen often".pdf
Stock Market Brief Deck for "this does not happen often".pdf
 
NO1 WorldWide online istikhara for love marriage vashikaran specialist love p...
NO1 WorldWide online istikhara for love marriage vashikaran specialist love p...NO1 WorldWide online istikhara for love marriage vashikaran specialist love p...
NO1 WorldWide online istikhara for love marriage vashikaran specialist love p...
 
Governor Olli Rehn: Dialling back monetary restraint
Governor Olli Rehn: Dialling back monetary restraintGovernor Olli Rehn: Dialling back monetary restraint
Governor Olli Rehn: Dialling back monetary restraint
 
magnetic-pensions-a-new-blueprint-for-the-dc-landscape.pdf
magnetic-pensions-a-new-blueprint-for-the-dc-landscape.pdfmagnetic-pensions-a-new-blueprint-for-the-dc-landscape.pdf
magnetic-pensions-a-new-blueprint-for-the-dc-landscape.pdf
 
212MTAMount Durham University Bachelor's Diploma in Technology
212MTAMount Durham University Bachelor's Diploma in Technology212MTAMount Durham University Bachelor's Diploma in Technology
212MTAMount Durham University Bachelor's Diploma in Technology
 
Quantitative Analysis of Retail Sector Companies
Quantitative Analysis of Retail Sector CompaniesQuantitative Analysis of Retail Sector Companies
Quantitative Analysis of Retail Sector Companies
 
Current Economic situation of Pakistan .pptx
Current Economic situation of Pakistan .pptxCurrent Economic situation of Pakistan .pptx
Current Economic situation of Pakistan .pptx
 
NO1 WorldWide Love marriage specialist baba ji Amil Baba Kala ilam powerful v...
NO1 WorldWide Love marriage specialist baba ji Amil Baba Kala ilam powerful v...NO1 WorldWide Love marriage specialist baba ji Amil Baba Kala ilam powerful v...
NO1 WorldWide Love marriage specialist baba ji Amil Baba Kala ilam powerful v...
 
Call Girls Near Golden Tulip Essential Hotel, New Delhi 9873777170
Call Girls Near Golden Tulip Essential Hotel, New Delhi 9873777170Call Girls Near Golden Tulip Essential Hotel, New Delhi 9873777170
Call Girls Near Golden Tulip Essential Hotel, New Delhi 9873777170
 

delta air line Reconciliations 2004

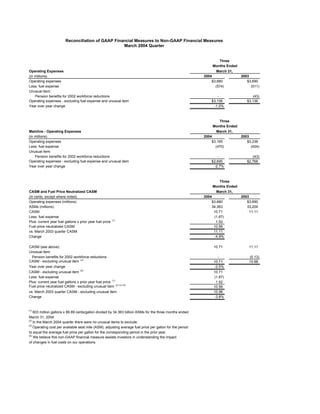
  • 1. Reconciliation of GAAP Financial Measures to Non-GAAP Financial Measures March 2004 Quarter Three Months Ended Operating Expenses March 31, 2004 2003 (in millions) Operating expenses $3,680 $3,690 Less: fuel expense (574) (511) Unusual item: Pension benefits for 2002 workforce reductions - (43) Operating expenses - excluding fuel expense and unusual item $3,106 $3,136 Year over year change -1.0% Three Months Ended Mainline - Operating Expenses March 31, 2004 2003 (in millions) Operating expenses $3,165 $3,236 Less: fuel expense (470) (424) Unusual item: Pension benefits for 2002 workforce reductions - (43) Operating expenses - excluding fuel expense and unusual item $2,695 $2,768 Year over year change -2.7% Three Months Ended CASM and Fuel Price Neutralized CASM March 31, 2004 2003 (in cents, except where noted) Operating expenses (millions) $3,680 $3,690 ASMs (millions) 34,363 33,204 CASM 10.71 11.11 Less: fuel expense (1.67) (1) Plus: current year fuel gallons x prior year fuel price 1.52 Fuel price neutralized CASM 10.56 vs. March 2003 quarter CASM 11.11 Change -4.9% CASM (see above) 10.71 11.11 Unusual item: Pension benefits for 2002 workforce reductions - (0.13) CASM - excluding unusual item (2) 10.71 10.98 Year over year change -2.5% CASM - excluding unusual item (2) 10.71 Less: fuel expense (1.67) Plus: current year fuel gallons x prior year fuel price (1) 1.52 Fuel price neutralized CASM - excluding unusual item (2) (3) (4) 10.56 vs. March 2003 quarter CASM - excluding unusual item 10.98 Change -3.8% (1) 603 million gallons x 86.89 cents/gallon divided by 34.363 billion ASMs for the three months ended March 31, 2004. (2) In the March 2004 quarter there were no unusual items to exclude. (3) Operating cost per available seat mile (ASM), adjusting average fuel price per gallon for the period to equal the average fuel price per gallon for the corresponding period in the prior year. (4) We believe this non-GAAP financial measure assists investors in understanding the impact of changes in fuel costs on our operations.
  • 2. Reconciliation of GAAP Financial Measures to Non-GAAP Financial Measures March 2004 Quarter As of March 31, Net Debt-to-Capital Ratio 2004 (in millions) Debt (including current maturities) $12,479 Capital leases (including current portion) 95 Net implied debt (5) 5,801 Total net debt $18,375 Total net debt $18,375 ESOP preferred stock 275 Shareowners' deficit (1,028) Total capital $17,622 Net debt-to-capital ratio 104% (5) Net implied debt represents the present value of our operating lease obligations, net of cash, cash equivalents and short term investments. As of March 31, Total Debt including Operating Leases 2004 (in millions) Debt (including current maturities) $12,479 Capital leases (including current portion) 95 Implied debt (6) 7,981 Total debt $20,555 (6) Implied debt represents the present value of our obligations under operating leases. Three Months Ended March 31, Capital Expenditures 2004 (in millions) Cash used by investing activities - GAAP Flight equipment additions (157) Ground property and equipment additions (92) Add: Aircraft delivered under seller-financing (55) Less: Advanced deposits, net 27 Boston airport terminal project expenditures 50 Capital expenditures ($227) Three Months Ended March 31, Cash Flow from Operations 2004 (in millions) Cash used in operating activities - GAAP ($280) Add: Pension funding 396 Adjusted cash flow $116 June 2004 Quarter and Full Year 2004 Guidance on CASM and Fuel Price Neutralized CASM Reconciliations for forward-looking guidance for CASM and fuel price neutralized CASM, excluding unusual items, have not been provided because Delta cannot project specific unusual items that may occur in future periods.
  • 3. Reconciliation of GAAP Financial Measures to Non-GAAP Financial Measures June 2004 Quarter Three Months Ended June 30, 2004 Net Loss Basic and Financial Information (in millions) Diluted EPS ($15.79) GAAP ($1,963) Items excluded: Pension settlements 117 0.94 Deferred income tax asset reserve 1,534 12.30 (1) Non-GAAP ($312) ($2.55) Three Months Ended Mainline - Operating Expenses June 30, (in millions, except where noted) 2004 2003 Mainline operating expenses $3,426 $2,738 Less: fuel expense (555) (361) Items excluded: Pension settlements (117) - Appropriations Act reimbursements - 319 Mainline operating expenses - excluding items above and fuel expense (1) (2) $2,754 $2,696 Year over year change 2.2% Three Months Ended CASM and Fuel Price Neutralized CASM June 30, (in cents, except where noted) 2004 2003 CASM 10.88 9.92 Items excluded: Pension settlements (0.30) - Appropriations Act reimbursements - 1.20 CASM - excluding (1) 10.58 11.12 Year over year change -4.9% (1) CASM - excluding 10.58 (3) Less: fuel expense (1.73) (4) Plus: current year fuel gallons x prior year fuel price 1.26 (1) (5) (6) Fuel price neutralized CASM - excluding 10.11 vs. June 2003 quarter CASM - excluding 11.12 Change -9.1% Three Months Ended Mainline - CASM and Fuel Price Neutralized CASM June 30, (in cents, except where noted) 2004 2003 Mainline CASM 10.32 9.56 Items excluded: Pension settlements (0.35) - Appropriations Act reimbursements - 1.12 Mainline CASM - excluding (1) 9.97 10.68 (7) Less: fuel expense (1.67) Plus: current year fuel gallons x prior year fuel price (8) 1.21 (1) (5) (9) Mainline fuel price neutralized CASM - excluding 9.51 vs. June 2003 quarter Mainline CASM - excluding 10.68 Change -11.0%
  • 4. Reconciliation of GAAP Financial Measures to Non-GAAP Financial Measures June 2004 Quarter Net Debt-to-Capital Ratio As of (in millions, except where noted) June 30, 2004 Debt and capital leases (including current maturities and short-term) $12,552 (10) Net implied debt 6,015 Total net debt $18,567 Total net debt $18,567 ESOP preferred stock 281 Shareowners' deficit (2,952) Total capital $15,896 Net debt-to-capital ratio 117% Total Debt including Operating Leases As of (in millions) June 30, 2004 Debt and capital leases (including current maturities and short-term) $12,552 (11) Implied debt 7,981 Total debt $20,533 Three Capital Expenditures Months Ended (in millions) June 30, 2004 Cash used by investing activities - GAAP: Aircraft (including advanced payments) ($104) Aircraft modifications and parts ($56) Total flight equipment additions (160) Ground property and equipment additions (111) Less: Advanced payments on aircraft, net 24 Boston airport terminal project expenditures 45 Capital expenditures (202) (1) We believe that providing financial and statistical data that excludes the items above is helpful to investors to evaluate recurring operational performance because (1) the deferred income tax reserve and pension settlements are not representative of current period operations and (2) the reimbursements received under the Appropriations Act in 2003 were a one-time item. (2) We believe that the exclusion of fuel expense, which has increased significantly due to historic high fuel prices, allows investors to better understand the changes in our Mainline operating expenses. (3) $669 million divided by 38.620 billion ASMs for the three months ended June 30, 2004. (4) 639 million gallons x 76.29 cents/gallon divided by 38.620 billion ASMs for the three months ended June 30, 2004. (5) Operating cost per available seat mile (ASM), adjusting average fuel price per gallon for the period to equal the average fuel price per gallon for the corresponding period in the prior year. (6) We believe this non-GAAP financial measure assists investors in understanding the impact of changes in fuel costs on our operations. (7) $555 million divided by 33.198 billion ASMs for the three months ended June 30, 2004. (8) 542 million gallons x 74.49 cents/gallon divided by 33.198 billion ASMs for the three months ended June 30, 2004. (9) We believe this non-GAAP financial measure assists investors in understanding the impact of changes in fuel costs on our Mainline operations. (10) Net implied debt represents the present value of our operating lease obligations, net of cash, cash equivalents and short term investments. (11) Implied debt represents the present value of our obligations under operating leases. September 2004 Quarter and Full Year 2004 Guidance on CASM and Fuel Price Neutralized CASM Reconciliations for forward-looking guidance for CASM and fuel price neutralized CASM, excluding unusual items, have not been provided because Delta cannot project specific unusual items that may occur in future periods.
  • 5. Reconciliation of GAAP Financial Measures to Non-GAAP Financial Measures Twelve Months Ended June 2004 Twelve Months Ended Mainline CASM - Excluding Unusual Items June 30, (in millions, except where noted) 2004 Operating expenses $15,832 Less regional affiliates' operating expenses (2,916) Mainline operating expenses 12,916 Less: Pension-related charges (329) Loss on future sale of aircraft (41) Restructuring and other reserve adjustments 21 Mainline operating expenses - excluding unusual items $12,567 Mainline ASMs 125,385 10.02 ¢ Mainline CASM - excluding unusual items Twelve Months Ended Mainline CASM - Excluding Unusual Items and Pilot Costs June 30, (in millions, except where noted) 2004 Mainline operating expenses - excluding unusual items (see above) $12,567 Less: Delta pilot costs (1,984) ** Mainline operating expenses - excluding unusual items and pilot costs $10,583 Mainline ASMs 125,385 8.44 ¢ Mainline CASM - excluding unusual items and pilot costs Twelve Months Ended Mainline CASM - Excluding Unusual Items and Labor Cost June 30, (in millions, except where noted) 2004 Mainline operating expenses - excluding unusual items (see above) $12,567 Less: Labor costs (5,688) Mainline operating expenses - excluding unusual items and labor costs $6,879 Mainline ASMs 125,385 5.49 ¢ Mainline CASM - excluding unusual items and labor costs ** Pilot benefits for the 3rd and 4th quarters of 2003 were restated in 2004 once it was determined that the allocated benefit rates for pilot benefits, which were from 2002 but still being used for 2003, were too low. The restatement moved approximately $299 million into pilot benefits from various other divisions. The net effect of the restatement on a consolidated basis was $0. This CASM calculation uses the pre-restatement pilot cost amounts for Q3 and Q4 2003. Essbase now shows the amounts post-restatement; therefore, this pilot cost amount does not agree to Essbase. If the current Essbase amounts (post-restatement) were used, the pilot costs would be $2,067 and the Mainline CASM excluding unusual items and pilot costs would be 8.37¢. Note: The presentation also includes a number for quot;interest expense per ASMquot; for the 12 months ended June 30, 2004. This number was actually calculated using consolidated non-op expense (which includes items other than just interest expense) divided by the Mainline ASMs.
  • 6. Reconciliation of GAAP Financial Measures to Non-GAAP Financial Measures Six Months Ended June 2004 Six Months Ended Mainline CASM - Excluding Unusual Items June 30, (in millions, except where noted) 2004 Operating expenses $8,119 Less regional affiliates' operating expenses (1,528) Mainline operating expenses 6,591 Less: Pension-related charges (117) Mainline operating expenses - excluding unusual items $6,474 Mainline ASMs 63,684 10.17 ¢ Mainline CASM - excluding unusual items Six Months Ended Mainline CASM - Excluding Unusual Items and Pilot Costs June 30, (in millions, except where noted) 2004 Mainline operating expenses - excluding unusual items (see above) $6,474 Less: Delta pilot costs (1,036) Mainline operating expenses - excluding unusual items and pilot costs $5,438 Mainline ASMs 63,684 8.54 ¢ Mainline CASM - excluding unusual items and pilot costs
  • 7. Reconciliation of GAAP Financial Measures to Non-GAAP Financial Measures Three Months Ended September 2004 Reconciliations of GAAP financial measures to non-GAAP financial measures for the September quarter were not required to be posted on Delta's web site since there was no analyst call for the third quarter. If you need information on the items Delta considered unusual for the third quarter, please refer to Delta's third quarter earnings press release dated October 20, 2004, which includes reconciliations for non-GAAP financial measures presented in that press release.
  • 8. Reconciliation of GAAP Financial Measures to Non-GAAP Financial Measures December 2004 Quarter Three Months Ended December 31, 2004 Net Loss Basic and Financial Information (in millions) Diluted EPS ($16.58) GAAP ($2,206) Items excluded: 1,875 14.06 Impairment of intangible assets Pension settlements, asset writedowns, restructuring and related items, net (212) (1.59) Gain from sale of investments (123) (0.92) Deferred income tax asset reserve (114) (0.85) Total items excluded 1,426 10.70 (1) Non-GAAP ($780) ($5.88) Three Months Ended CASM and Fuel Price Neutralized CASM December 31, (in cents, except where noted) 2004 2003 CASM 15.46 11.03 Items excluded: Impairment of intangible assets (4.92) - Restructuring, asset writedowns, pension settlements, and related items, net 0.56 (0.65) (1) CASM - excluding 11.10 10.38 Year over year change 6.9% CASM - excluding (1) 11.10 (3) Less: fuel expense (2.35) (4) Plus: current year fuel gallons x prior year fuel price 1.40 (1) (5) (6) Fuel price neutralized CASM - excluding 10.15 vs. December 2003 quarter CASM - excluding 10.38 Change -2.2% Three Months Ended Mainline - CASM and Fuel Price Neutralized CASM December 31, (in cents, except where noted) 2004 2003 Mainline CASM 9.75 10.61 Items excluded: Restructuring, asset writedowns, pension settlements, and related items, net 0.65 (0.76) (1) Mainline CASM - excluding 10.40 9.85 Less: fuel expense (7) (2.26) Plus: current year fuel gallons x prior year fuel price (8) 1.33 (1) (5) (6) Mainline fuel price neutralized CASM - excluding 9.47 vs. December 2003 quarter Mainline CASM - excluding 9.85 Change -3.9%
  • 9. Total Debt including Operating Leases As of December 31, (in millions) 2004 Debt and capital leases $13,898 (9) Implied debt 6,533 Total debt $20,431 Three Capital Expenditures Months Ended December 31, (in millions) 2004 Cash used by investing activities - GAAP: Flight equipment additions, including advance payments ($3) Ground property and equipment additions 95 Add: Aircraft seller financing 111 Advanced payments on aircraft, net 20 Less: Boston airport terminal project expenditures (32) Capital expenditures $191 (1) We believe that providing financial and statistical data that excludes the items above is helpful to investors to evaluate recurring operational performance because (1) the goodwill impairment charge is a one-time event and (2) the charges related to pension settlements, asset writedowns, restructuring and related items, net and the gains from the sale of equity investments are not representative of recurring operations. (2) We believe that the exclusion of fuel expense, which has increased significantly due to historic high fuel prices, allows investors to better understand the changes in our Mainline operating expenses. (3) $895 million divided by 38.143 billion ASMs for the three months ended December 31, 2004. (4) 631 million gallons x 84.65 cents/gallon divided by 38.143 billion ASMs for the three months ended December 31, 2004. (5) Operating cost per available seat mile (ASM), adjusting average fuel price per gallon for the period to equal the average fuel price per gallon for the corresponding period in the prior year. (6) We believe this non-GAAP financial measure assists investors in understanding the impact of changes in fuel costs on our operations. (7) $739 million divided by 32.714 billion ASMs for the three months ended December 31, 2004. (8) 529 million gallons x 82.45 cents/gallon divided by 32.714 billion ASMs for the three months ended December 31, 2004. (9) Implied debt represents the present value of our obligations under operating leases. March 2005 Quarter and Full Year 2005 Guidance on CASM and Fuel Price Neutralized CASM Reconciliations for forward-looking guidance for CASM and fuel price neutralized CASM, excluding unusual items, have not been provided because Delta cannot project specific unusual items that may occur in future periods.
  • 10. Reconciliation of GAAP Financial Measures to Non-GAAP Financial Measures Twelve Months Ended December 2004 Twelve Months Ended December 31, 2004 Net Loss Basic and Financial Information (in millions) Diluted EPS ($41.07) GAAP ($5,198) Items excluded: 1,875 14.76 Impairment of intangible assets Pension settlements, asset writedowns, restructuring and related items, net (41) (0.33) Gain from sale of investments (123) (0.97) Deferred income tax asset reserve 1,206 9.51 Total items excluded 2,917 22.97 (1) Non-GAAP ($2,281) ($18.10) (1) We believe that providing financial and statistical data that excludes the items above is helpful to investors to evaluate recurring operational performance because (1) the goodwill impairment charge is a one-time event and (2) the charges related to pension settlements, asset writedowns, restructuring and related items, net and the gains from the sale of equity investments are not representative of recurring operations. March 2005 Quarter and Full Year 2005 Guidance on CASM and Fuel Price Neutralized CASM Reconciliations for forward-looking guidance for CASM and fuel price neutralized CASM, excluding unusual items, have not been provided because Delta cannot project specific unusual items that may occur in future periods.