Más contenido relacionado La actualidad más candente (16) Similar a bnsfrevenuequarter 04 05 (20) 1. Burlington Northern Santa Fe Corporation
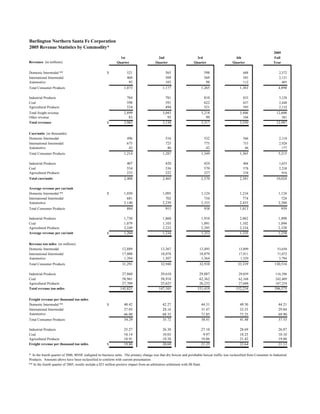
2005 Revenue Statistics by Commodity*
2005
1st 2nd 3rd 4th Full
Revenues (in millions) Quarter Quarter Quarter Quarter Year
521 565 598
Domestic Intermodal ** $ 688 2,372
460 509 569
International Intermodal 583 2,121
92 103 98
Automotive 112 405
1,073 1,177 1,265 1,383 4,898
Total Consumer Products
704 781 810
Industrial Products 833 3,128
598 591 622
Coal 637 2,448
524 494 521
Agricultural Products 593 2,132
2,899 3,043 3,218 3,446 12,606
Total freight revenue
83 95 99
Other revenue 104 381
Total revenues 2,982 3,138 3,317 3,550 12,987
$
Cars/units (in thousands)
496 516 532
Domestic Intermodal 566 2,110
675 725 775
International Intermodal 753 2,928
43 46 42
Automotive 46 177
1,214 1,287 1,349 1,365 5,215
Total Consumer Products
407 420 424
Industrial Products 404 1,655
554 536 570
Coal 578 2,238
233 222 227
Agricultural Products 234 916
Total cars/units 2,408 2,465 2,570 2,581 10,024
Average revenue per car/unit
1,050 1,095 1,124 1,216 1,124
Domestic Intermodal ** $
681 702 734 774 724
International Intermodal
2,140 2,239 2,333 2,435 2,288
Automotive
884 915 938 1,013 939
Total Consumer Products
1,730 1,860 1,910 2,062 1,890
Industrial Products
1,079 1,103 1,091 1,102 1,094
Coal
2,249 2,225 2,295 2,534 2,328
Agricultural Products
Average revenue per car/unit 1,204 1,234 1,252 1,335 1,258
$
Revenue ton miles (in millions)
12,889 13,367 13,495
Domestic Intermodal 13,899 53,650
17,008 18,074 18,079
International Intermodal 17,911 71,072
1,394 1,507 1,364
Automotive 1,529 5,794
31,291 32,948 32,938 33,339 130,516
Total Consumer Products
27,860 29,610 29,887
Industrial Products 29,039 116,396
58,961 58,918 62,362
Coal 62,168 242,409
27,709 25,625 26,232
Agricultural Products 27,688 107,254
Total revenue ton miles 145,821 147,101 151,419 152,234 596,575
Freight revenue per thousand ton miles
40.42 42.27 44.31 49.50 44.21
Domestic Intermodal ** $
27.05 28.16 31.47 32.55 29.84
International Intermodal
Automotive 66.00 68.35 71.85 73.25 69.90
34.29 35.72 38.41 41.48 37.53
Total Consumer Products
25.27 26.38 27.10 28.69 26.87
Industrial Products
10.14 10.03 9.97 10.25 10.10
Coal
18.91 19.28 19.86 21.42 19.88
Agricultural Products
Freight revenue per thousand ton miles 19.88 20.69 21.25 22.64 21.13
$
* In the fourth quarter of 2006, BNSF realigned its business units. The primary change was that dry boxcar and perishable boxcar traffic was reclassified from Consumer to Industrial
Products. Amounts above have been reclassified to conform with current presentation.
** In the fourth quarter of 2005, results include a $21 million positive impact from an arbitration settlement with JB Hunt.
2. Burlington Northern Santa Fe Corporation
2004 Revenue Statistics by Commodity
2004
1st 2nd 3rd 4th Full
Revenues (in millions) Quarter Quarter Quarter Quarter Year
449 494 524 579 2,046
Domestic Intermodal $
352 412 442 458 1,664
International Intermodal
76 81 73 85 315
Automotive
877 987 1,039 1,122 4,025
Total Consumer Products
615 673 692 690 2,670
Industrial Products
520 553 589 615 2,277
Coal
436 424 418 492 1,770
Agricultural Products
2,448 2,637 2,738 2,919 10,742
Total freight revenue
42 48 55 59 204
Other revenue
Total revenues 2,490 2,685 2,793 2,978 10,946
$
Cars/units (in thousands)
463 503 522 545 2,033
Domestic Intermodal
557 637 696 689 2,579
International Intermodal
39 41 37 41 158
Automotive
1,059 1,181 1,255 1,275 4,770
Total Consumer Products
390 411 431 418 1,650
Industrial Products
521 548 572 575 2,216
Coal
236 222 209 233 900
Agricultural Products
Total cars/units 2,206 2,362 2,467 2,501 9,536
Average revenue per car/unit
970 982 1,004 1,062 1,006
Domestic Intermodal $
632 647 635 665 645
International Intermodal
1,949 1,976 1,973 2,073 1,994
Automotive
828 836 828 880 844
Total Consumer Products
1,577 1,637 1,606 1,651 1,618
Industrial Products
998 1,009 1,030 1,070 1,028
Coal
1,847 1,910 2,000 2,112 1,967
Agricultural Products
Average revenue per car/unit 1,110 1,116 1,110 1,167 1,126
$
Revenue ton miles (in millions)
12,189 13,223 13,656 13,915 52,983
Domestic Intermodal
13,952 15,748 16,286 16,441 62,427
International Intermodal
1,116 1,224 1,085 1,293 4,718
Automotive
27,257 30,195 31,027 31,649 120,128
Total Consumer Products
26,925 28,800 29,062 28,168 112,955
Industrial Products
53,672 58,645 61,624 62,587 236,528
Coal
26,430 24,985 22,522 27,140 101,077
Agricultural Products
Total revenue ton miles 134,284 142,625 144,235 149,544 570,688
Freight revenue per thousand ton miles
36.84 37.36 38.37 41.61 38.62
Domestic Intermodal $
25.23 26.16 27.14 27.86 26.66
International Intermodal
Automotive 68.10 66.18 67.28 65.74 66.77
32.18 32.69 33.49 35.45 33.51
Total Consumer Products
22.84 23.37 23.81 24.50 23.64
Industrial Products
9.69 9.43 9.56 9.83 9.63
Coal
16.50 16.97 18.56 18.13 17.51
Agricultural Products
Freight revenue per thousand ton miles 18.23 18.49 18.98 19.52 18.82
$
* In the fourth quarter of 2006, BNSF realigned its business units. The primary change was that dry boxcar and perishable boxcar traffic was reclassified from Consumer to Industrial
Products. Amounts above have been reclassified to conform with current presentation.