Enjoy Night⚡Call Girls Patel Nagar Delhi >༒8448380779 Escort Service
qwest communications Q_1Q07Attach
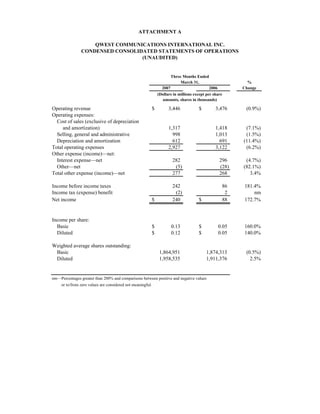
1. ATTACHMENT A
QWEST COMMUNICATIONS INTERNATIONAL INC.
CONDENSED CONSOLIDATED STATEMENTS OF OPERATIONS
(UNAUDITED)
Three Months Ended
March 31, %
2007 2006 Change
(Dollars in millions except per share
amounts, shares in thousands)
Operating revenue $ 3,446 $ 3,476 (0.9%)
Operating expenses:
Cost of sales (exclusive of depreciation
and amortization) 1,317 1,418 (7.1%)
Selling, general and administrative 998 1,013 (1.5%)
Depreciation and amortization 612 691 (11.4%)
Total operating expenses 2,927 3,122 (6.2%)
Other expense (income)—net:
Interest expense—net 282 296 (4.7%)
Other—net (5) (28) (82.1%)
Total other expense (income)—net 277 268 3.4%
Income before income taxes 242 86 181.4%
Income tax (expense) benefit (2) 2 nm
Net income $ 240 $ 88 172.7%
Income per share:
Basic 160.0%
$ 0.13 $ 0.05
Diluted $ 0.05 140.0%
$ 0.12
Weighted average shares outstanding:
Basic 1,864,951 1,874,313 (0.5%)
Diluted 1,958,535 1,911,376 2.5%
nm—Percentages greater than 200% and comparisons between positive and negative values
or to/from zero values are considered not meaningful.
2. ATTACHMENT B
QWEST COMMUNICATIONS INTERNATIONAL INC.
CONDENSED CONSOLIDATED BALANCE SHEETS
(UNAUDITED)
March 31, December 31,
2007 2006
(Dollars in millions)
ASSETS
Current assets:
Cash and cash equivalents $ 887 $ 1,241
Short-term investments 242 248
Other 2,065 2,165
Total current assets 3,194 3,654
Property, plant and equipment—net and other 17,507 17,585
Total assets $ 20,701 $ 21,239
LIABILITIES AND STOCKHOLDERS' DEFICIT
Current liabilities:
Current borrowings $ 1,688 $ 1,686
Accounts payable and other 2,946 3,474
Total current liabilities 4,634 5,160
Long-term borrowings—net 13,199 13,206
Other 4,402 4,318
Total liabilities 22,235 22,684
Stockholders' deficit (1,534) (1,445)
Total liabilities and stockholders' deficit $ 20,701 $ 21,239
3. ATTACHMENT C
QWEST COMMUNICATIONS INTERNATIONAL INC.
CONDENSED CONSOLIDATED STATEMENTS OF CASH FLOWS
(UNAUDITED)
Three Months Ended
March 31,
2007 2006
(Dollars in millions)
Cash provided by operating activities $ 268 $ 140
Cash used for investing activities (308) (392)
Cash (used for) provided by financing activities (314) 16
Decrease in cash and cash equivalents $ (354) $ (236)
4. ATTACHMENT D
QWEST COMMUNICATIONS INTERNATIONAL INC.
SELECTED CONSOLIDATED DATA
(UNAUDITED)
Three Months Ended and as of
March 31, %
2007 2006 Change
(Dollars in millions except
employees and items noted)
(1)
Operating revenue :
Wireline services revenue:
Voice services:
Local voice services:
Mass markets $ 952 $1,029 (7.5%)
Business 283 314 (9.9%)
Wholesale 159 177 (10.2%)
Total local voice services 1,394 1,520 (8.3%)
Long-distance services:
Mass markets 163 155 5.2%
Business 137 144 (4.9%)
Wholesale 250 260 (3.8%)
Total long-distance services 550 559 (1.6%)
Access services 134 146 (8.2%)
Total voice services 2,078 2,225 (6.6%)
Data, Internet and video services:
Mass markets 278 191 45.5%
Business 579 583 (0.7%)
Wholesale 363 328 10.7%
Total data Internet and video services 1,220 1,102 10.7%
Total wireline services revenue 3,298 3,327 (0.9%)
Wireless services revenue 139 139 —%
Other services revenue 9 10 (10.0%)
Total operating revenue $ 3,446 $ 3,476 (0.9%)
Other data:
(2)
Capital expenditures $ 318 $ 390 (18.5%)
:
Total employees 38,011 39,127 (2.9%)
(3)
Consumer ARPU (in dollars) : $ 52 $ 49 6.1%
In-region long distance lines (in thousands) 4,924 4,824 2.1%
High-speed Internet:
Subscribers (in thousands): 2,305 1,678 37.4%
Qualified households/businesses (in millions) 7 7 —%
(4)
Wireless :
Total wireless services revenue $ 139 $ 139 —%
End of period subscribers (in thousands) 812 784 3.6%
ARPU (in dollars) $ 50 $ 50 —%
(1)(5.)
Access lines (in thousands) :
Business access lines
Retail lines 2,842 2,958 (3.9%)
Resold lines 1,433 1,667 (14.0%)
Total business access lines 4,275 4,625 (7.6%)
Mass markets access lines
Consumer primary lines 7,200 7,749 (7.1%)
Consumer additional lines 740 876 (15.5%)
Small business lines 1,336 1,296 3.1%
Total mass markets access lines 9,276 9,921 (6.5%)
Total access lines 13,551 14,546 (6.8%)
5. ATTACHMENT D
QWEST COMMUNICATIONS INTERNATIONAL INC.
SELECTED CONSOLIDATED DATA
(UNAUDITED)
As of and for the Three
Months Ended March 31, %
2007 2006 Change
Mass markets retail connections (in thousands):
Mass markets access lines 9,276 9,921 (6.5%)
(7)
High-speed Internet subscribers 2,305 1,678 37.4%
(6)(7)
Video subscribers 506 219 131.1%
Wireless subscribers 812 784 3.6%
Total mass markets retail connections 12,899 12,602 2.4%
Minutes of use from carriers and
CLECs (in millions): 11,690 12,442 (6.0%)
(1) Certain prior year revenue and access line amounts have been reclassified to conform to the current year presentation.
(2) Capital expenditures exclude assets acquired through capital leases.
(3) Consumer ARPU (Average Revenue Per Unit) is measured as consumer wireline revenue in the period divided by the average number of
primary access lines for the period. We believe this metric can be a useful measure of the revenue performance of our consumer business
within our mass markets channel on a per-customer basis. We use ARPU internally to assess the revenue performance of our consumer
business within our mass markets channel and the impact on this business of periodic customer initiatives and product roll-outs. ARPU is not
a measure determined in accordance with accounting principles generally accepted in the United States of America, or GAAP, and should not
be considered as a substitute for our wireline services segment revenue or any other measure determined in accordance with GAAP.
(4) Wireless ARPU (Average Revenue Per Unit) is measured as the recurring portion of our wireless services revenue stream attributed to
subscribing customers (plus certain activation fees) divided by the average number of subscribers for the period. We believe this metric can
be a useful measure of the revenue performance of our wireless business on a per-customer basis. We use ARPU internally to assess the
revenue performance of our wireless business and the impact on this business of periodic customer initiatives and product roll-outs. ARPU is
not a measure determined in accordance with GAAP and should not be considered as a substitute for our wireless services segment revenue o
any other measure determined in accordance with GAAP. Wireless ARPU includes surcharges for the recovery of costs associated with
providing number portability and wireless 911 services.
Three Months Ended
March 31, %
2007 2006 Change
(Dollars in millions except
ARPU, subscribers in thousands)
ARPU is calculated as follows:
Total quarterly wireless services revenue $ 139 $ 139 —%
Less: quarterly non-recurring revenue (19) (22) (13.6%)
Quarterly recurring revenue $ 120 $ 117 2.6%
Average monthly recurring revenue $ 40 $ 39 2.6%
Divided by quarterly average
wireless subscribers 796 778 2.3%
Wireless services ARPU —%
$ 50 $ 50
(5) Access lines were reclassified during 2007 to conform to our revenue channel presentation. Resold lines include UNE lines,
unbundled loops and public pay phone lines.
(6) Video subscribers have been adjusted by approximately 9,000subscribers as of March 31, 2007, to conform to our current
presentation of video subscribers.
(7) High speed Internet subscribers and video subscribers include certain business customers.
6. ATTACHMENT E
QWEST COMMUNICATIONS INTERNATIONAL INC.
RECONCILIATION OF NON-GAAP FINANCIAL MEASURES
(UNAUDITED)
Three Months Ended
March 31,
2007 2006
(Dollars in millions)
Segment income:
Operating revenue $ 3,446 $ 3,476
Cost of sales (exclusive of depreciation
and amortization) (1,317) (1,418)
Selling, general and administrative (998) (1,013)
Segment income 1,131 1,045
EBITDA(1): 1,131 1,045
Depreciation and amortization (612) (691)
Total other expense (income)—net (277) (268)
Income tax (expense) benefit (2) 2
Net income $ 240 $ 88
EBITDA margin(1):
EBITDA $ 1,131 $ 1,045
Divided by total operating revenue $ 3,446 $ 3,476
EBITDA margin 32.8% 30.1%
Free cash flow from operations (2):
Cash provided by operating activities $ 268 $ 140
Less: expenditures for property, plant
and equipment and capitalized software (318) (390)
Free cash flow from operations (50) (250)
Add: certain one-time settlement payments 200 100
Free cash flow from operations—as adjusted $ 150 $ (150)
March 31,
2007 2006
(Dollars in millions)
Net debt(3):
Current borrowings $ 1,688 $ 604
Long-term borrowings—net 13,199 14,834
Total borrowings—net 14,887 15,438
Less: cash and cash equivalents (887) (610)
Less: short-term investments (242) (130)
Net debt $ 13,758 $ 14,698
7. ATTACHMENT E
(CONTINUED)
QWEST COMMUNICATIONS INTERNATIONAL INC.
RECONCILIATION OF NON-GAAP FINANCIAL MEASURES
(UNAUDITED)
(1) EBITDA and EBITDA Margin are non-GAAP financial measures. Other companies may calculate these
measures (or similarly titled measures) differently. We believe these measures provide useful information to
investors in evaluating our capital-intensive business because they reflect our operating performance before the
impacts of non-cash items and are indicators of our ability to service debt, pay taxes and fund discretionary
spending such as capital expenditures. Management also uses EBITDA for a number of purposes, including
setting targets for compensation and assessing the performance of our operations.
EBITDA for the three months ended March 31, 2006 includes $22 million in restructuring, realignment and
severance.
(2) Free cash flow from operations is a non-GAAP financial measure that indicates cash generated by our
business after operating expenses, capital expenditures and interest expense. We believe this measure provides
useful information to our investors for purposes of evaluating our ability to satisfy our debt and other mandatory
payment obligations and because it reflects cash flows available for financing activities, voluntary debt
repayment and to strengthen our balance sheet. This is of particular relevance for our business given our
significant debt balance. We also use free cash flow from operations internally for a variety of purposes,
including setting targets for compensation and budgeting our cash needs. Free cash flow from operations is not a
measure determined in accordance with GAAP and should not be considered as a substitute for “operating
income” or “net cash provided by operating activities” or any other measure determined in accordance with
GAAP. Due to the forward-looking nature of expected free cash flow amounts for 2007, information to reconcile
this non-GAAP financial measure is not available at this time.
(3) Net Debt is a non-GAAP financial measure that we calculate as our total borrowings (current plus long-term)
less our cash and cash equivalents and short and long-term investments. We believe net debt is helpful in
analyzing our leverage, and management uses this measure in making decisions regarding potential financings.
Net debt is not a measure determined in accordance with GAAP and should not be considered as a substitute for
“current borrowings” or “long-term borrowings” or any other measure determined in accordance with GAAP.