SlideShare una empresa de Scribd logo
1 de 7
Descargar para leer sin conexión
ATTACHMENT A

                                              QWEST COMMUNICATIONS INTERNATIONAL INC.
                                          CONDENSED CONSOLIDATED STATEMENTS OF OPERATIONS
                                                            (UNAUDITED)


                                                                                    Three Months Ended September 30,                Nine Months Ended September 30,
                                                                                    2007            2006         % Change           2007           2006         % Change
                                                                                              (Dollars in millions except per share amounts, shares in thousands)

Operating revenue......................................................         $    3,434      $     3,487          (1.5)% $ 10,343           $ 10,435              (0.9)%
Operating expenses:
 Cost of sales (exclusive of depreciation
    and amortization).................................................               1,313            1,382         (5.0)%           3,940           4,194           (6.1)%
 Selling, general and administrative ........................                        1,323            1,014         30.5 %           3,325           2,996           11.0 %
 Depreciation and amortization................................                         619              691        (10.4)%           1,846           2,075          (11.0)%
Total operating expenses............................................                 3,255            3,087          5.4 %           9,111           9,265           (1.7)%
Other expense (income)—net:
 Interest expense on long-term borrowings and
    and capital leases—net .......................................                     272              291         (6.5)%             828             885           (6.4)%
 Other—net .............................................................                (9)             (42)       (78.6)%              —              (87)           nm
Total other expense (income)—net ...........................                           263              249          5.6 %             828             798            3.8 %

(Loss) income before income taxes............................                          (84)             151           nm               404             372           8.6 %
Income tax benefit......................................................             2,149               43           nm             2,147              27           nm
Net income................................................................. $        2,065 $            194           nm        $    2,551     $       399           nm


Earnings per share:
 Basic.......................................................................   $      1.14     $      0.10           nm        $      1.39    $      0.21            nm
 Diluted....................................................................    $      1.08     $      0.09           nm        $      1.31    $      0.20            nm

Weighted average shares outstanding:
 Basic.......................................................................   1,818,683        1,901,372           (4.3)%     1,841,474       1,886,127            (2.4)%
 Diluted....................................................................    1,916,478        2,004,502           (4.4)%     1,942,152       1,962,558            (1.0)%


nm—Percentages greater than 200% and comparisons between positive and negative values or to/from zero values are considered not meaningful.
ATTACHMENT B

                                QWEST COMMUNICATIONS INTERNATIONAL INC.
                                 CONDENSED CONSOLIDATED BALANCE SHEETS
                                              (UNAUDITED)


                                                                                                            September 30,       December 31,
                                                                                                                2007                2006
                                                                                                                  (Dollars in millions)

                                             ASSETS

Current assets:
  Cash and cash equivalents................................................................                 $      1,119      $            1,241
  Short-term investments.....................................................................                         —                      248
  Other.................................................................................................           2,650                   2,165
Total current assets..............................................................................                 3,769                   3,654
Property, plant and equipment—net and other....................................                                   18,942                  17,585
Total assets..........................................................................................      $     22,711      $           21,239


LIABILITIES AND STOCKHOLDERS' EQUITY OR DEFICIT

Current liabilities:
  Current portion of long-term borrowings ........................................                          $      1,727      $            1,686
  Accounts payable and other..............................................................                         3,528                   3,474
Total current liabilities.........................................................................                 5,255                   5,160
Long-term borrowings—net................................................................                          12,779                  13,206
Other....................................................................................................          4,386                   4,318
Total liabilities.....................................................................................            22,420                  22,684
Stockholders' equity (deficit)...............................................................                        291                  (1,445)
Total liabilities and stockholders' equity or deficit..............................                         $     22,711      $           21,239
ATTACHMENT C

     QWEST COMMUNICATIONS INTERNATIONAL INC.
 CONDENSED CONSOLIDATED STATEMENTS OF CASH FLOWS
                   (UNAUDITED)


                                                            Nine Months Ended
                                                              September 30,
                                                            2007            2006
                                                            (Dollars in millions)


Cash provided by operating activities........................ $ 2,126 $ 1,929
Cash used for investing activities............................... (1,023)   (1,381)
Cash used for financing activities..............................  (1,225)     (432)
(Decrease) increase in cash and cash equivalents...... $            (122) $    116
ATTACHMENT D

                                           QWEST COMMUNICATIONS INTERNATIONAL INC.
                                                 SELECTED CONSOLIDATED DATA
                                                         (UNAUDITED)


                                                                                                                Three Months Ended and as of September 30,
                                                                                                                 2007                2006             % Change
                                                                                                                              (Dollars in millions)
Operating revenue (1):
Wireline services revenue:
 Voice services:
   Local voice services:
      Mass markets..................................................................................        $         931       $          992            (6.1)%
      Business..........................................................................................              282                  305            (7.5)%
      Wholesale.......................................................................................                149                  169           (11.8)%
   Total local voice services...................................................................                    1,362                1,466            (7.1)%
   Long-distance services:
      Mass markets..................................................................................                    162                 162             —%
      Business..........................................................................................                132                 138           (4.3)%
      Wholesale.......................................................................................                  220                 272          (19.1)%
   Total long-distance services...............................................................                          514                 572          (10.1)%

    Access services..................................................................................                 127                  139            (8.6)%
   Total voice services ..............................................................................              2,003                2,177            (8.0)%

   Data, Internet and video services:
    Mass markets.....................................................................................                 306                  225            36.0 %
    Business.............................................................................................             602                  581             3.6 %
    Wholesale..........................................................................................               371                  360             3.1 %
   Total data Internet and video services...................................................                        1,279                1,166             9.7 %

Total wireline services revenue ...............................................................                     3,282                3,343            (1.8)%
Wireless services revenue ........................................................................                    144                  135             6.7 %
Other services revenue .............................................................................                    8                    9           (11.1)%
Total operating revenue ...........................................................................         $       3,434       $        3,487            (1.5)%

Other data:
Capital expenditures (2):..........................................................................         $         420       $          394             6.6 %
Total employees........................................................................................            37,026               39,163            (5.5)%
Consumer ARPU (in dollars) (3):.............................................................                $          55       $           50            10.0 %
Broadband Services:
  Subscribers (in thousands):...................................................................                    2,516                1,973            27.5 %
  Qualified households/businesses (in millions)......................................                                   7                    7              —%

Wireless (4):
 Total wireless services revenue.............................................................                           144                 135            6.7 %
 End of period subscribers (in thousands)..............................................                                 819                 781            4.9 %
 ARPU (in dollars).................................................................................                      49                  49             —%

Access lines (in thousands) (1)(5):
  Business access lines:
    Retail lines.........................................................................................           2,803                2,900            (3.3)%
    Resold lines........................................................................................            1,338                1,564           (14.5)%
  Total business access lines....................................................................                   4,141                4,464            (7.2)%
  Mass markets access lines:
    Consumer primary lines.....................................................................                     6,860                7,454            (8.0)%
    Consumer additional lines.................................................................                        686                  803           (14.6)%
    Small business lines...........................................................................                 1,345                1,316             2.2 %
  Total mass markets access lines............................................................                       8,891                9,573            (7.1)%
Total access lines......................................................................................           13,032               14,037            (7.2)%
In-region long distance lines (in thousands).............................................                           4,871                4,900            (0.6)%
Minutes of use from carriers and CLECs (in millions):............................                                  10,635               11,796            (9.8)%
ATTACHMENT D

                                              (CONTINUED)
                                QWEST COMMUNICATIONS INTERNATIONAL INC.
                                      SELECTED CONSOLIDATED DATA
                                              (UNAUDITED)


                                                                                                                            Three Months Ended and as of September 30,
                                                                                                                             2007                       2006               % Change


Mass markets retail connections (in thousands):
 Mass markets access lines (1)................................................................                                  8,891                         9,573            (7.1)%
 Broadband subscribers (7).....................................................................                                 2,516                         1,973            27.5 %
 Video subscribers (6)(7)........................................................................                                 634                           350            81.1 %
 Wireless subscribers..............................................................................                               819                           781             4.9 %
Total mass markets retail connections......................................................                                    12,860                        12,677             1.4 %


(1) Certain prior period revenue and access line amounts have been reclassified to conform to the current period presentation.

(2) Capital expenditures exclude assets acquired through capital leases.

(3) Consumer ARPU (Average Revenue Per Unit) is measured as consumer wireline revenue in the period divided by the average number of primary
access lines for the period. We believe this metric can be a useful measure of the revenue performance of our consumer business within our mass
markets channel on a per-customer basis. We use ARPU internally to assess the revenue performance of our consumer business within our mass
markets channel and the impact on this business of periodic customer initiatives and product roll-outs. ARPU is not a measure determined in
accordance with accounting principles generally accepted in the United States of America, or GAAP, and should not be considered as a substitute
for our wireline services segment revenue or any other measure determined in accordance with GAAP.

(4) Wireless ARPU (Average Revenue Per Unit) is measured as the recurring portion of our wireless services revenue stream attributed to subscribing
customers (plus certain activation fees) divided by the average number of subscribers for the period. We believe this metric can be a useful measure of
the revenue performance of our wireless business on a per-customer basis. We use ARPU internally to assess the revenue performance of our wireless
business and the impact on this business of periodic customer initiatives and product roll-outs. ARPU is not a measure determined in accordance with
GAAP and should not be considered as a substitute for our wireless services segment revenue or any other measure determined in accordance with
GAAP. Wireless ARPU includes surcharges for the recovery of costs associated with providing number portability and wireless 911 services.


                                                                                                                                        Three Months Ended September 30,
                                                                                                                             2007                           2006           % Change
                                                                                                                                    (Dollars in millions)
              ARPU is calculated as follows:
               Total quarterly wireless services revenue...................................................... $                       144 $                       135            6.7 %
               Less: quarterly non-recurring revenue...........................................................                        (24)                        (20)          20.0 %
                 Quarterly recurring revenue........................................................................... $              120     $                   115            4.3 %

              Average monthly recurring revenue.................................................................. $                     40      $                   38            5.3 %
              Divided by quarterly average wireless subscribers (in thousands)....................                                     817                         775            5.4 %
              Wireless services ARPU (in dollars)................................................................. $                     49    $                    49                —%

(5) Access lines were reclassified during 2007 to conform to our revenue channel presentation. Resold lines include UNE lines and public pay phone
lines.

(6) Video subscribers have been adjusted by approximately 23,000 subscribers as of September 30, 2006 to conform to our current presentation of
video subscribers.

(7) Broadband and video subscribers include certain business customers.
ATTACHMENT E

                           QWEST COMMUNICATIONS INTERNATIONAL INC.
                         RECONCILIATION OF NON-GAAP FINANCIAL MEASURES
                                          (UNAUDITED)


                                                                                Three Months Ended              Nine Months Ended
                                                                                   September 30,                  September 30,
                                                                                2007            2006            2007          2006
                                                                                                (Dollars in millions)
Segment income:
  Operating revenue................................................... $          3,434     $     3,487     $ 10,343      $ 10,435
  Cost of sales (exclusive of depreciation
    and amortization) ................................................           (1,313)         (1,382)         (3,940)      (4,194)
  Selling, general and administrative ........................                   (1,323)         (1,014)         (3,325)      (2,996)
  Segment income...................................................... $            798 $         1,091 $         3,078 $      3,245

EBITDA—as adjusted (1): ...................................... $                  1,151 $         1,134 $         3,471 $      3,310
 Less: Legal reserve..................................................             (353)             —             (393)          —
 Less: Realignment, severance and related costs......                                —              (43)             —           (65)

EBITDA (1):..............................................................           798           1,091           3,078        3,245
 Depreciation and amortization................................                     (619)           (691)         (1,846)      (2,075)
 Total other expense (income)—net ........................                         (263)           (249)           (828)        (798)
 Income tax benefit...................................................            2,149              43           2,147           27
 Net income..............................................................   $     2,065 $           194 $         2,551 $        399

EBITDA margin—as adjusted (1):
 EBITDA—as adjusted ...........................................             $     1,151 $         1,134 $ 3,471 $ 3,310
 Divided by total operating revenue.........................                $     3,434 $         3,487 $ 10,343 $ 10,435
 EBITDA margin—as adjusted ...............................                        33.5%           32.5%    33.6%    31.7%

EBITDA margin (1):
 EBITDA..................................................................   $       798 $         1,091 $ 3,078 $ 3,245
 Divided by total operating revenue.........................                $     3,434 $         3,487 $ 10,343 $ 10,435
 EBITDA margin......................................................              23.2%           31.3%    29.8%    31.1%

Free cash flow from operations (2):
  Cash provided by operating activities.....................                $       753     $       752     $     2,126   $    1,929
  Less: expenditures for property, plant
    and equipment and capitalized software.............                            (420)           (394)         (1,164)      (1,226)
  Free cash flow from operations...............................                     333             358             962          703
  Add: certain one-time settlement payments............                              —               —              200          100
  Adjusted free cash flow from operations................                   $       333 $           358 $         1,162 $        803

                                                                                  September 30,
                                                                                2007            2006
                                                                                (Dollars in millions)
Net debt (3):
 Current portion of long-term borrowings................ $ 1,727 $ 1,685
 Long-term borrowings—net....................................                  12,779   13,228
 Total borrowings—net............................................              14,506   14,913
 Less: cash and cash equivalents .............................                 (1,119)    (962)
 Less: short-term investments...................................                   —      (218)
 Less: long-term investments....................................                 (119)      —
 Net debt................................................................... $ 13,268 $ 13,733
ATTACHMENT E

                                       (CONTINUED)
                        QWEST COMMUNICATIONS INTERNATIONAL INC.
                      RECONCILIATION OF NON-GAAP FINANCIAL MEASURES
                                       (UNAUDITED)


(1) EBITDA, EBITDA margin, EBITDA—as adjusted and EBITDA margin—as adjusted are non-GAAP financial measures.
Other companies may calculate these measures (or similarly titled measures) differently. We believe these measures provide useful
information to investors in evaluating our capital-intensive business because they reflect our operating performance before the
impacts of non-cash items and are indicators of our ability to service debt, pay taxes and fund discretionary spending such as
capital expenditures. Management also uses EBITDA for a number of purposes, including setting targets for compensation and
assessing the performance of our operations.

EBITDA for the three and nine months ended September 30, 2007 included $353 million and $393 million, respectively, in legal
reserve. EBITDA for the three and nine months ended September 30, 2006 included $43 million and $65 million, respectively, in
realignment, severance and related costs.

(2) Free cash flow and adjusted free cash flow from operations are non-GAAP financial measures that indicate cash generated by
our business after operating expenses, capital expenditures and interest expense. We believe these measures provide useful
information to our investors for purposes of evaluating our ability to satisfy our debt and other mandatory payment obligations and
because they reflect cash flows available for financing activities, voluntary debt repayment and to strengthen our balance sheet.
This is of particular relevance for our business given our significant debt balance. We also use free cash flow and adjusted free
cash flow from operations internally for a variety of purposes, including setting targets for compensation and budgeting our cash
needs. These measures are not determined in accordance with GAAP and should not be considered as a substitute for “operating
income” or “net cash provided by operating activities” or any other measure determined in accordance with GAAP. Due to the
forward-looking nature of expected free cash flow amounts for 2007, information to reconcile this non-GAAP financial measure is
not available at this time.

(3) Net Debt is a non-GAAP financial measure that we calculate as our total borrowings (current plus long-term) less our cash and
cash equivalents and short and long-term investments. We believe net debt is helpful in analyzing our leverage, and management
uses this measure in making decisions regarding potential financings. Net debt is not a measure determined in accordance with
GAAP and should not be considered as a substitute for “current borrowings” or “long-term borrowings” or any other measure
determined in accordance with GAAP.

Más contenido relacionado

La actualidad más candente

qwest communications Q_3Q07_Historical_v2
qwest communications Q_3Q07_Historical_v2qwest communications Q_3Q07_Historical_v2
qwest communications Q_3Q07_Historical_v2finance19
 
qwest communications Q_4Q07_profile
qwest communications Q_4Q07_profileqwest communications Q_4Q07_profile
qwest communications Q_4Q07_profilefinance19
 
.energyfutureholdings txufinancials1q01
.energyfutureholdings txufinancials1q01.energyfutureholdings txufinancials1q01
.energyfutureholdings txufinancials1q01finance29
 
danaher 01-4qrel
danaher 01-4qreldanaher 01-4qrel
danaher 01-4qrelfinance24
 
plains all american pipeline 2005 10-K part 2
plains all american pipeline   2005 10-K part 2plains all american pipeline   2005 10-K part 2
plains all american pipeline 2005 10-K part 2finance13
 
southern 2007 Narrative Section
southern 2007 Narrative Sectionsouthern 2007 Narrative Section
southern 2007 Narrative Sectionfinance17
 
qwest communications Q_2Q07_ERAttach
qwest communications Q_2Q07_ERAttachqwest communications Q_2Q07_ERAttach
qwest communications Q_2Q07_ERAttachfinance19
 
Intuit QuickBooks Enterprise Solutions
Intuit QuickBooks Enterprise SolutionsIntuit QuickBooks Enterprise Solutions
Intuit QuickBooks Enterprise Solutionsjudythornell
 
Q1_2007_10Qreliance steel & aluminum
Q1_2007_10Qreliance steel & aluminum  Q1_2007_10Qreliance steel & aluminum
Q1_2007_10Qreliance steel & aluminum finance32
 
.energyfutureholdings txufosummary2q01
.energyfutureholdings txufosummary2q01.energyfutureholdings txufosummary2q01
.energyfutureholdings txufosummary2q01finance29
 
plains all american pipeline 2004 10-K part 2
plains all american pipeline   2004 10-K part  2plains all american pipeline   2004 10-K part  2
plains all american pipeline 2004 10-K part 2finance13
 
reliance steel & aluminum Q2_2008_10Q
reliance steel & aluminum  Q2_2008_10Qreliance steel & aluminum  Q2_2008_10Q
reliance steel & aluminum Q2_2008_10Qfinance32
 
reliance steel & aluminum Q2_2007_10Q
reliance steel & aluminum  Q2_2007_10Qreliance steel & aluminum  Q2_2007_10Q
reliance steel & aluminum Q2_2007_10Qfinance32
 
slm SupplementalEarnings2Qtr07W37118991N
slm SupplementalEarnings2Qtr07W37118991Nslm SupplementalEarnings2Qtr07W37118991N
slm SupplementalEarnings2Qtr07W37118991Nfinance42
 
reliance steel & aluminum Q1_2008_10Q
reliance steel & aluminum  Q1_2008_10Qreliance steel & aluminum  Q1_2008_10Q
reliance steel & aluminum Q1_2008_10Qfinance32
 
Q2_2006_10-Q reliance steel & aluminum
Q2_2006_10-Q reliance steel & aluminum  Q2_2006_10-Q reliance steel & aluminum
Q2_2006_10-Q reliance steel & aluminum finance32
 
southern 2007 Financial Highlights
southern 2007 Financial Highlightssouthern 2007 Financial Highlights
southern 2007 Financial Highlightsfinance17
 
xcel energy Investor_Reports_2007_Q3
xcel energy Investor_Reports_2007_Q3xcel energy Investor_Reports_2007_Q3
xcel energy Investor_Reports_2007_Q3finance26
 
SuppEarnDiscQtr107W33652A_2155_N_991_1
SuppEarnDiscQtr107W33652A_2155_N_991_1SuppEarnDiscQtr107W33652A_2155_N_991_1
SuppEarnDiscQtr107W33652A_2155_N_991_1finance42
 

La actualidad más candente (20)

qwest communications Q_3Q07_Historical_v2
qwest communications Q_3Q07_Historical_v2qwest communications Q_3Q07_Historical_v2
qwest communications Q_3Q07_Historical_v2
 
qwest communications Q_4Q07_profile
qwest communications Q_4Q07_profileqwest communications Q_4Q07_profile
qwest communications Q_4Q07_profile
 
.energyfutureholdings txufinancials1q01
.energyfutureholdings txufinancials1q01.energyfutureholdings txufinancials1q01
.energyfutureholdings txufinancials1q01
 
danaher 01-4qrel
danaher 01-4qreldanaher 01-4qrel
danaher 01-4qrel
 
plains all american pipeline 2005 10-K part 2
plains all american pipeline   2005 10-K part 2plains all american pipeline   2005 10-K part 2
plains all american pipeline 2005 10-K part 2
 
southern 2007 Narrative Section
southern 2007 Narrative Sectionsouthern 2007 Narrative Section
southern 2007 Narrative Section
 
qwest communications Q_2Q07_ERAttach
qwest communications Q_2Q07_ERAttachqwest communications Q_2Q07_ERAttach
qwest communications Q_2Q07_ERAttach
 
Intuit QuickBooks Enterprise Solutions
Intuit QuickBooks Enterprise SolutionsIntuit QuickBooks Enterprise Solutions
Intuit QuickBooks Enterprise Solutions
 
Q1_2007_10Qreliance steel & aluminum
Q1_2007_10Qreliance steel & aluminum  Q1_2007_10Qreliance steel & aluminum
Q1_2007_10Qreliance steel & aluminum
 
.energyfutureholdings txufosummary2q01
.energyfutureholdings txufosummary2q01.energyfutureholdings txufosummary2q01
.energyfutureholdings txufosummary2q01
 
plains all american pipeline 2004 10-K part 2
plains all american pipeline   2004 10-K part  2plains all american pipeline   2004 10-K part  2
plains all american pipeline 2004 10-K part 2
 
reliance steel & aluminum Q2_2008_10Q
reliance steel & aluminum  Q2_2008_10Qreliance steel & aluminum  Q2_2008_10Q
reliance steel & aluminum Q2_2008_10Q
 
reliance steel & aluminum Q2_2007_10Q
reliance steel & aluminum  Q2_2007_10Qreliance steel & aluminum  Q2_2007_10Q
reliance steel & aluminum Q2_2007_10Q
 
slm SupplementalEarnings2Qtr07W37118991N
slm SupplementalEarnings2Qtr07W37118991Nslm SupplementalEarnings2Qtr07W37118991N
slm SupplementalEarnings2Qtr07W37118991N
 
reliance steel & aluminum Q1_2008_10Q
reliance steel & aluminum  Q1_2008_10Qreliance steel & aluminum  Q1_2008_10Q
reliance steel & aluminum Q1_2008_10Q
 
Q2_2006_10-Q reliance steel & aluminum
Q2_2006_10-Q reliance steel & aluminum  Q2_2006_10-Q reliance steel & aluminum
Q2_2006_10-Q reliance steel & aluminum
 
southern 2007 Financial Highlights
southern 2007 Financial Highlightssouthern 2007 Financial Highlights
southern 2007 Financial Highlights
 
xcel energy Investor_Reports_2007_Q3
xcel energy Investor_Reports_2007_Q3xcel energy Investor_Reports_2007_Q3
xcel energy Investor_Reports_2007_Q3
 
SuppEarnDiscQtr107W33652A_2155_N_991_1
SuppEarnDiscQtr107W33652A_2155_N_991_1SuppEarnDiscQtr107W33652A_2155_N_991_1
SuppEarnDiscQtr107W33652A_2155_N_991_1
 
xel_072804
xel_072804xel_072804
xel_072804
 

Destacado

AES 2007 Fact Book Update FINAL
 AES 2007 Fact Book Update FINAL AES 2007 Fact Book Update FINAL
AES 2007 Fact Book Update FINALfinance19
 
proxy_statement_08
proxy_statement_08proxy_statement_08
proxy_statement_08finance19
 
AES 2004 Summary Annual Report
AES 2004 Summary Annual ReportAES 2004 Summary Annual Report
AES 2004 Summary Annual Reportfinance19
 
qwest communications Q3 04
qwest communications Q3 04qwest communications Q3 04
qwest communications Q3 04finance19
 

Destacado (6)

AES 2007 Fact Book Update FINAL
 AES 2007 Fact Book Update FINAL AES 2007 Fact Book Update FINAL
AES 2007 Fact Book Update FINAL
 
proxy_statement_08
proxy_statement_08proxy_statement_08
proxy_statement_08
 
AES 2004 Summary Annual Report
AES 2004 Summary Annual ReportAES 2004 Summary Annual Report
AES 2004 Summary Annual Report
 
AES 10Q
AES 10QAES 10Q
AES 10Q
 
qwest communications Q3 04
qwest communications Q3 04qwest communications Q3 04
qwest communications Q3 04
 
sun 10k06
sun 10k06sun 10k06
sun 10k06
 

Similar a qwest communications Q_3Q07_ER_attach

SLM CorpSupplemental3Qtr08BOW71210BOW004_BITS_N
SLM CorpSupplemental3Qtr08BOW71210BOW004_BITS_NSLM CorpSupplemental3Qtr08BOW71210BOW004_BITS_N
SLM CorpSupplemental3Qtr08BOW71210BOW004_BITS_Nfinance42
 
BERKSHIRE HATHAWAY INC Annual & Interim Reports2004 3rd
BERKSHIRE HATHAWAY INC Annual & Interim Reports2004 3rdBERKSHIRE HATHAWAY INC Annual & Interim Reports2004 3rd
BERKSHIRE HATHAWAY INC Annual & Interim Reports2004 3rdfinance2
 
slm SuppFinInfo1Qtr07W33652A_2156_N_993
slm SuppFinInfo1Qtr07W33652A_2156_N_993slm SuppFinInfo1Qtr07W33652A_2156_N_993
slm SuppFinInfo1Qtr07W33652A_2156_N_993finance42
 
Supplemental2Qtr08BOW63513BOW004_BITS_N
Supplemental2Qtr08BOW63513BOW004_BITS_NSupplemental2Qtr08BOW63513BOW004_BITS_N
Supplemental2Qtr08BOW63513BOW004_BITS_Nfinance42
 
xel_08/15/01b
xel_08/15/01bxel_08/15/01b
xel_08/15/01bfinance26
 
xel_08/15/01b
xel_08/15/01bxel_08/15/01b
xel_08/15/01bfinance26
 
car max ar99
 car max ar99 car max ar99
car max ar99finance30
 
car max ar99
 car max ar99 car max ar99
car max ar99finance30
 
slm SupplementalBOW54522BOW006_BITS_N
slm SupplementalBOW54522BOW006_BITS_Nslm SupplementalBOW54522BOW006_BITS_N
slm SupplementalBOW54522BOW006_BITS_Nfinance42
 
goldman sachs First Quarter 2008 Form 10-Q
goldman sachs First Quarter 2008 Form 10-Q goldman sachs First Quarter 2008 Form 10-Q
goldman sachs First Quarter 2008 Form 10-Q finance2
 
slm Supplemental4Qtr08BOW72367BOW003_BITS_N_1638
slm Supplemental4Qtr08BOW72367BOW003_BITS_N_1638slm Supplemental4Qtr08BOW72367BOW003_BITS_N_1638
slm Supplemental4Qtr08BOW72367BOW003_BITS_N_1638finance42
 
SLM Corp3QTR2006SupEarnDisc
SLM Corp3QTR2006SupEarnDiscSLM Corp3QTR2006SupEarnDisc
SLM Corp3QTR2006SupEarnDiscfinance42
 
slm SupplementalEarnings4Q
slm SupplementalEarnings4Qslm SupplementalEarnings4Q
slm SupplementalEarnings4Qfinance42
 
slm 2Qtr2006SupplementalFinancialInfoFinal
slm 2Qtr2006SupplementalFinancialInfoFinalslm 2Qtr2006SupplementalFinancialInfoFinal
slm 2Qtr2006SupplementalFinancialInfoFinalfinance42
 
xel_07/25/03a
xel_07/25/03axel_07/25/03a
xel_07/25/03afinance26
 
xel_07/25/03a
xel_07/25/03axel_07/25/03a
xel_07/25/03afinance26
 

Similar a qwest communications Q_3Q07_ER_attach (20)

HSBC Finance Corporation
HSBC Finance CorporationHSBC Finance Corporation
HSBC Finance Corporation
 
HSBC Finance Corporation
HSBC Finance CorporationHSBC Finance Corporation
HSBC Finance Corporation
 
SLM CorpSupplemental3Qtr08BOW71210BOW004_BITS_N
SLM CorpSupplemental3Qtr08BOW71210BOW004_BITS_NSLM CorpSupplemental3Qtr08BOW71210BOW004_BITS_N
SLM CorpSupplemental3Qtr08BOW71210BOW004_BITS_N
 
BERKSHIRE HATHAWAY INC Annual & Interim Reports2004 3rd
BERKSHIRE HATHAWAY INC Annual & Interim Reports2004 3rdBERKSHIRE HATHAWAY INC Annual & Interim Reports2004 3rd
BERKSHIRE HATHAWAY INC Annual & Interim Reports2004 3rd
 
slm SuppFinInfo1Qtr07W33652A_2156_N_993
slm SuppFinInfo1Qtr07W33652A_2156_N_993slm SuppFinInfo1Qtr07W33652A_2156_N_993
slm SuppFinInfo1Qtr07W33652A_2156_N_993
 
Supplemental2Qtr08BOW63513BOW004_BITS_N
Supplemental2Qtr08BOW63513BOW004_BITS_NSupplemental2Qtr08BOW63513BOW004_BITS_N
Supplemental2Qtr08BOW63513BOW004_BITS_N
 
xel_08/15/01b
xel_08/15/01bxel_08/15/01b
xel_08/15/01b
 
xel_08/15/01b
xel_08/15/01bxel_08/15/01b
xel_08/15/01b
 
car max ar99
 car max ar99 car max ar99
car max ar99
 
car max ar99
 car max ar99 car max ar99
car max ar99
 
slm SupplementalBOW54522BOW006_BITS_N
slm SupplementalBOW54522BOW006_BITS_Nslm SupplementalBOW54522BOW006_BITS_N
slm SupplementalBOW54522BOW006_BITS_N
 
Q2 2009 Earning report of Adobe
Q2 2009 Earning report of AdobeQ2 2009 Earning report of Adobe
Q2 2009 Earning report of Adobe
 
goldman sachs First Quarter 2008 Form 10-Q
goldman sachs First Quarter 2008 Form 10-Q goldman sachs First Quarter 2008 Form 10-Q
goldman sachs First Quarter 2008 Form 10-Q
 
slm Supplemental4Qtr08BOW72367BOW003_BITS_N_1638
slm Supplemental4Qtr08BOW72367BOW003_BITS_N_1638slm Supplemental4Qtr08BOW72367BOW003_BITS_N_1638
slm Supplemental4Qtr08BOW72367BOW003_BITS_N_1638
 
SLM Corp3QTR2006SupEarnDisc
SLM Corp3QTR2006SupEarnDiscSLM Corp3QTR2006SupEarnDisc
SLM Corp3QTR2006SupEarnDisc
 
slm SupplementalEarnings4Q
slm SupplementalEarnings4Qslm SupplementalEarnings4Q
slm SupplementalEarnings4Q
 
slm 2Qtr2006SupplementalFinancialInfoFinal
slm 2Qtr2006SupplementalFinancialInfoFinalslm 2Qtr2006SupplementalFinancialInfoFinal
slm 2Qtr2006SupplementalFinancialInfoFinal
 
xel_07/25/03a
xel_07/25/03axel_07/25/03a
xel_07/25/03a
 
xel_07/25/03a
xel_07/25/03axel_07/25/03a
xel_07/25/03a
 
HSBC Finance Corporation
HSBC Finance CorporationHSBC Finance Corporation
HSBC Finance Corporation
 

Más de finance19

pepsi bottling Q1 Non-Gaap
  	 pepsi bottling  Q1 Non-Gaap  	 pepsi bottling  Q1 Non-Gaap
pepsi bottling Q1 Non-Gaapfinance19
 
pepsi bottling 071007nong
  	 pepsi bottling  071007nong  	 pepsi bottling  071007nong
pepsi bottling 071007nongfinance19
 
pepsi bottling pbg Non Gaap
  	 pepsi bottling  pbg Non Gaap  	 pepsi bottling  pbg Non Gaap
pepsi bottling pbg Non Gaapfinance19
 
pepsi bottling Non Gaap Investor Day121307
  	 pepsi bottling  Non Gaap Investor Day121307  	 pepsi bottling  Non Gaap Investor Day121307
pepsi bottling Non Gaap Investor Day121307finance19
 
pepsi bottling 4Q Non Gaap
  	 pepsi bottling  4Q Non Gaap  	 pepsi bottling  4Q Non Gaap
pepsi bottling 4Q Non Gaapfinance19
 
pepsi bottling Q108_NonGAAPReconciliation
  	 pepsi bottling  Q108_NonGAAPReconciliation  	 pepsi bottling  Q108_NonGAAPReconciliation
pepsi bottling Q108_NonGAAPReconciliationfinance19
 
pepsi bottling 2Q 08 Non GAAP
  	 pepsi bottling  2Q 08 Non GAAP  	 pepsi bottling  2Q 08 Non GAAP
pepsi bottling 2Q 08 Non GAAPfinance19
 
pepsi bottling Non GAA P0908
  	 pepsi bottling  Non GAA P0908  	 pepsi bottling  Non GAA P0908
pepsi bottling Non GAA P0908finance19
 
pepsi bottling library.corporate
  	 pepsi bottling library.corporate  	 pepsi bottling library.corporate
pepsi bottling library.corporatefinance19
 
pepsi bottling library.corporate
  	 pepsi bottling library.corporate  	 pepsi bottling library.corporate
pepsi bottling library.corporatefinance19
 
pepsi bottling library.corporate
  	 pepsi bottling library.corporate  	 pepsi bottling library.corporate
pepsi bottling library.corporatefinance19
 
pepsi bottling ar2000
pepsi bottling ar2000pepsi bottling ar2000
pepsi bottling ar2000finance19
 
pepsi bottlingar 01
pepsi bottlingar 01pepsi bottlingar 01
pepsi bottlingar 01finance19
 
pepsi bottling 2002
pepsi bottling 2002pepsi bottling 2002
pepsi bottling 2002finance19
 
pepsi bottling 03AR
pepsi bottling 03ARpepsi bottling 03AR
pepsi bottling 03ARfinance19
 
pepsi bottling AR 04
pepsi bottling AR 04pepsi bottling AR 04
pepsi bottling AR 04finance19
 
pepsi bottling AR_2005
pepsi bottling AR_2005pepsi bottling AR_2005
pepsi bottling AR_2005finance19
 
pepsi bottling AR_2006
pepsi bottling AR_2006pepsi bottling AR_2006
pepsi bottling AR_2006finance19
 
WorldFuel2002 Transition Annual Report
WorldFuel2002 Transition Annual ReportWorldFuel2002 Transition Annual Report
WorldFuel2002 Transition Annual Reportfinance19
 
WorldFuel 2002 Transition AnnualReport
WorldFuel 2002 Transition AnnualReportWorldFuel 2002 Transition AnnualReport
WorldFuel 2002 Transition AnnualReportfinance19
 

Más de finance19 (20)

pepsi bottling Q1 Non-Gaap
  	 pepsi bottling  Q1 Non-Gaap  	 pepsi bottling  Q1 Non-Gaap
pepsi bottling Q1 Non-Gaap
 
pepsi bottling 071007nong
  	 pepsi bottling  071007nong  	 pepsi bottling  071007nong
pepsi bottling 071007nong
 
pepsi bottling pbg Non Gaap
  	 pepsi bottling  pbg Non Gaap  	 pepsi bottling  pbg Non Gaap
pepsi bottling pbg Non Gaap
 
pepsi bottling Non Gaap Investor Day121307
  	 pepsi bottling  Non Gaap Investor Day121307  	 pepsi bottling  Non Gaap Investor Day121307
pepsi bottling Non Gaap Investor Day121307
 
pepsi bottling 4Q Non Gaap
  	 pepsi bottling  4Q Non Gaap  	 pepsi bottling  4Q Non Gaap
pepsi bottling 4Q Non Gaap
 
pepsi bottling Q108_NonGAAPReconciliation
  	 pepsi bottling  Q108_NonGAAPReconciliation  	 pepsi bottling  Q108_NonGAAPReconciliation
pepsi bottling Q108_NonGAAPReconciliation
 
pepsi bottling 2Q 08 Non GAAP
  	 pepsi bottling  2Q 08 Non GAAP  	 pepsi bottling  2Q 08 Non GAAP
pepsi bottling 2Q 08 Non GAAP
 
pepsi bottling Non GAA P0908
  	 pepsi bottling  Non GAA P0908  	 pepsi bottling  Non GAA P0908
pepsi bottling Non GAA P0908
 
pepsi bottling library.corporate
  	 pepsi bottling library.corporate  	 pepsi bottling library.corporate
pepsi bottling library.corporate
 
pepsi bottling library.corporate
  	 pepsi bottling library.corporate  	 pepsi bottling library.corporate
pepsi bottling library.corporate
 
pepsi bottling library.corporate
  	 pepsi bottling library.corporate  	 pepsi bottling library.corporate
pepsi bottling library.corporate
 
pepsi bottling ar2000
pepsi bottling ar2000pepsi bottling ar2000
pepsi bottling ar2000
 
pepsi bottlingar 01
pepsi bottlingar 01pepsi bottlingar 01
pepsi bottlingar 01
 
pepsi bottling 2002
pepsi bottling 2002pepsi bottling 2002
pepsi bottling 2002
 
pepsi bottling 03AR
pepsi bottling 03ARpepsi bottling 03AR
pepsi bottling 03AR
 
pepsi bottling AR 04
pepsi bottling AR 04pepsi bottling AR 04
pepsi bottling AR 04
 
pepsi bottling AR_2005
pepsi bottling AR_2005pepsi bottling AR_2005
pepsi bottling AR_2005
 
pepsi bottling AR_2006
pepsi bottling AR_2006pepsi bottling AR_2006
pepsi bottling AR_2006
 
WorldFuel2002 Transition Annual Report
WorldFuel2002 Transition Annual ReportWorldFuel2002 Transition Annual Report
WorldFuel2002 Transition Annual Report
 
WorldFuel 2002 Transition AnnualReport
WorldFuel 2002 Transition AnnualReportWorldFuel 2002 Transition AnnualReport
WorldFuel 2002 Transition AnnualReport
 

Último

212MTAMount Durham University Bachelor's Diploma in Technology
212MTAMount Durham University Bachelor's Diploma in Technology212MTAMount Durham University Bachelor's Diploma in Technology
212MTAMount Durham University Bachelor's Diploma in Technologyz xss
 
Call Girls Near Delhi Pride Hotel, New Delhi|9873777170
Call Girls Near Delhi Pride Hotel, New Delhi|9873777170Call Girls Near Delhi Pride Hotel, New Delhi|9873777170
Call Girls Near Delhi Pride Hotel, New Delhi|9873777170Sonam Pathan
 
government_intervention_in_business_ownership[1].pdf
government_intervention_in_business_ownership[1].pdfgovernment_intervention_in_business_ownership[1].pdf
government_intervention_in_business_ownership[1].pdfshaunmashale756
 
Vp Girls near me Delhi Call Now or WhatsApp
Vp Girls near me Delhi Call Now or WhatsAppVp Girls near me Delhi Call Now or WhatsApp
Vp Girls near me Delhi Call Now or WhatsAppmiss dipika
 
NO1 Certified Ilam kala Jadu Specialist Expert In Bahawalpur, Sargodha, Sialk...
NO1 Certified Ilam kala Jadu Specialist Expert In Bahawalpur, Sargodha, Sialk...NO1 Certified Ilam kala Jadu Specialist Expert In Bahawalpur, Sargodha, Sialk...
NO1 Certified Ilam kala Jadu Specialist Expert In Bahawalpur, Sargodha, Sialk...Amil Baba Dawood bangali
 
Stock Market Brief Deck for 4/24/24 .pdf
Stock Market Brief Deck for 4/24/24 .pdfStock Market Brief Deck for 4/24/24 .pdf
Stock Market Brief Deck for 4/24/24 .pdfMichael Silva
 
Classical Theory of Macroeconomics by Adam Smith
Classical Theory of Macroeconomics by Adam SmithClassical Theory of Macroeconomics by Adam Smith
Classical Theory of Macroeconomics by Adam SmithAdamYassin2
 
Economics, Commerce and Trade Management: An International Journal (ECTIJ)
Economics, Commerce and Trade Management: An International Journal (ECTIJ)Economics, Commerce and Trade Management: An International Journal (ECTIJ)
Economics, Commerce and Trade Management: An International Journal (ECTIJ)ECTIJ
 
How Automation is Driving Efficiency Through the Last Mile of Reporting
How Automation is Driving Efficiency Through the Last Mile of ReportingHow Automation is Driving Efficiency Through the Last Mile of Reporting
How Automation is Driving Efficiency Through the Last Mile of ReportingAggregage
 
Bladex Earnings Call Presentation 1Q2024
Bladex Earnings Call Presentation 1Q2024Bladex Earnings Call Presentation 1Q2024
Bladex Earnings Call Presentation 1Q2024Bladex
 
call girls in Nand Nagri (DELHI) 🔝 >༒9953330565🔝 genuine Escort Service 🔝✔️✔️
call girls in  Nand Nagri (DELHI) 🔝 >༒9953330565🔝 genuine Escort Service 🔝✔️✔️call girls in  Nand Nagri (DELHI) 🔝 >༒9953330565🔝 genuine Escort Service 🔝✔️✔️
call girls in Nand Nagri (DELHI) 🔝 >༒9953330565🔝 genuine Escort Service 🔝✔️✔️9953056974 Low Rate Call Girls In Saket, Delhi NCR
 
Lundin Gold April 2024 Corporate Presentation v4.pdf
Lundin Gold April 2024 Corporate Presentation v4.pdfLundin Gold April 2024 Corporate Presentation v4.pdf
Lundin Gold April 2024 Corporate Presentation v4.pdfAdnet Communications
 
NO1 WorldWide Love marriage specialist baba ji Amil Baba Kala ilam powerful v...
NO1 WorldWide Love marriage specialist baba ji Amil Baba Kala ilam powerful v...NO1 WorldWide Love marriage specialist baba ji Amil Baba Kala ilam powerful v...
NO1 WorldWide Love marriage specialist baba ji Amil Baba Kala ilam powerful v...Amil baba
 
Stock Market Brief Deck for "this does not happen often".pdf
Stock Market Brief Deck for "this does not happen often".pdfStock Market Brief Deck for "this does not happen often".pdf
Stock Market Brief Deck for "this does not happen often".pdfMichael Silva
 
Call Girls Near Me WhatsApp:+91-9833363713
Call Girls Near Me WhatsApp:+91-9833363713Call Girls Near Me WhatsApp:+91-9833363713
Call Girls Near Me WhatsApp:+91-9833363713Sonam Pathan
 
PMFBY , Pradhan Mantri Fasal bima yojna
PMFBY , Pradhan Mantri  Fasal bima yojnaPMFBY , Pradhan Mantri  Fasal bima yojna
PMFBY , Pradhan Mantri Fasal bima yojnaDharmendra Kumar
 
Monthly Market Risk Update: April 2024 [SlideShare]
Monthly Market Risk Update: April 2024 [SlideShare]Monthly Market Risk Update: April 2024 [SlideShare]
Monthly Market Risk Update: April 2024 [SlideShare]Commonwealth
 
letter-from-the-chair-to-the-fca-relating-to-british-steel-pensions-scheme-15...
letter-from-the-chair-to-the-fca-relating-to-british-steel-pensions-scheme-15...letter-from-the-chair-to-the-fca-relating-to-british-steel-pensions-scheme-15...
letter-from-the-chair-to-the-fca-relating-to-british-steel-pensions-scheme-15...Henry Tapper
 
fca-bsps-decision-letter-redacted (1).pdf
fca-bsps-decision-letter-redacted (1).pdffca-bsps-decision-letter-redacted (1).pdf
fca-bsps-decision-letter-redacted (1).pdfHenry Tapper
 
NO1 WorldWide Genuine vashikaran specialist Vashikaran baba near Lahore Vashi...
NO1 WorldWide Genuine vashikaran specialist Vashikaran baba near Lahore Vashi...NO1 WorldWide Genuine vashikaran specialist Vashikaran baba near Lahore Vashi...
NO1 WorldWide Genuine vashikaran specialist Vashikaran baba near Lahore Vashi...Amil baba
 

Último (20)

212MTAMount Durham University Bachelor's Diploma in Technology
212MTAMount Durham University Bachelor's Diploma in Technology212MTAMount Durham University Bachelor's Diploma in Technology
212MTAMount Durham University Bachelor's Diploma in Technology
 
Call Girls Near Delhi Pride Hotel, New Delhi|9873777170
Call Girls Near Delhi Pride Hotel, New Delhi|9873777170Call Girls Near Delhi Pride Hotel, New Delhi|9873777170
Call Girls Near Delhi Pride Hotel, New Delhi|9873777170
 
government_intervention_in_business_ownership[1].pdf
government_intervention_in_business_ownership[1].pdfgovernment_intervention_in_business_ownership[1].pdf
government_intervention_in_business_ownership[1].pdf
 
Vp Girls near me Delhi Call Now or WhatsApp
Vp Girls near me Delhi Call Now or WhatsAppVp Girls near me Delhi Call Now or WhatsApp
Vp Girls near me Delhi Call Now or WhatsApp
 
NO1 Certified Ilam kala Jadu Specialist Expert In Bahawalpur, Sargodha, Sialk...
NO1 Certified Ilam kala Jadu Specialist Expert In Bahawalpur, Sargodha, Sialk...NO1 Certified Ilam kala Jadu Specialist Expert In Bahawalpur, Sargodha, Sialk...
NO1 Certified Ilam kala Jadu Specialist Expert In Bahawalpur, Sargodha, Sialk...
 
Stock Market Brief Deck for 4/24/24 .pdf
Stock Market Brief Deck for 4/24/24 .pdfStock Market Brief Deck for 4/24/24 .pdf
Stock Market Brief Deck for 4/24/24 .pdf
 
Classical Theory of Macroeconomics by Adam Smith
Classical Theory of Macroeconomics by Adam SmithClassical Theory of Macroeconomics by Adam Smith
Classical Theory of Macroeconomics by Adam Smith
 
Economics, Commerce and Trade Management: An International Journal (ECTIJ)
Economics, Commerce and Trade Management: An International Journal (ECTIJ)Economics, Commerce and Trade Management: An International Journal (ECTIJ)
Economics, Commerce and Trade Management: An International Journal (ECTIJ)
 
How Automation is Driving Efficiency Through the Last Mile of Reporting
How Automation is Driving Efficiency Through the Last Mile of ReportingHow Automation is Driving Efficiency Through the Last Mile of Reporting
How Automation is Driving Efficiency Through the Last Mile of Reporting
 
Bladex Earnings Call Presentation 1Q2024
Bladex Earnings Call Presentation 1Q2024Bladex Earnings Call Presentation 1Q2024
Bladex Earnings Call Presentation 1Q2024
 
call girls in Nand Nagri (DELHI) 🔝 >༒9953330565🔝 genuine Escort Service 🔝✔️✔️
call girls in  Nand Nagri (DELHI) 🔝 >༒9953330565🔝 genuine Escort Service 🔝✔️✔️call girls in  Nand Nagri (DELHI) 🔝 >༒9953330565🔝 genuine Escort Service 🔝✔️✔️
call girls in Nand Nagri (DELHI) 🔝 >༒9953330565🔝 genuine Escort Service 🔝✔️✔️
 
Lundin Gold April 2024 Corporate Presentation v4.pdf
Lundin Gold April 2024 Corporate Presentation v4.pdfLundin Gold April 2024 Corporate Presentation v4.pdf
Lundin Gold April 2024 Corporate Presentation v4.pdf
 
NO1 WorldWide Love marriage specialist baba ji Amil Baba Kala ilam powerful v...
NO1 WorldWide Love marriage specialist baba ji Amil Baba Kala ilam powerful v...NO1 WorldWide Love marriage specialist baba ji Amil Baba Kala ilam powerful v...
NO1 WorldWide Love marriage specialist baba ji Amil Baba Kala ilam powerful v...
 
Stock Market Brief Deck for "this does not happen often".pdf
Stock Market Brief Deck for "this does not happen often".pdfStock Market Brief Deck for "this does not happen often".pdf
Stock Market Brief Deck for "this does not happen often".pdf
 
Call Girls Near Me WhatsApp:+91-9833363713
Call Girls Near Me WhatsApp:+91-9833363713Call Girls Near Me WhatsApp:+91-9833363713
Call Girls Near Me WhatsApp:+91-9833363713
 
PMFBY , Pradhan Mantri Fasal bima yojna
PMFBY , Pradhan Mantri  Fasal bima yojnaPMFBY , Pradhan Mantri  Fasal bima yojna
PMFBY , Pradhan Mantri Fasal bima yojna
 
Monthly Market Risk Update: April 2024 [SlideShare]
Monthly Market Risk Update: April 2024 [SlideShare]Monthly Market Risk Update: April 2024 [SlideShare]
Monthly Market Risk Update: April 2024 [SlideShare]
 
letter-from-the-chair-to-the-fca-relating-to-british-steel-pensions-scheme-15...
letter-from-the-chair-to-the-fca-relating-to-british-steel-pensions-scheme-15...letter-from-the-chair-to-the-fca-relating-to-british-steel-pensions-scheme-15...
letter-from-the-chair-to-the-fca-relating-to-british-steel-pensions-scheme-15...
 
fca-bsps-decision-letter-redacted (1).pdf
fca-bsps-decision-letter-redacted (1).pdffca-bsps-decision-letter-redacted (1).pdf
fca-bsps-decision-letter-redacted (1).pdf
 
NO1 WorldWide Genuine vashikaran specialist Vashikaran baba near Lahore Vashi...
NO1 WorldWide Genuine vashikaran specialist Vashikaran baba near Lahore Vashi...NO1 WorldWide Genuine vashikaran specialist Vashikaran baba near Lahore Vashi...
NO1 WorldWide Genuine vashikaran specialist Vashikaran baba near Lahore Vashi...
 

qwest communications Q_3Q07_ER_attach

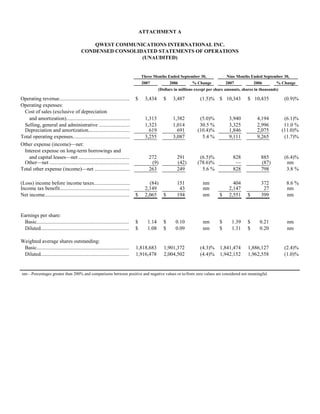
  • 1. ATTACHMENT A QWEST COMMUNICATIONS INTERNATIONAL INC. CONDENSED CONSOLIDATED STATEMENTS OF OPERATIONS (UNAUDITED) Three Months Ended September 30, Nine Months Ended September 30, 2007 2006 % Change 2007 2006 % Change (Dollars in millions except per share amounts, shares in thousands) Operating revenue...................................................... $ 3,434 $ 3,487 (1.5)% $ 10,343 $ 10,435 (0.9)% Operating expenses: Cost of sales (exclusive of depreciation and amortization)................................................. 1,313 1,382 (5.0)% 3,940 4,194 (6.1)% Selling, general and administrative ........................ 1,323 1,014 30.5 % 3,325 2,996 11.0 % Depreciation and amortization................................ 619 691 (10.4)% 1,846 2,075 (11.0)% Total operating expenses............................................ 3,255 3,087 5.4 % 9,111 9,265 (1.7)% Other expense (income)—net: Interest expense on long-term borrowings and and capital leases—net ....................................... 272 291 (6.5)% 828 885 (6.4)% Other—net ............................................................. (9) (42) (78.6)% — (87) nm Total other expense (income)—net ........................... 263 249 5.6 % 828 798 3.8 % (Loss) income before income taxes............................ (84) 151 nm 404 372 8.6 % Income tax benefit...................................................... 2,149 43 nm 2,147 27 nm Net income................................................................. $ 2,065 $ 194 nm $ 2,551 $ 399 nm Earnings per share: Basic....................................................................... $ 1.14 $ 0.10 nm $ 1.39 $ 0.21 nm Diluted.................................................................... $ 1.08 $ 0.09 nm $ 1.31 $ 0.20 nm Weighted average shares outstanding: Basic....................................................................... 1,818,683 1,901,372 (4.3)% 1,841,474 1,886,127 (2.4)% Diluted.................................................................... 1,916,478 2,004,502 (4.4)% 1,942,152 1,962,558 (1.0)% nm—Percentages greater than 200% and comparisons between positive and negative values or to/from zero values are considered not meaningful.
  • 2. ATTACHMENT B QWEST COMMUNICATIONS INTERNATIONAL INC. CONDENSED CONSOLIDATED BALANCE SHEETS (UNAUDITED) September 30, December 31, 2007 2006 (Dollars in millions) ASSETS Current assets: Cash and cash equivalents................................................................ $ 1,119 $ 1,241 Short-term investments..................................................................... — 248 Other................................................................................................. 2,650 2,165 Total current assets.............................................................................. 3,769 3,654 Property, plant and equipment—net and other.................................... 18,942 17,585 Total assets.......................................................................................... $ 22,711 $ 21,239 LIABILITIES AND STOCKHOLDERS' EQUITY OR DEFICIT Current liabilities: Current portion of long-term borrowings ........................................ $ 1,727 $ 1,686 Accounts payable and other.............................................................. 3,528 3,474 Total current liabilities......................................................................... 5,255 5,160 Long-term borrowings—net................................................................ 12,779 13,206 Other.................................................................................................... 4,386 4,318 Total liabilities..................................................................................... 22,420 22,684 Stockholders' equity (deficit)............................................................... 291 (1,445) Total liabilities and stockholders' equity or deficit.............................. $ 22,711 $ 21,239
  • 3. ATTACHMENT C QWEST COMMUNICATIONS INTERNATIONAL INC. CONDENSED CONSOLIDATED STATEMENTS OF CASH FLOWS (UNAUDITED) Nine Months Ended September 30, 2007 2006 (Dollars in millions) Cash provided by operating activities........................ $ 2,126 $ 1,929 Cash used for investing activities............................... (1,023) (1,381) Cash used for financing activities.............................. (1,225) (432) (Decrease) increase in cash and cash equivalents...... $ (122) $ 116
  • 4. ATTACHMENT D QWEST COMMUNICATIONS INTERNATIONAL INC. SELECTED CONSOLIDATED DATA (UNAUDITED) Three Months Ended and as of September 30, 2007 2006 % Change (Dollars in millions) Operating revenue (1): Wireline services revenue: Voice services: Local voice services: Mass markets.................................................................................. $ 931 $ 992 (6.1)% Business.......................................................................................... 282 305 (7.5)% Wholesale....................................................................................... 149 169 (11.8)% Total local voice services................................................................... 1,362 1,466 (7.1)% Long-distance services: Mass markets.................................................................................. 162 162 —% Business.......................................................................................... 132 138 (4.3)% Wholesale....................................................................................... 220 272 (19.1)% Total long-distance services............................................................... 514 572 (10.1)% Access services.................................................................................. 127 139 (8.6)% Total voice services .............................................................................. 2,003 2,177 (8.0)% Data, Internet and video services: Mass markets..................................................................................... 306 225 36.0 % Business............................................................................................. 602 581 3.6 % Wholesale.......................................................................................... 371 360 3.1 % Total data Internet and video services................................................... 1,279 1,166 9.7 % Total wireline services revenue ............................................................... 3,282 3,343 (1.8)% Wireless services revenue ........................................................................ 144 135 6.7 % Other services revenue ............................................................................. 8 9 (11.1)% Total operating revenue ........................................................................... $ 3,434 $ 3,487 (1.5)% Other data: Capital expenditures (2):.......................................................................... $ 420 $ 394 6.6 % Total employees........................................................................................ 37,026 39,163 (5.5)% Consumer ARPU (in dollars) (3):............................................................. $ 55 $ 50 10.0 % Broadband Services: Subscribers (in thousands):................................................................... 2,516 1,973 27.5 % Qualified households/businesses (in millions)...................................... 7 7 —% Wireless (4): Total wireless services revenue............................................................. 144 135 6.7 % End of period subscribers (in thousands).............................................. 819 781 4.9 % ARPU (in dollars)................................................................................. 49 49 —% Access lines (in thousands) (1)(5): Business access lines: Retail lines......................................................................................... 2,803 2,900 (3.3)% Resold lines........................................................................................ 1,338 1,564 (14.5)% Total business access lines.................................................................... 4,141 4,464 (7.2)% Mass markets access lines: Consumer primary lines..................................................................... 6,860 7,454 (8.0)% Consumer additional lines................................................................. 686 803 (14.6)% Small business lines........................................................................... 1,345 1,316 2.2 % Total mass markets access lines............................................................ 8,891 9,573 (7.1)% Total access lines...................................................................................... 13,032 14,037 (7.2)% In-region long distance lines (in thousands)............................................. 4,871 4,900 (0.6)% Minutes of use from carriers and CLECs (in millions):............................ 10,635 11,796 (9.8)%
  • 5. ATTACHMENT D (CONTINUED) QWEST COMMUNICATIONS INTERNATIONAL INC. SELECTED CONSOLIDATED DATA (UNAUDITED) Three Months Ended and as of September 30, 2007 2006 % Change Mass markets retail connections (in thousands): Mass markets access lines (1)................................................................ 8,891 9,573 (7.1)% Broadband subscribers (7)..................................................................... 2,516 1,973 27.5 % Video subscribers (6)(7)........................................................................ 634 350 81.1 % Wireless subscribers.............................................................................. 819 781 4.9 % Total mass markets retail connections...................................................... 12,860 12,677 1.4 % (1) Certain prior period revenue and access line amounts have been reclassified to conform to the current period presentation. (2) Capital expenditures exclude assets acquired through capital leases. (3) Consumer ARPU (Average Revenue Per Unit) is measured as consumer wireline revenue in the period divided by the average number of primary access lines for the period. We believe this metric can be a useful measure of the revenue performance of our consumer business within our mass markets channel on a per-customer basis. We use ARPU internally to assess the revenue performance of our consumer business within our mass markets channel and the impact on this business of periodic customer initiatives and product roll-outs. ARPU is not a measure determined in accordance with accounting principles generally accepted in the United States of America, or GAAP, and should not be considered as a substitute for our wireline services segment revenue or any other measure determined in accordance with GAAP. (4) Wireless ARPU (Average Revenue Per Unit) is measured as the recurring portion of our wireless services revenue stream attributed to subscribing customers (plus certain activation fees) divided by the average number of subscribers for the period. We believe this metric can be a useful measure of the revenue performance of our wireless business on a per-customer basis. We use ARPU internally to assess the revenue performance of our wireless business and the impact on this business of periodic customer initiatives and product roll-outs. ARPU is not a measure determined in accordance with GAAP and should not be considered as a substitute for our wireless services segment revenue or any other measure determined in accordance with GAAP. Wireless ARPU includes surcharges for the recovery of costs associated with providing number portability and wireless 911 services. Three Months Ended September 30, 2007 2006 % Change (Dollars in millions) ARPU is calculated as follows: Total quarterly wireless services revenue...................................................... $ 144 $ 135 6.7 % Less: quarterly non-recurring revenue........................................................... (24) (20) 20.0 % Quarterly recurring revenue........................................................................... $ 120 $ 115 4.3 % Average monthly recurring revenue.................................................................. $ 40 $ 38 5.3 % Divided by quarterly average wireless subscribers (in thousands).................... 817 775 5.4 % Wireless services ARPU (in dollars)................................................................. $ 49 $ 49 —% (5) Access lines were reclassified during 2007 to conform to our revenue channel presentation. Resold lines include UNE lines and public pay phone lines. (6) Video subscribers have been adjusted by approximately 23,000 subscribers as of September 30, 2006 to conform to our current presentation of video subscribers. (7) Broadband and video subscribers include certain business customers.
  • 6. ATTACHMENT E QWEST COMMUNICATIONS INTERNATIONAL INC. RECONCILIATION OF NON-GAAP FINANCIAL MEASURES (UNAUDITED) Three Months Ended Nine Months Ended September 30, September 30, 2007 2006 2007 2006 (Dollars in millions) Segment income: Operating revenue................................................... $ 3,434 $ 3,487 $ 10,343 $ 10,435 Cost of sales (exclusive of depreciation and amortization) ................................................ (1,313) (1,382) (3,940) (4,194) Selling, general and administrative ........................ (1,323) (1,014) (3,325) (2,996) Segment income...................................................... $ 798 $ 1,091 $ 3,078 $ 3,245 EBITDA—as adjusted (1): ...................................... $ 1,151 $ 1,134 $ 3,471 $ 3,310 Less: Legal reserve.................................................. (353) — (393) — Less: Realignment, severance and related costs...... — (43) — (65) EBITDA (1):.............................................................. 798 1,091 3,078 3,245 Depreciation and amortization................................ (619) (691) (1,846) (2,075) Total other expense (income)—net ........................ (263) (249) (828) (798) Income tax benefit................................................... 2,149 43 2,147 27 Net income.............................................................. $ 2,065 $ 194 $ 2,551 $ 399 EBITDA margin—as adjusted (1): EBITDA—as adjusted ........................................... $ 1,151 $ 1,134 $ 3,471 $ 3,310 Divided by total operating revenue......................... $ 3,434 $ 3,487 $ 10,343 $ 10,435 EBITDA margin—as adjusted ............................... 33.5% 32.5% 33.6% 31.7% EBITDA margin (1): EBITDA.................................................................. $ 798 $ 1,091 $ 3,078 $ 3,245 Divided by total operating revenue......................... $ 3,434 $ 3,487 $ 10,343 $ 10,435 EBITDA margin...................................................... 23.2% 31.3% 29.8% 31.1% Free cash flow from operations (2): Cash provided by operating activities..................... $ 753 $ 752 $ 2,126 $ 1,929 Less: expenditures for property, plant and equipment and capitalized software............. (420) (394) (1,164) (1,226) Free cash flow from operations............................... 333 358 962 703 Add: certain one-time settlement payments............ — — 200 100 Adjusted free cash flow from operations................ $ 333 $ 358 $ 1,162 $ 803 September 30, 2007 2006 (Dollars in millions) Net debt (3): Current portion of long-term borrowings................ $ 1,727 $ 1,685 Long-term borrowings—net.................................... 12,779 13,228 Total borrowings—net............................................ 14,506 14,913 Less: cash and cash equivalents ............................. (1,119) (962) Less: short-term investments................................... — (218) Less: long-term investments.................................... (119) — Net debt................................................................... $ 13,268 $ 13,733
  • 7. ATTACHMENT E (CONTINUED) QWEST COMMUNICATIONS INTERNATIONAL INC. RECONCILIATION OF NON-GAAP FINANCIAL MEASURES (UNAUDITED) (1) EBITDA, EBITDA margin, EBITDA—as adjusted and EBITDA margin—as adjusted are non-GAAP financial measures. Other companies may calculate these measures (or similarly titled measures) differently. We believe these measures provide useful information to investors in evaluating our capital-intensive business because they reflect our operating performance before the impacts of non-cash items and are indicators of our ability to service debt, pay taxes and fund discretionary spending such as capital expenditures. Management also uses EBITDA for a number of purposes, including setting targets for compensation and assessing the performance of our operations. EBITDA for the three and nine months ended September 30, 2007 included $353 million and $393 million, respectively, in legal reserve. EBITDA for the three and nine months ended September 30, 2006 included $43 million and $65 million, respectively, in realignment, severance and related costs. (2) Free cash flow and adjusted free cash flow from operations are non-GAAP financial measures that indicate cash generated by our business after operating expenses, capital expenditures and interest expense. We believe these measures provide useful information to our investors for purposes of evaluating our ability to satisfy our debt and other mandatory payment obligations and because they reflect cash flows available for financing activities, voluntary debt repayment and to strengthen our balance sheet. This is of particular relevance for our business given our significant debt balance. We also use free cash flow and adjusted free cash flow from operations internally for a variety of purposes, including setting targets for compensation and budgeting our cash needs. These measures are not determined in accordance with GAAP and should not be considered as a substitute for “operating income” or “net cash provided by operating activities” or any other measure determined in accordance with GAAP. Due to the forward-looking nature of expected free cash flow amounts for 2007, information to reconcile this non-GAAP financial measure is not available at this time. (3) Net Debt is a non-GAAP financial measure that we calculate as our total borrowings (current plus long-term) less our cash and cash equivalents and short and long-term investments. We believe net debt is helpful in analyzing our leverage, and management uses this measure in making decisions regarding potential financings. Net debt is not a measure determined in accordance with GAAP and should not be considered as a substitute for “current borrowings” or “long-term borrowings” or any other measure determined in accordance with GAAP.