
Recomendados
Más contenido relacionado
La actualidad más candente
La actualidad más candente (16)
Destacado
Similar a marriott international Financial Tables
Similar a marriott international Financial Tables (20)
Más de finance20
Más de finance20 (20)
Último
Último (20)
marriott international Financial Tables
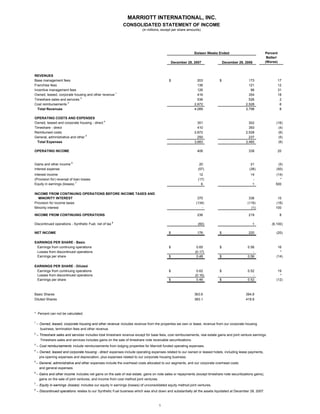
- 1. MARRIOTT INTERNATIONAL, INC. CONSOLIDATED STATEMENT OF INCOME (in millions, except per share amounts) Sixteen Weeks Ended Percent Better/ (Worse) December 28, 2007 December 29, 2006 REVENUES Base management fees $ 203 $ 173 17 Franchise fees 136 121 12 Incentive management fees 126 96 31 Owned, leased, corporate housing and other revenue 1 416 354 18 2 Timeshare sales and services 536 526 2 3 Cost reimbursements 2,672 2,528 6 Total Revenues 4,089 3,798 8 OPERATING COSTS AND EXPENSES 4 Owned, leased and corporate housing - direct 351 302 (16) Timeshare - direct 410 393 (4) Reimbursed costs 2,672 2,528 (6) General, administrative and other 5 250 237 (5) Total Expenses 3,683 3,460 (6) OPERATING INCOME 406 338 20 6 Gains and other income 20 21 (5) Interest expense (57) (38) (50) Interest income 12 14 (14) (Provision for) reversal of loan losses (17) - * Equity in earnings (losses) 7 6 1 500 INCOME FROM CONTINUING OPERATIONS BEFORE INCOME TAXES AND MINORITY INTEREST 370 336 10 Provision for income taxes (134) (116) (16) Minority interest - (1) 100 INCOME FROM CONTINUING OPERATIONS 236 219 8 8 Discontinued operations - Synthetic Fuel, net of tax (60) 1 (6,100) NET INCOME $ 176 $ 220 (20) EARNINGS PER SHARE - Basic Earnings from continuing operations $ 0.65 $ 0.56 16 Losses from discontinued operations (0.17) - * Earnings per share $ 0.48 $ 0.56 (14) EARNINGS PER SHARE - Diluted Earnings from continuing operations $ 0.62 $ 0.52 19 Losses from discontinued operations (0.16) - * Earnings per share $ 0.46 $ 0.52 (12) Basic Shares 363.6 394.8 Diluted Shares 383.1 419.9 * Percent can not be calculated. 1 – Owned, leased, corporate housing and other revenue includes revenue from the properties we own or lease, revenue from our corporate housing business, termination fees and other revenue. 2 – Timeshare sales and services includes total timeshare revenue except for base fees, cost reimbursements, real estate gains and joint venture earnings. Timeshare sales and services includes gains on the sale of timeshare note receivable securitizations. 3 – Cost reimbursements include reimbursements from lodging properties for Marriott funded operating expenses. 4 – Owned, leased and corporate housing - direct expenses include operating expenses related to our owned or leased hotels, including lease payments, pre-opening expenses and depreciation, plus expenses related to our corporate housing business. 5 – General, administrative and other expenses include the overhead costs allocated to our segments, and our corporate overhead costs and general expenses. 6 – Gains and other income includes net gains on the sale of real estate, gains on note sales or repayments (except timeshare note securitizations gains), gains on the sale of joint ventures, and income from cost method joint ventures. 7 Equity in earnings (losses) includes our equity in earnings (losses) of unconsolidated equity method joint ventures. – 8 – Discontinued operations relates to our Synthetic Fuel business which was shut down and substantially all the assets liquidated at December 28, 2007. 1
- 2. MARRIOTT INTERNATIONAL, INC. CONSOLIDATED STATEMENT OF INCOME (in millions, except per share amounts) Fifty-Two Weeks Ended Percent Better/ December 28, 2007 December 29, 2006 (Worse) REVENUES Base management fees $ 620 $ 553 12 Franchise fees 439 390 13 Incentive management fees 369 281 31 Owned, leased, corporate housing and other revenue1 1,240 1,119 11 Timeshare sales and services 2 1,747 1,577 11 Cost reimbursements 3 8,575 8,075 6 Total Revenues 12,990 11,995 8 OPERATING COSTS AND EXPENSES Owned, leased and corporate housing - direct 4 1,062 936 (13) Timeshare - direct 1,397 1,220 (15) Reimbursed costs 8,575 8,075 (6) General, administrative and other 5 768 677 (13) Total Expenses 11,802 10,908 (8) OPERATING INCOME 1,188 1,087 9 Gains and other income 6 97 74 31 Interest expense (184) (124) (48) Interest income 38 49 (22) (Provision for) reversal of loan losses (17) 3 (667) Equity in earnings (losses) 7 15 3 400 INCOME FROM CONTINUING OPERATIONS BEFORE INCOME TAXES AND MINORITY INTEREST 1,137 1,092 4 Provision for income taxes (441) (380) (16) Minority interest 1 - * INCOME FROM CONTINUING OPERATIONS 697 712 (2) Discontinued operations - Synthetic Fuel, net of tax8 (1) 5 (120) INCOME BEFORE CUMULATIVE EFFECT OF CHANGE IN ACCOUNTING PRINCIPLE 696 717 (3) 9 Cumulative effect of change in accounting principle, net of tax - (109) 100 NET INCOME $ 696 $ 608 14 EARNINGS PER SHARE - Basic Earnings from continuing operations $ 1.85 $ 1.76 5 Earnings from discontinued operations - 0.01 (100) Losses from cumulative effect of change in accounting principle - (0.27) 100 Earnings per share $ 1.85 $ 1.50 23 EARNINGS PER SHARE - Diluted Earnings from continuing operations $ 1.75 $ 1.65 6 Earnings from discontinued operations - 0.01 (100) Losses from cumulative effect of change in accounting principle - (0.25) 100 Earnings per share $ 1.75 $ 1.41 24 Basic Shares 376.1 404.1 Diluted Shares 397.3 430.2 * Percent can not be calculated. 1 – Owned, leased, corporate housing and other revenue includes revenue from the properties we own or lease, revenue from our corporate housing business, termination fees and other revenue. 2 – Timeshare sales and services includes total timeshare revenue except for base fees, cost reimbursements, real estate gains and joint venture earnings. Timeshare sales and services includes gains on the sale of timeshare note receivable securitizations. 3 – Cost reimbursements include reimbursements from lodging properties for Marriott funded operating expenses. 4 – Owned, leased and corporate housing - direct expenses include operating expenses related to our owned or leased hotels, including lease payments, pre-opening expenses and depreciation, plus expenses related to our corporate housing business. 5 – General, administrative and other expenses include the overhead costs allocated to our segments and our corporate overhead costs and general expenses. 6 – Gains and other income includes gains and losses on the sale of real estate, gains on note sales or repayments (except timeshare note securitizations gains), gains and losses on the sale of joint ventures, and income from cost method joint ventures. 7 Equity in earnings (losses) includes our equity in earnings (losses) of unconsolidated equity method joint ventures. – 8 – Discontinued operations relates to our Synthetic Fuel business which was shut down and substantially all the assets liquidated at December 28, 2007. 9 – Cumulative effect of change in accounting principle, net of tax is associated with the adoption, in the 2006 first quarter, of Statement of Position 04-2, quot;Accounting for Real Estate Time-sharing Transactionsquot; which was issued by the American Institute of Certified Public Accountants. 2
- 3. Marriott International, Inc. Business Segments ($ in millions) Sixteen Weeks Ended Percent Better/ December 28, 2007 December 29, 2006 (Worse) REVENUES North American Full-Service $ 1,709 $ 1,586 8 North American Limited-Service 657 618 6 International 538 478 13 Luxury 528 450 17 Timeshare 627 644 (3) Total segment revenues 1 4,059 3,776 7 Other unallocated corporate 30 22 36 Total $ 4,089 $ 3,798 8 INCOME FROM CONTINUING OPERATIONS North American Full-Service $ 154 $ 141 9 North American Limited-Service 124 109 14 International 105 77 36 Luxury 28 19 47 Timeshare 116 100 16 Total segment financial results 1 527 446 18 Other unallocated corporate (95) (87) (9) Interest income, provision for loan losses and interest expense (62) (24) (158) Income taxes (134) (116) (16) Total $ 236 $ 219 8 1 We consider segment revenues and segment financial results to be meaningful indicators of our performance because they measure our growth in profitability as a lodging company and enable investors to compare the revenues and results of our lodging operations to those of other lodging companies. 3
- 4. Marriott International, Inc. Business Segments ($ in millions) Fifty-Two Weeks Ended Percent Better/ December 28, 2007 December 29, 2006 (Worse) REVENUES North American Full-Service $ 5,476 $ 5,196 5 North American Limited-Service 2,198 2,060 7 International 1,594 1,411 13 Luxury 1,576 1,423 11 Timeshare 2,065 1,840 12 Total segment revenues 1 12,909 11,930 8 Other unallocated corporate 81 65 25 Total $ 12,990 $ 11,995 8 INCOME FROM CONTINUING OPERATIONS North American Full-Service $ 478 $ 455 5 North American Limited-Service 461 380 21 International 271 237 14 Luxury 72 63 14 Timeshare 306 280 9 Total segment financial results 1 1,588 1,415 12 Other unallocated corporate (287) (251) (14) Interest income, provision for loan losses and interest expense (163) (72) (126) Income taxes (441) (380) (16) Total $ 697 $ 712 (2) 1 We consider segment revenues and segment financial results to be meaningful indicators of our performance because they measure our growth in profitability as a lodging company and enable investors to compare the revenues and results of our lodging operations to those of other lodging companies. 4
- 5. MARRIOTT INTERNATIONAL, INC. 1 Total Lodging Products Number of Properties Number of Rooms/Suites December 28, December vs. December 29, December 28, December 29, vs. December 29, Brand 2007 29, 2006 2006 2007 2006 2006 Domestic Full-Service Marriott Hotels & Resorts 342 340 2 136,348 136,097 251 Renaissance Hotels & Resorts 71 65 6 26,117 25,106 1,011 Domestic Limited-Service Courtyard 693 650 43 96,759 91,226 5,533 Fairfield Inn 529 513 16 46,930 46,030 900 SpringHill Suites 176 152 24 20,445 17,684 2,761 Residence Inn 528 494 34 62,805 58,973 3,832 TownePlace Suites 141 123 18 14,122 12,368 1,754 International Marriott Hotels & Resorts 178 179 (1) 52,196 51,307 889 Renaissance Hotels & Resorts 70 71 (1) 22,817 23,120 (303) Courtyard 74 83 (9) 14,021 14,300 (279) Fairfield Inn 8 5 3 947 559 388 SpringHill Suites 1 1 - 124 124 - Residence Inn 18 17 1 2,611 2,313 298 Marriott Executive Apartments 18 18 - 2,905 3,027 (122) Ramada 2 2 - 332 332 - Luxury The Ritz-Carlton - Domestic 36 35 1 11,627 11,616 11 The Ritz-Carlton - International 32 25 7 9,591 7,790 1,801 Bulgari Hotels & Resorts 2 2 - 117 117 - The Ritz-Carlton Residential 17 - 17 1,707 - 1,707 The Ritz-Carlton Services Apartments 2 - 2 387 - 387 2 Timeshare Marriott Vacation Club 46 45 1 10,896 10,512 384 The Ritz-Carlton Club - Fractional 7 5 2 388 398 (10) The Ritz-Carlton Club - Residential 3 2 1 144 148 (4) Grand Residences by Marriott - Fractional 2 2 - 248 248 - Grand Residences by Marriott - Residential 1 1 - 65 65 - Horizons by Marriott Vacation Club 2 2 - 444 372 72 Sub Total Timeshare 61 57 4 12,185 11,743 442 Total 2,999 2,832 167 535,093 513,832 21,261 Number of Timeshare Interval, Fractional and Residential Resorts 2 In Active 3 Total Sales 100% Company-Developed Marriott Vacation Club 45 24 The Ritz-Carlton Club and Residences 6 4 Grand Residences by Marriott 3 3 and Residences Horizons by Marriott Vacation Club 2 2 Joint Ventures Marriott Vacation Club 1 1 The Ritz-Carlton Club and Residences 4 4 Total 61 38 1 Total Lodging Products excludes the 2,156 and 2,046 corporate housing rental units as of December 28, 2007 and December 29, 2006, respectively. 2 Includes products in active sales which may not be ready for occupancy. 3 Includes resorts that are in active sales and those that are sold out. Residential properties are captured once they possess a certificate of occupancy. 5
- 6. Marriott International, Inc. Key Lodging Statistics Comparable Company-Operated International Properties 1 Four Months Ended December 31, 2007 and December 31, 2006 REVPAR Occupancy Average Daily Rate 2007 vs. 2006 2007 vs. 2006 2007 vs. 2006 Region $124.79 14.2% 74.8% 3.7% pts. $166.81 8.6% Caribbean & Latin America $145.74 10.1% 76.9% 1.0% pts. $189.57 8.7% Continental Europe $167.23 5.2% 78.1% -1.4% pts. $214.00 7.1% United Kingdom $104.19 15.1% 72.2% 5.7% pts. $144.39 6.0% Middle East & Africa Asia Pacific2 $121.60 6.1% 76.2% -0.2% pts. $159.51 6.5% Regional Composite3 $136.77 8.4% 76.5% 0.9% pts. $178.87 7.1% 4 International Luxury $211.48 9.3% 72.0% 2.5% pts. $293.69 5.5% Total International5 $144.54 8.5% 76.0% 1.0% pts. $190.18 7.0% Worldwide6 $123.72 7.0% 71.7% 0.6% pts. $172.43 6.1% Comparable Systemwide International Properties 1 Four Months Ended December 31, 2007 and December 31, 2006 REVPAR Occupancy Average Daily Rate 2007 vs. 2006 2007 vs. 2006 2007 vs. 2006 Region $112.41 12.4% 73.5% 3.4% pts. $152.88 7.2% Caribbean & Latin America $141.52 9.3% 75.4% 2.2% pts. $187.76 6.1% Continental Europe $164.37 4.9% 77.9% -1.2% pts. $210.97 6.5% United Kingdom $102.10 15.5% 71.6% 5.7% pts. $142.63 6.3% Middle East & Africa Asia Pacific2 $122.65 5.2% 76.4% -0.5% pts. $160.54 5.9% 3 Regional Composite $132.92 7.7% 75.8% 1.2% pts. $175.47 6.0% 4 International Luxury $211.48 9.3% 72.0% 2.5% pts. $293.69 5.5% Total International5 $139.63 7.9% 75.4% 1.3% pts. $185.11 6.0% Worldwide6 $103.51 6.6% 70.8% 0.2% pts. $146.29 6.3% 1 International financial results are reported on a period basis, while International statistics are reported on a monthly basis. Statistics are in constant dollars for September through December. Excludes North America (except for Worldwide). 2 Does not include Hawaii. 3 Regional information includes Marriott Hotels & Resorts, Renaissance Hotels & Resorts and Courtyard properties. Includes Hawaii. 4 International Luxury includes The Ritz-Carlton properties outside of North America and Bulgari Hotels & Resorts. 5 Includes Regional Composite and International Luxury. 6 Includes international statistics for the four calendar months ended December 31, 2007 and December 31, 2006, and North American statistics for the sixteen weeks ended December 28, 2007 and December 29, 2006. Includes Marriott Hotels & Resorts, The Ritz-Carlton, Bulgari Hotels & Resorts, Renaissance Hotels & Resorts, Residence Inn, Courtyard, TownePlace Suites, Fairfield Inn and SpringHill Suites properties. 6
- 7. Marriott International, Inc. Key Lodging Statistics Comparable Company-Operated International Properties 1 Twelve Months Ended December 31, 2007 and December 31, 2006 REVPAR Occupancy Average Daily Rate 2007 vs. 2006 2007 vs. 2006 2007 vs. 2006 Region $128.25 12.7% 76.5% 2.4% pts. $167.56 9.2% Caribbean & Latin America $129.34 7.7% 74.4% 1.3% pts. $173.92 5.8% Continental Europe $158.08 5.2% 77.8% 0.1% pts. $203.27 5.2% United Kingdom $99.57 16.8% 73.3% 4.8% pts. $135.74 9.1% Middle East & Africa Asia Pacific2 $111.15 7.8% 75.2% -0.8% pts. $147.79 8.9% Regional Composite3 $127.44 8.2% 75.7% 0.8% pts. $168.30 7.0% 4 International Luxury $212.54 12.2% 72.7% 4.0% pts. $292.24 6.1% Total International5 $136.29 8.9% 75.4% 1.2% pts. $180.73 7.2% Worldwide6 $121.34 7.0% 73.5% 0.5% pts. $165.19 6.2% Comparable Systemwide International Properties 1 Twelve Months Ended December 31, 2007 and December 31, 2006 REVPAR Occupancy Average Daily Rate 2007 vs. 2006 2007 vs. 2006 2007 vs. 2006 Region $117.20 11.7% 74.8% 2.8% pts. $156.76 7.5% Caribbean & Latin America $126.01 7.3% 72.0% 1.2% pts. $174.93 5.4% Continental Europe $155.27 5.1% 77.4% 0.3% pts. $200.65 4.7% United Kingdom $96.95 17.0% 72.4% 4.9% pts. $133.98 9.0% Middle East & Africa Asia Pacific2 $111.92 7.0% 75.3% -0.5% pts. $148.67 7.7% Regional Composite3 $123.78 7.8% 74.6% 1.0% pts. $166.03 6.3% International Luxury4 $212.54 12.2% 72.7% 4.0% pts. $292.24 6.1% Total International5 $131.36 8.4% 74.4% 1.3% pts. $176.57 6.6% Worldwide6 $103.19 6.5% 72.9% 0.1% pts. $141.60 6.4% 1 International financial results are reported on a period basis, while International statistics are reported on a monthly basis. Statistics are in constant dollars for January through December. Excludes North America (except for Worldwide). 2 Does not include Hawaii. 3 Regional information includes Marriott Hotels & Resorts, Renaissance Hotels & Resorts and Courtyard properties. Includes Hawaii. 4 International Luxury includes The Ritz-Carlton properties outside of North America and Bulgari Hotels & Resorts. 5 Includes Regional Composite and International Luxury. 6 Includes international statistics for the twelve calendar months ended December 31, 2007 and December 31, 2006, and North American statistics for the fifty-two weeks ended December 28, 2007 and December 29, 2006. Includes Marriott Hotels & Resorts, The Ritz-Carlton, Bulgari Hotels & Resorts, Renaissance Hotels & Resorts, Residence Inn, Courtyard, TownePlace Suites, Fairfield Inn and SpringHill Suites properties. 7
- 8. Marriott International, Inc. Key Lodging Statistics Comparable Company-Operated North American Properties Sixteen Weeks Ended December 28, 2007 and December 29, 2006 REVPAR Occupancy Average Daily Rate 2007 vs. 2006 2007 vs. 2006 2007 vs. 2006 Brand Marriott Hotels & Resorts $128.23 6.1% 70.0% 0.1% pts. $183.31 5.9% Renaissance Hotels & Resorts $123.40 7.9% 70.0% 1.2% pts. $176.29 6.1% Composite North American Full-Service1 $127.47 6.4% 70.0% 0.3% pts. $182.20 5.9% The Ritz-Carlton2 $232.62 7.0% 68.7% -0.1% pts. $338.59 7.1% Composite North American Full-Service & Luxury3 $138.26 6.5% 69.8% 0.3% pts. $197.99 6.1% Residence Inn $93.60 5.1% 75.0% 0.8% pts. $124.83 4.0% Courtyard $88.19 5.4% 68.0% 0.1% pts. $129.65 5.3% TownePlace Suites $60.95 8.5% 71.5% 1.3% pts. $85.30 6.5% SpringHill Suites $75.40 6.8% 70.0% 2.2% pts. $107.65 3.5% Composite North American Limited-Service4 $87.08 5.6% 70.2% 0.5% pts. $124.11 4.9% Composite - All 5 $115.07 6.2% 70.0% 0.4% pts. $164.43 5.6% Comparable Systemwide North American Properties Sixteen Weeks Ended December 28, 2007 and December 29, 2006 REVPAR Occupancy Average Daily Rate 2007 vs. 2006 2007 vs. 2006 2007 vs. 2006 Brand Marriott Hotels & Resorts $112.62 6.3% 68.0% 0.0% pts. $165.66 6.3% Renaissance Hotels & Resorts $112.37 6.2% 69.3% 0.0% pts. $162.07 6.3% Composite North American Full-Service1 $112.58 6.3% 68.2% 0.0% pts. $165.11 6.3% 2 The Ritz-Carlton $232.62 7.0% 68.7% -0.1% pts. $338.59 7.1% Composite North American Full-Service & Luxury3 $119.87 6.4% 68.2% 0.0% pts. $175.72 6.4% Residence Inn $92.85 5.6% 75.6% 0.0% pts. $122.88 5.6% Courtyard $87.62 6.3% 69.7% 0.4% pts. $125.71 5.7% Fairfield Inn $59.30 6.8% 67.0% -0.1% pts. $88.50 6.9% TownePlace Suites $61.13 4.9% 70.5% -1.3% pts. $86.76 6.8% SpringHill Suites $74.22 5.3% 69.9% -0.9% pts. $106.22 6.7% Composite North American Limited-Service4 $80.81 6.0% 70.7% 0.0% pts. $114.22 6.0% 5 Composite - All $95.89 6.2% 69.8% 0.0% pts. $137.43 6.2% 1 Includes Marriott Hotels & Resorts and Renaissance Hotels & Resorts properties. 2 Statistics for Ritz-Carlton properties are for September through December. 3 Includes Marriott Hotels & Resorts, Renaissance Hotels & Resorts and Ritz-Carlton properties. 4 Includes Residence Inn, Courtyard, Fairfield Inn, TownePlace Suites and SpringHill Suites properties. 5 Includes Marriott Hotels & Resorts, Renaissance Hotels & Resorts, The Ritz-Carlton, Residence Inn, Courtyard, Fairfield Inn, TownePlace Suites, and SpringHill Suites properties. 8
- 9. Marriott International, Inc. Key Lodging Statistics Comparable Company-Operated North American Properties Fifty-two Weeks Ended December 28, 2007 and December 29, 2006 REVPAR Occupancy Average Daily Rate 2007 vs. 2006 2007 vs. 2006 2007 vs. 2006 Brand Marriott Hotels & Resorts $127.43 6.9% 72.6% 1.0% pts. $175.41 5.4% Renaissance Hotels & Resorts $124.17 5.9% 73.1% 0.4% pts. $169.93 5.4% Composite North American Full-Service1 $126.92 6.8% 72.7% 0.9% pts. $174.54 5.4% The Ritz-Carlton2 $239.67 7.5% 72.3% 0.1% pts. $331.48 7.3% Composite North American Full-Service & Luxury3 $137.66 6.9% 72.7% 0.8% pts. $189.41 5.7% Residence Inn $96.53 3.9% 77.7% -0.5% pts. $124.24 4.6% Courtyard $89.69 4.9% 70.4% -0.4% pts. $127.34 5.6% TownePlace Suites $63.56 7.2% 74.2% -1.1% pts. $85.65 8.9% SpringHill Suites $78.27 5.0% 72.6% 0.6% pts. $107.86 4.2% Composite North American Limited-Service4 $89.18 4.8% 72.7% -0.4% pts. $122.63 5.4% Composite - All 5 $115.60 6.2% 72.7% 0.3% pts. $159.01 5.8% Comparable Systemwide North American Properties Fifty-two Weeks Ended December 28, 2007 and December 29, 2006 REVPAR Occupancy Average Daily Rate 2007 vs. 2006 2007 vs. 2006 2007 vs. 2006 Brand Marriott Hotels & Resorts $113.66 6.4% 70.8% 0.6% pts. $160.61 5.5% Renaissance Hotels & Resorts $112.96 5.1% 71.8% -0.4% pts. $157.29 5.8% 1 Composite North American Full-Service $113.56 6.2% 70.9% 0.5% pts. $160.10 5.5% 2 The Ritz-Carlton $239.67 7.5% 72.3% 0.1% pts. $331.48 7.3% 3 Composite North American Full-Service & Luxury $120.65 6.4% 71.0% 0.4% pts. $169.92 5.7% Residence Inn $95.80 5.1% 78.2% -0.8% pts. $122.44 6.1% Courtyard $89.53 5.6% 72.1% -0.2% pts. $124.12 5.9% Fairfield Inn $62.17 6.7% 70.5% -0.3% pts. $88.19 7.2% TownePlace Suites $63.89 5.0% 73.5% -2.4% pts. $86.93 8.4% SpringHill Suites $77.97 5.7% 73.2% -0.6% pts. $106.49 6.5% Composite North American Limited-Service4 $83.37 5.6% 73.6% -0.5% pts. $113.34 6.3% 5 Composite - All $97.70 6.0% 72.6% -0.2% pts. $134.62 6.2% 1 Includes Marriott Hotels & Resorts and Renaissance Hotels & Resorts properties. 2 Statistics for Ritz-Carlton properties are for January through December. 3 Includes Marriott Hotels & Resorts, Renaissance Hotels & Resorts and Ritz-Carlton properties. 4 Includes Residence Inn, Courtyard, Fairfield Inn, TownePlace Suites and SpringHill Suites properties. 5 Includes Marriott Hotels & Resorts, Renaissance Hotels & Resorts, The Ritz-Carlton, Residence Inn, Courtyard, Fairfield Inn, TownePlace Suites, and SpringHill Suites properties. 9
- 10. MARRIOTT INTERNATIONAL, INC. TIMESHARE SEGMENT ($ in millions) Segment Results Sixteen Weeks Ended Percent December 28, 2007 December 29, 2006 Better / (Worse) Base fees revenue $ 13 $ 10 30 Timeshare sales and services revenue, net of direct expense 126 133 (5) Joint venture equity income (loss) 6 (3) 300 General, administrative and other expense (29) (40) 28 Segment results $ 116 $ 100 16 Sales and Services Revenue Sixteen Weeks Ended Percent December 28, 2007 December 29, 2006 Better / (Worse) Development $ 362 $ 378 (4) Services 90 79 14 Financing 75 67 12 Other revenue 9 2 350 Sales and services revenue $ 536 $ 526 2 Contract Sales1 Sixteen Weeks Ended Percent December 28, 2007 December 29, 2006 Better / (Worse) Company: Timeshare $ 344 $ 314 10 Fractional 17 10 70 Residential (15) - * Total company 346 324 7 Joint ventures: Timeshare 10 10 - Fractional 8 46 (83) Residential 2 116 (98) Total joint ventures 20 172 (88) Total contract sales, including joint ventures $ 366 $ 496 (26) * Percent can not be calculated. 1 – Timeshare contract sales represent gross sales of timeshare, fractional, and residential products from both our wholly-owned and joint venture projects, before the adjustment for percentage-of-completion accounting. 10
- 11. MARRIOTT INTERNATIONAL, INC. TIMESHARE SEGMENT ($ in millions) Segment Results Fifty-Two Weeks Ended Percent December 28, 2007 December 29, 2006 Better / (Worse) Base fees revenue $ 43 $ 34 26 Timeshare sales and services revenue, net of direct expense 350 357 (2) Joint venture equity income (loss) 10 (2) 600 Minority interest 1 - * General, administrative and other expense (98) (109) 10 Segment results $ 306 $ 280 9 Sales and Services Revenue Fifty-Two Weeks Ended Percent December 28, 2007 December 29, 2006 Better / (Worse) Development $ 1,208 $ 1,112 9 Services 315 286 10 Financing 195 171 14 Other revenue 29 8 263 Sales and services revenue $ 1,747 $ 1,577 11 Contract Sales1 Fifty-Two Weeks Ended Percent December 28, 2007 December 29, 2006 Better / (Worse) Company: Timeshare $ 1,221 $ 1,207 1 Fractional 44 42 5 Residential (9) 5 (280) Total company 1,256 1,254 - Joint ventures: Timeshare 33 28 18 Fractional 54 68 (21) Residential 58 282 (79) Total joint ventures 145 378 (62) Total contract sales, including joint ventures $ 1,401 $ 1,632 (14) * Percent can not be calculated. 1 – Timeshare contract sales represent gross sales of timeshare, fractional, and residential products from both our wholly-owned and joint venture projects, before the adjustment for percentage-of-completion accounting. 11
- 12. MARRIOTT INTERNATIONAL, INC. Non-GAAP Financial Measures In our press release and schedules, and related conference call, we report certain financial measures that are not prescribed or authorized by United States generally accepted accounting principles (“GAAP”). We discuss management’s reasons for reporting these non-GAAP measures below, and the tables on the following pages reconcile the most directly comparable GAAP measures to the non-GAAP measures (identified by a double asterisk on the following pages) that we refer to in our press release and related conference call. Although management evaluates and presents these non-GAAP measures for the reasons described below, please be aware that these non-GAAP measures are not alternatives to revenue, operating income, income from continuing operations, net income, earnings per share or any other comparable operating measure prescribed by GAAP. In addition, these non-GAAP financial measures may be calculated and/or presented differently than measures with the same or similar names that are reported by other companies, and as a result, the non-GAAP measures we report may not be comparable to those reported by others. ESOP Settlement Charge. Management evaluates non-GAAP measures that exclude the charge associated with the 2007 settlement of issues raised during the IRS’ and Department of Labor’s examination of the employee stock ownership plan (“ESOP”) feature of our Employees’ Profit Sharing, Retirement and Savings Plan and Trust, including adjusted earnings per share and adjusted earnings before interest, taxes, depreciation and amortization, because these measures allow for period-over-period comparisons relative to our on-going operations before material charges. Additionally, these non-GAAP measures facilitate management’s comparison of our results relative to on-going operations before material charges with that of other lodging companies. The settlement resulted in an after-tax charge of $54 million in the second quarter 2007 reflecting $35 million of excise taxes (impacting General, Administrative, and Other Expenses), $13 million of interest expense on those excise taxes and $6 million of income tax expense primarily reflecting additional interest. Earnings Before Interest and Taxes. Earnings before interest and taxes (EBIT) reflects earnings excluding the impact of interest expense and tax expense. EBIT is used by analysts, lenders, investors and others, as well as by us, to evaluate companies because it excludes certain items that can vary widely across different industries or among companies within the same industry. For example, interest expense can be dependent on a company’s capital structure, debt levels and credit ratings. Accordingly, the impact of interest expense on earnings can vary significantly among companies. Additionally, the tax positions of companies can vary because of their differing abilities to take advantage of tax benefits and because of the tax policies of the jurisdictions in which they operate. As a result, effective tax rates and tax expense can vary considerably among companies. Earnings Before Interest, Taxes, Depreciation and Amortization. Earnings before interest, taxes, depreciation and amortization (EBITDA) reflects EBIT excluding the impact of depreciation and amortization. Our management considers EBITDA to be an indicator of operating performance because it can be used to measure our ability to service debt, fund capital expenditures, and expand our business. EBITDA is used by analysts, lenders, investors and others, as well as by us, to evaluate companies because it excludes certain items that can vary widely across different industries or among companies within the same industry. In addition to the items previously noted that are excluded in calculating EBIT, EBITDA further excludes depreciation and amortization because companies utilize productive assets of different ages and use different methods of both acquiring and depreciating productive assets. These differences can result in considerable variability in the relative costs of productive assets and the depreciation and amortization expense among companies. Adjusted EBITDA. Our management also evaluates adjusted EBITDA which excludes the synthetic fuel business for 2007 and 2006, as well as the $35 million charge in 2007 for excise taxes associated with the ESOP settlement. The synthetic fuel operations, discontinued in 2007, are not related to our core business, which is lodging. Accordingly, our management evaluates non-GAAP measures which exclude the impact of the synthetic fuel business because those measures allow for period-over-period comparisons of our on-going core lodging operations. In addition, these non-GAAP measures facilitate management’s comparison of our results with the results of other lodging companies. Our management excludes the excise taxes associated with the ESOP settlement for the reasons noted above in the “ESOP Settlement Charge” caption. Return on Invested Capital. Return on Invested Capital (“ROIC”) is calculated as EBIT divided by average capital investment. We consider ROIC to be a meaningful indicator of our operating performance, and we evaluate this metric because it measures how effectively we use the money invested in our lodging operations. The calculation of EBIT adds back to income from continuing operations: 1) the provision for income taxes; 2) interest expense; and 3) timeshare interest representing previously capitalized interest that is a component of product cost. The calculation of invested capital adds back to total assets cumulative goodwill amortization to be consistent with the calculation for earlier years. Beginning with 2002, we stopped amortizing goodwill in conjunction with the adoption of FAS No. 142, “Goodwill and Other Intangible Assets.” The calculation of invested capital deducts from total assets: 1) current liabilities as they will be satisfied in the short term; 2) assets associated with discontinued operations net of liabilities because the ROIC metric we analyze is related to our core lodging business (continuing operations); 3) deferred tax assets net of liabilities because the numerator of the calculation is a pre-tax number; and 4) timeshare capitalized interest because the numerator of the calculation is a pre-interest expense number. 12
- 13. MARRIOTT INTERNATIONAL, INC. Non-GAAP Financial Measure Reconciliation Measures that Exclude the Second Quarter 2007 ESOP Settlement (in millions, except per share amounts) Fiscal Year 2007 Excluding ESOP ** 1 As Reported ESOP Impact Operating income (loss) $ 1,188 $ (35) $ 1,223 Gains and other income (expense) 97 - 97 Interest income, provision for loan losses and interest expense (163) (13) (150) Equity in earnings (losses) 15 - 15 Income (losses) from continuing operations before income taxes and minority interest 1,137 (48) 1,185 Provision for income taxes (441) (6) (435) Minority interest 1 - 1 Income (loss) from continuing operations $ 697 $ (54) $ 751 Diluted shares 397.3 397.3 397.3 Earnings per share - diluted $ 1.75 $ (0.14) $ 1.89 ** Denotes non-GAAP financial measures. 1 – We refer to earnings per share excluding the ESOP impact as adjusted earnings per share, and we refer to income from continuing operations excluding the ESOP impact as adjusted income from continuing operations. 13
- 14. Marriott International, Inc. Non-GAAP Financial Measure Reconciliation Return on Invested Capital ($ in millions) The reconciliation of income from continuing operations to earnings before income taxes and interest expense is as follows: Fiscal Year 2007 Income from continuing operations $ 697 Add: Provision for income taxes 441 Interest expense 184 1 Timeshare interest 24 Earnings before income taxes and interest expense ** $ 1,346 The reconciliation of assets to invested capital is as follows: Fiscal Year 2007 Fiscal Year 2006 Assets $ 8,942 $ 8,588 Add: Cumulative goodwill amortization 128 128 Current liabilities - discontinued operations 13 55 Less: Current liabilities, net of current portion of long-term debt (2,701) (2,507) Assets - discontinued operations (53) (91) Deferred tax assets, net (863) (865) Timeshare capitalized interest (19) (19) Invested capital ** $ 5,447 $ 5,289 2 Average capital investment ** $ 5,368 Return on invested capital ** 25% ** Denotes a non-GAAP financial measure. 1 Timeshare interest represents previously capitalized interest that is a component of product cost. 2 Calculated as quot;Invested capitalquot; for the current year and prior year, divided by two. 14
- 15. MARRIOTT INTERNATIONAL, INC. Non-GAAP Financial Measure EBITDA and Adjusted EBITDA ($ in millions) Fiscal Year 2007 First Second Third Fourth Quarter Quarter Quarter Quarter Total Net income $ 182 $ 207 $ 131 $ 176 $ 696 Interest expense 33 52 42 57 184 Tax provision 14 42 52 207 315 Depreciation and amortization 46 45 43 63 197 Less: Depreciation reimbursed by third-party owners (4) (4) (4) (6) (18) Interest expense from unconsolidated joint ventures 5 5 8 6 24 Depreciation and amortization from unconsolidated joint ventures 6 7 6 9 28 EBITDA** $ 282 $ 354 $ 278 $ 512 $ 1,426 ESOP Settlement - Excise Tax - 35 - - 35 Discontinued operations adjustment (synthetic fuel) 52 52 30 (15) 119 Adjusted EBITDA** $ 334 $ 441 $ 308 $ 497 $ 1,580 Increase over 2006 Adjusted EBITDA 3% 21% 3% 14% 11% The following items make up the discontinued operations (synthetic fuel) Pre-tax Synthetic Fuel operating losses (income) $ 54 $ 54 $ 32 $ (13) $ 127 Synthetic Fuel depreciation (2) (2) (2) (2) (8) EBITDA adjustment for discontinued operations $ 52 $ 52 $ 30 $ (15) $ 119 (synthetic fuel) Fiscal Year 2006 First Second Third Fourth Quarter Quarter Quarter Quarter Total Net income $ 61 $ 186 $ 141 $ 220 $ 608 Cumulative effect of change in accounting principle 173 - - - 173 Interest expense 27 30 29 38 124 Tax provision 56 85 82 63 286 Tax benefit from cumulative effect of change in accounting principle (64) - - - (64) Depreciation and amortization 40 42 44 62 188 Less: Depreciation reimbursed by third-party owners (4) (4) (4) (6) (18) Interest expense from unconsolidated joint ventures 5 6 5 7 23 Depreciation and amortization from unconsolidated joint ventures 6 7 7 9 29 EBITDA** $ 300 $ 352 $ 304 $ 393 $ 1,349 Discontinued operations adjustment (synthetic fuel) 24 11 (4) 44 75 Adjusted EBITDA** $ 324 $ 363 $ 300 $ 437 $ 1,424 The following items make up the discontinued operations (synthetic fuel) Pre-tax Synthetic Fuel operating losses (income) $ 31 $ 13 $ (2) $ 53 $ 95 Pre-tax minority interest - Synthetic Fuel (5) - - (1) (6) Synthetic Fuel depreciation (2) (2) (2) (8) (14) EBITDA adjustment for discontinued operations (synthetic fuel) $ 24 $ 11 $ (4) $ 44 $ 75 ** Denotes non-GAAP financial measures. 15