Call Girls Near Golden Tulip Essential Hotel, New Delhi 9873777170
first energy 1Q/08N
1. Consolidated Report to the Financial Community
First Quarter 2008
(Released May 1, 2008) (Unaudited)
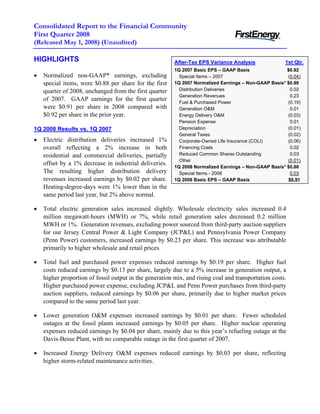
HIGHLIGHTS After-Tax EPS Variance Analysis 1st Qtr.
1Q 2007 Basic EPS – GAAP Basis $0.92
• Normalized non-GAAP* earnings, excluding Special Items – 2007 (0.04)
special items, were $0.88 per share for the first 1Q 2007 Normalized Earnings – Non-GAAP Basis* $0.88
Distribution Deliveries 0.02
quarter of 2008, unchanged from the first quarter
Generation Revenues 0.23
of 2007. GAAP earnings for the first quarter Fuel & Purchased Power (0.19)
were $0.91 per share in 2008 compared with Generation O&M 0.01
$0.92 per share in the prior year. Energy Delivery O&M (0.03)
Pension Expense 0.01
Depreciation (0.01)
1Q 2008 Results vs. 1Q 2007
General Taxes (0.02)
• Electric distribution deliveries increased 1% Corporate-Owned Life Insurance (COLI) (0.06)
overall reflecting a 2% increase in both Financing Costs 0.02
Reduced Common Shares Outstanding 0.03
residential and commercial deliveries, partially
Other (0.01)
offset by a 1% decrease in industrial deliveries.
1Q 2008 Normalized Earnings – Non-GAAP Basis* $0.88
The resulting higher distribution delivery Special Items - 2008 0.03
revenues increased earnings by $0.02 per share. 1Q 2008 Basic EPS – GAAP Basis $0.91
Heating-degree-days were 1% lower than in the
same period last year, but 2% above normal.
• Total electric generation sales increased slightly. Wholesale electricity sales increased 0.4
million megawatt-hours (MWH) or 7%, while retail generation sales decreased 0.2 million
MWH or 1%. Generation revenues, excluding power sourced from third-party auction suppliers
for our Jersey Central Power & Light Company (JCP&L) and Pennsylvania Power Company
(Penn Power) customers, increased earnings by $0.23 per share. This increase was attributable
primarily to higher wholesale and retail prices.
• Total fuel and purchased power expenses reduced earnings by $0.19 per share. Higher fuel
costs reduced earnings by $0.13 per share, largely due to a 5% increase in generation output, a
higher proportion of fossil output in the generation mix, and rising coal and transportation costs.
Higher purchased power expense, excluding JCP&L and Penn Power purchases from third-party
auction suppliers, reduced earnings by $0.06 per share, primarily due to higher market prices
compared to the same period last year.
• Lower generation O&M expenses increased earnings by $0.01 per share. Fewer scheduled
outages at the fossil plants increased earnings by $0.05 per share. Higher nuclear operating
expenses reduced earnings by $0.04 per share, mainly due to this year’s refueling outage at the
Davis-Besse Plant, with no comparable outage in the first quarter of 2007.
• Increased Energy Delivery O&M expenses reduced earnings by $0.03 per share, reflecting
higher storm-related maintenance activities.
2. • Reduced pension expense increased earnings by $0.01 per share, primarily due to an increase in
the discount rate used to determine benefit obligations as of December 31, 2007.
• Incremental property additions increased depreciation expense by $0.01 per share.
• Higher general taxes reduced earnings by $0.02 per share, primarily due to higher payroll and
property taxes, as well as higher Pennsylvania gross receipts taxes.
• Decreased investment income due to market-related declines in the value of corporate-owned
life insurance reduced earnings by $0.06 per share.
• Lower financing costs increased earnings by $0.02 per share. The decrease in financing costs
reflects lower interest rates and reduced short-term borrowings.
• The reduction in shares outstanding, due to the accelerated repurchase of 14.4 million common
shares in March 2007, enhanced earnings by $0.03 per share.
• Two special items were recognized during the first quarter of 2008. The first was a $0.06 per
share increase in earnings recognized from the gain on the sale of non-core assets. The second
relates to a $0.03 per share reduction in earnings from impairment of securities held in trust for
future nuclear decommissioning activities.
2008 Earnings Guidance
• Normalized non-GAAP* earnings guidance for 2008, excluding special items, remains at $4.15
to $4.35 per share.
* The 2008 GAAP to non-GAAP reconciliation statements can be found on page 10 of this report and all GAAP to non-GAAP
reconciliation statements are available on the Investor Information section of FirstEnergy Corp.'s Web site at
www.firstenergycorp.com/ir.
For additional information, please contact:
Ronald E. Seeholzer Kurt E. Turosky Rey Y. Jimenez
Vice President, Investor Relations Director, Investor Relations Principal, Investor Relations
(330) 384-5415 (330) 384-5500 (330) 761-4239
Consolidated Report to the Financial Community – 1st Quarter 2008 2
3. FirstEnergy Corp.
Consolidated Statements of Income
(Unaudited)
(In millions, except for per share amounts)
Three Months Ended March 31,
2008 2007 Change
Revenues
(1) Electric sales $ 3,030 $ 2,764 $ 266
(2) Other 247 209 38
(3) 3,277 2,973 304
Total Revenues
Expenses
(4) Fuel 328 262 66
(5) Purchased power 1,000 859 141
(6) Other operating expenses 800 749 51
(7) Provision for depreciation 164 156 8
(8) Amortization of regulatory assets 258 251 7
(9) Deferral of new regulatory assets (105) (144) 39
(10) General taxes 215 203 12
(11) 2,660 2,336 324
Total Expenses
(12) 617 637 (20)
Operating Income
Other Income (Expense)
(13) Investment income 17 33 (16)
(14) Interest expense (179) (185) 6
(15) Capitalized interest 8 5 3
(16) (154) (147) (7)
Total Other Expense
(17) 463 490 (27)
Income Before Income Taxes
(18) Income taxes 187 200 (13)
(19) $ 276 $ 290 $ (14)
Net Income
(20) Earnings Per Share of Common Stock
(21) Basic $ 0.91 $ 0.92 $ (0.01)
(22) Diluted $ 0.90 $ 0.92 $ (0.02)
(23) Weighted Average Number of
Common Shares Outstanding
(24) Basic 304 314 (10)
(25) Diluted 307 316 (9)
______________________________________________________________________________________________________
Consolidated Report to the Financial Community – 1st Quarter 2008 3
4. FirstEnergy Corp.
Consolidated Income Segments
(Unaudited)
(In millions)
Three Months Ended March 31, 2008
Ohio
Energy Competitive Transitional Other &
Delivery Energy Generation Reconciling
Services (a) Services (b) Services (c) Adjustments (d) Consolidated
Revenues
Electric sales $ 2,050 $ 289 $ 691 $ - $ 3,030
(1)
Other 162 40 16 29 247
(2)
Internal revenues - 776 - (776) -
(3)
Total Revenues 2,212 1,105 707 (747) 3,277
(4)
Expenses
Fuel 1 327 - - 328
(5)
Purchased power 982 206 588 (776) 1,000
(6)
Other operating expenses 445 309 77 (31) 800
(7)
Provision for depreciation 106 53 - 5 164
(8)
Amortization of regulatory assets 249 - 9 - 258
(9)
Deferral of new regulatory assets (100) - (5) - (105)
(10)
General taxes 173 32 1 9 215
(11)
Total Expenses 1,856 927 670 (793) 2,660
(12)
Operating Income 356 178 37 46 617
(13)
Other Income (Expense)
Investment income 45 (6) 1 (23) 17
(14)
Interest expense (103) (34) - (42) (179)
(15)
Capitalized interest - 7 - 1 8
(16)
Total Other Expense (58) (33) 1 (64) (154)
(17)
Income Before Income Taxes 298 145 38 (18) 463
(18)
119 58 15 (5) 187
Income taxes
(19)
Net Income $ 179 $ 87 $ 23 $ (13) $ 276
(20)
(a) Consists of regulated transmission and distribution operations, including transition cost recovery, and provider of last resort
generation service for FirstEnergy's Pennsylvania and New Jersey electric utility subsidiaries.
(b) Consists of unregulated generation and commodity operations, including competitive electric sales, and generation sales to
affiliated electric utilities.
(c) Represents provider of last resort generation service by FirstEnergy's Ohio electric utility subsidiaries.
(d) Consists primarily of interest expense related to holding company debt, corporate support services revenues and expenses,
telecommunications services and elimination of intersegment transactions.
______________________________________________________________________________________________________
Consolidated Report to the Financial Community – 1st Quarter 2008 4
5. FirstEnergy Corp.
Consolidated Income Segments
(Unaudited)
(In millions)
Three Months Ended March 31, 2007
Ohio
Energy Competitive Transitional Other &
Delivery Energy Generation Reconciling
Services (a) Services (b) Services (c) Adjustments (d) Consolidated
Revenues
Electric sales $ 1,875 $ 276 $ 613 $ - $ 2,764
(1)
Other 165 45 6 (7) 209
(2)
Internal revenues - 714 - (714) -
(3)
2,040 1,035 619 (721) 2,973
Total Revenues
(4)
Expenses
Fuel 1 261 - - 262
(5)
Purchased power 843 186 544 (714) 859
(6)
Other operating expenses 408 300 49 (8) 749
(7)
Provision for depreciation 98 51 - 7 156
(8)
Amortization of regulatory assets 246 - 5 - 251
(9)
Deferral of new regulatory assets (124) - (20) - (144)
(10)
General taxes 165 28 2 8 203
(11)
Total Expenses 1,637 826 580 (707) 2,336
(12)
Operating Income 403 209 39 (14) 637
(13)
Other Income (Expense)
Investment income 70 3 1 (41) 33
(14)
Interest expense (109) (52) (1) (23) (185)
(15)
Capitalized interest 2 3 - - 5
(16)
Total Other Expense (37) (46) - (64) (147)
(17)
Income Before Income Taxes 366 163 39 (78) 490
(18)
148 65 15 (28) 200
Income taxes
(19)
Net Income $ 218 $ 98 $ 24 $ (50) $ 290
(20)
(a) Consists of regulated transmission and distribution operations, including transition cost recovery, and provider of last resort
generation service for FirstEnergy's Pennsylvania and New Jersey electric utility subsidiaries.
(b) Consists of unregulated generation and commodity operations, including competitive electric sales, and generation sales to
affiliated electric utilities.
(c) Represents provider of last resort generation service by FirstEnergy's Ohio electric utility subsidiaries.
(d) Consists primarily of interest expense related to holding company debt, corporate support services revenues and expenses,
telecommunications services and elimination of intersegment transactions.
______________________________________________________________________________________________________
Consolidated Report to the Financial Community – 1st Quarter 2008 5
6. FirstEnergy Corp.
Consolidated Income Segments
(Unaudited)
(In millions)
Three Months Ended March 31, 2008 vs. Three Months Ended March 31, 2007
Ohio
Energy Competitive Transitional Other &
Delivery Energy Generation Reconciling
Services (a) Services (b) Services (c) Adjustments (d) Consolidated
Revenues
Electric sales $ 175 $ 13 $ 78 $ - $ 266
(1)
Other (3) (5) 10 36 38
(2)
Internal revenues - 62 - (62) -
(3)
172 70 88 (26) 304
Total Revenues
(4)
Expenses
Fuel - 66 - - 66
(5)
Purchased power 139 20 44 (62) 141
(6)
Other operating expenses 37 9 28 (23) 51
(7)
Provision for depreciation 8 2 - (2) 8
(8)
Amortization of regulatory assets 3 - 4 - 7
(9)
Deferral of new regulatory assets 24 - 15 - 39
(10)
General taxes 8 4 (1) 1 12
(11)
219 101 90 (86) 324
Total Expenses
(12)
Operating Income (47) (31) (2) 60 (20)
(13)
Other Income (Expense)
Investment income (25) (9) - 18 (16)
(14)
Interest expense 6 18 1 (19) 6
(15)
Capitalized interest (2) 4 - 1 3
(16)
Total Other Expense (21) 13 1 - (7)
(17)
Income Before Income Taxes (68) (18) (1) 60 (27)
(18)
(29) (7) - 23 (13)
Income taxes
(19)
$ (39) $ (11) $ (1) $ 37 $ (14)
Net Income
(20)
(a) Consists of regulated transmission and distribution operations, including transition cost recovery, and provider of last resort
generation service for FirstEnergy's Pennsylvania and New Jersey electric utility subsidiaries.
(b) Consists of unregulated generation and commodity operations, including competitive electric sales, and generation sales to
affiliated electric utilities.
(c) Represents provider of last resort generation service by FirstEnergy's Ohio electric utility subsidiaries.
(d) Consists primarily of interest expense related to holding company debt, corporate support services revenues and expenses,
telecommunications services and elimination of intersegment transactions.
______________________________________________________________________________________________________
Consolidated Report to the Financial Community – 1st Quarter 2008 6
7. FirstEnergy Corp.
Financial Statements
(Unaudited)
(In millions)
Condensed Consolidated Balance Sheets
March 31, December 31,
2008 2007
Assets
Current Assets:
Cash and cash equivalents $ 70 $ 129
Receivables 1,423 1,421
Other 877 680
Total Current Assets 2,370 2,230
Property, Plant and Equipment 15,905 15,383
Investments 3,418 3,598
Deferred Charges and Other Assets 10,722 10,857
Total Assets $ 32,415 $ 32,068
Liabilities and Capitalization
Current Liabilities:
Currently payable long-term debt $ 2,183 $ 2,014
Short-term borrowings 1,649 903
Accounts payable 754 777
Other 1,583 1,454
Total Current Liabilities 6,169 5,148
Capitalization:
Common stockholders' equity 8,991 8,977
Long-term debt and other long-term obligations 8,332 8,869
Total Capitalization 17,323 17,846
Noncurrent Liabilities 8,923 9,074
Total Liabilities and Capitalization $ 32,415 $ 32,068
General Information
Three Months Ended March 31,
2008 2007
Debt and equity securities redemptions $ (368) $ (904)
New long-term debt issues $ - $ 250
Short-term borrowings $ 746 $ 1,139
Capital expenditures $ 711 $ 296
Adjusted Capitalization (Including Off-Balance Sheet Items) - Rating Agency View
As of March 31,
2008 % Total 2007 % Total
Total common equity $ 8,991 39% $ 8,299 37%
Long-term debt and other long-term obligations 8,332 37% 8,546 39%
Currently payable long-term debt 2,183 10% 2,093 10%
Short-term borrowings 1,649 7% 2,247 10%
Adjustments:
Sale-leaseback net debt equivalents 2,026 9% 1,235 6%
JCP&L securitization debt (391) -2% (420) -2%
Total $ 22,790 100% $ 22,000 100%
______________________________________________________________________________________________________
Consolidated Report to the Financial Community – 1st Quarter 2008 7
8. FirstEnergy Corp.
Financial Statements
(Unaudited)
(In millions)
Condensed Consolidated Statements of Cash Flows
Three Months Ended March 31,
2008 2007
Cash flows from operating activities:
$ 276 $ 290
Net income
Adjustments to reconcile net income to net cash
from operating activities:
Depreciation, amortization, and deferral
317 263
of regulatory assets
(59) (116)
Deferred purchased power and other costs
89 53
Deferred income taxes and investment tax credits
4 (25)
Deferred rents and lease market valuation liability
- (300)
Pension trust contribution
8 6
Cash collateral, net
(19) (17)
Electric service prepayment programs
(260) (211)
Change in working capital and other
Cash flows provided from (used for) operating activities: 356 (57)
227 346
Cash flows provided from financing activities:
(642) (290)
Cash flows used for investing activities
$ (59) $ (1)
Net decrease in cash and cash equivalents
Deferrals and Amortizations
Three Months Ended March 31,
2008 2007 Change
Ohio Rate Plans and Transmission Deferrals
$ 1,847 $ 1,863
Regulatory Assets - Beginning
Interest on shopping incentives 8 10 $ (2)
MISO costs and interest 2 8 (6)
RCP distribution reliability costs and interest 40 46 (6)
RCP fuel costs and interest 7 14 (7)
Other 7 6 1
$ 64 $ 84 $ (20)
Current period deferrals
Amortization
Ohio transition costs $ (72) $ (68) $ (4)
Shopping incentives (30) (30) -
MISO costs (5) (5) -
Other (5) (2) (3)
$ (112) $ (105) $ (7)
Current period amortization
$ 1,799 $ 1,842
Regulatory Assets - Ending
Pennsylvania Deferred PJM Costs
$ 254 $ 157
Beginning balance
Deferrals 40 35 $ 5
Interest 2 1 1
Amortizations (3) (1) (2)
$ 293 $ 192
Ending balance
New Jersey Deferred Energy Costs
$ 236 $ 369
Beginning balance
$ (5)
Net recovery of energy costs (17) (12)
$ 219 $ 357
Ending balance
______________________________________________________________________________________________________
Consolidated Report to the Financial Community – 1st Quarter 2008 8
9. FirstEnergy Corp.
Statistical Summary
(Unaudited)
ELECTRIC SALES STATISTICS Three Months Ended March 31,
(in millions of kWhs) 2008 2007 Change
Electric Distribution Deliveries
Ohio - Residential 4,947 4,831 2.4%
- Commercial 3,849 3,795 1.4%
- Industrial 5,630 5,679 -0.9%
- Other 91 94 -3.2%
Total Ohio 14,517 14,399 0.8%
Pennsylvania - Residential 3,437 3,303 4.1%
- Commercial 2,860 2,771 3.2%
- Industrial 2,509 2,542 -1.3%
- Other 21 20 5.0%
Total Pennsylvania 8,827 8,636 2.2%
New Jersey - Residential 2,355 2,353 0.1%
- Commercial 2,325 2,297 1.2%
- Industrial 693 702 -1.3%
- Other 22 21 4.8%
Total New Jersey 5,395 5,373 0.4%
Total Residential 10,739 10,487 2.4%
Total Commercial 9,034 8,863 1.9%
Total Industrial 8,832 8,923 -1.0%
Total Other 134 135 -0.7%
Total Distribution Deliveries 28,739 28,408 1.2%
Electric Sales Shopped
Ohio - Residential 554 560 -1.1%
- Commercial 851 880 -3.3%
- Industrial 631 642 -1.7%
Total Ohio 2,036 2,082 -2.2%
Pennsylvania - Residential 35 - -
- Commercial 198 108 83.3%
- Industrial 488 415 17.6%
Total Pennsylvania 721 523 37.9%
New Jersey - Residential - - -
- Commercial 565 475 18.9%
- Industrial 533 519 2.7%
Total New Jersey 1,098 994 10.5%
Total Electric Sales Shopped 3,855 3,599 7.1%
Electric Generation Sales
Retail - Regulated 24,884 24,809 0.3%
Retail - Competitive 2,916 3,206 -9.0%
Total Retail 27,800 28,015 -0.8%
Wholesale 5,417 5,063 7.0%
Total Electric Generation Sales 33,217 33,078 0.4%
Three Months Ended
Operating Statistics March 31,
2008 2007
Capacity Factors:
Fossil - Baseload 84% 64%
Fossil - Load Following 69% 74%
Nuclear 88% 99%
Generation Output:
Fossil - Baseload 40% 32%
Fossil - Load Following 22% 24%
Peaking 1% 1%
Nuclear 37% 43%
Three Months Ended March 31,
Weather 2008 2007 Normal
Composite Heating-Degree-Days 2,865 2,902 2,805
Composite Cooling-Degree-Days - 1 1
______________________________________________________________________________________________________
Consolidated Report to the Financial Community – 1st Quarter 2008 9
10. FirstEnergy Corp.
Special Items and EPS Reconciliations
(Unaudited)
(In millions, except for per share amounts)
Special Items
Three Months Ended March 31,
2008 2007
Pre-tax Items - Income Increase (Decrease)
$ 32 $ -
Gain on Sale of Non-Core Assets (a)
Saxton Decommissioning costs regulatory assets (b) - 27
(16) (5)
Trust securities impairment (c)
$ 16 $ 22
Total-Pretax Items
EPS Effect $ 0.03 $ 0.04
(a) Included in quot;Revenues - Otherquot;
(b) Included in quot;Deferral of new regulatory assetsquot;
(c) Included in quot;Investment incomequot;
2008 Earnings Per Share (EPS)
(Reconciliation of GAAP to Non-GAAP)
ACTUAL Non-GAAP
Three Months Guidance For
Ended March 31 Year 2008
Basic EPS (GAAP basis) $ 0.91 $4.18 - $4.38
Gain on Sale of Non-Core Assets (0.06) (0.06)
Trust securities impairment 0.03 0.03
Basic EPS (Non-GAAP basis) $ 0.88 $4.15 - $4.35
______________________________________________________________________________________________________
Consolidated Report to the Financial Community – 1st Quarter 2008 10
11. RECENT DEVELOPMENTS
Ohio Substitute Senate Bill 221
On April 10, 2008, an updated version of Substitute Senate Bill 221 (Substitute SB221) was introduced in the
Ohio House Public Utilities Committee (HPUC), which had been holding hearings on the Ohio Senate version of
the bill. The bill would require all utilities to file an updated rate stabilization plan, now called an electric security
plan (ESP), with the Public Utilities Commission of Ohio (PUCO). A utility also could simultaneously file a
market rate offer (MRO) in which it would have to prove the following objective market criteria:
• the utility or its transmission service affiliate belongs to a Federal Energy Regulatory Commission-
approved regional transmission organization (RTO),
• the RTO has a market-monitor function and the ability to mitigate market power, and
• a published source exists that identifies information for traded electricity and energy products scheduled
for delivery two years into the future.
The PUCO would test the ESP and its pricing and all other terms and conditions against the MRO and choose the
more favorable option. The substitute bill also includes most of the provisions of House Bill 487 (introduced on
February 21, 2008) dealing with advanced and renewable energy standards and energy efficiency, including
requirements to meet annual benchmarks. On April 15, 2008, Substitute SB221 was reported out of the HPUC and
referred to the full Ohio House of Representatives for consideration. On April 22, an amended version of
Substitute SB221 was passed by the House and sent back to the Senate for concurrence. On April 23, the Senate
approved Amended Substitute SB221 and forwarded the bill to the Governor for signature, where it is pending.
Ohio Distribution Rate Case Filing
On February 25, 2008, evidentiary hearings concluded in the distribution rate requests for FirstEnergy subsidiaries
Ohio Edison Company, The Cleveland Electric Illuminating Company, and The Toledo Edison Company (TE).
The requests for $332 million in revenue increases were filed on June 7, 2007. Public hearings were held from
March 5, 2008, through March 24, 2008. Main briefs were filed on March 28, 2008, and reply briefs were filed on
April 18, 2008. The PUCO is expected to render its decision during the 2nd or 3rd quarter of 2008.
Penn Power Interim Default Service Supply Plan
On March 13, 2008, the Pennsylvania Public Utility Commission (PPUC) approved the residential procurement
approach in Pennsylvania Power Company’s (Penn Power) Joint Petition for Settlement. This Request For
Proposal (RFP) approach calls for load-following, full-requirements contracts for default service procurement for
residential customers for the period June 1, 2008, through May 31, 2011. The PPUC had previously approved the
default service procurement approaches for commercial and industrial customers. The default service procurement
for small commercial customers was conducted through multiple RFPs, while the default service procurement for
large commercial and industrial customers will use hourly pricing. Bids in the first RFP for small commercial
load were received on February 20, 2008, and approved by the PPUC on February 22, 2008. Bids in the second
RFP were received on March 18, 2008, and approved by the PPUC on March 20, 2008. On March 28, 2008, Penn
Power filed compliance tariffs with the new default service generation rates based on the approved RFP bids for
small commercial customers, which the PPUC then certified on April 4, 2008. On April 14, 2008, the first RFP for
residential load was held consisting of tranches for both 12- and 24-month supply. The PPUC approved the bids
on April 16, 2008. The second RFP is scheduled to be held on May 14, 2008, after which Penn Power expects the
PPUC to approve the new rates, which would go into effect June 1, 2008.
Met-Ed and Penelec Transmission Service Charge Update Filing
On April 14, 2008, Metropolitan Edison Company (Met-Ed) and Pennsylvania Electric Company (Penelec) filed
annual updates to the transmission service charge rider (TSC) for the period June 1, 2008, through May 31, 2009.
The proposed TSCs include a component for under-recovery of actual transmission costs incurred during the prior
period and future transmission cost projections for June 2008 through May 2009. Met-Ed, has proposed a
transition approach that would recover past under-recovered costs plus carrying charges through the new TSC, and
defer a portion of the projected costs plus carrying charges for recovery through future TSCs by December 31,
2010.
Consolidated Report to the Financial Community – 1st Quarter 2008 11
12. Repurchase and Remarketing of Auction Rate Bonds
In February 2008, FirstEnergy’s subsidiaries elected to convert all $530 million of their outstanding auction rate
bonds to a weekly rate mode in response to disruptions in the auction rate securities markets and a loss of
confidence in bond insurers. The conversion of these bonds required their mandatory purchase on the applicable
conversion dates. Between February 27, 2008, and April 2, 2008, FirstEnergy’s subsidiaries repurchased these
securities. The companies initially funded the repurchase with short-term debt, capping their exposure at the short-
term borrowing rate. On April 22, 2008, Met-Ed ($28.5 million) and Penelec ($45 million) remarketed their bonds
that previously had been in an auction rate mode in a variable-rate mode supported by a bank letter of credit.
Subject to market conditions, the companies plan to remarket or refund the rest of these securities over the balance
of the year, either in fixed-rate or variable-rate modes.
Record Generation Output
FirstEnergy set a new first quarter generation output record of 20.4 million megawatt-hours, a 1.8% increase over
the previous record established in the first quarter of 2006. The generation record reflected favorable performance
from both the fossil and nuclear fleets.
Nuclear Operations Update
On April 14, 2008, the Perry Nuclear Power Plant returned to service following completion of a 10-day planned
outage for valve work and other maintenance in preparation for the upcoming summer months.
On April 14, 2008, Beaver Valley Unit 2 began its regularly scheduled refueling outage. During the outage,
several improvement projects are expected to take place on the 868-megawatt (MW) unit, including replacing the
high pressure turbine and inspecting the reactor vessel and other plant safety systems. BV2 operated for 520
consecutive days when it was taken off line for the outage.
Sale of Telecommunications Assets
On March 7, 2008, FirstEnergy sold substantially all of the assets of FirstEnergy Telecom Services, Inc. to First
Communications, Inc., (FirstCom) for $45 million in cash, with FirstCom also assuming related liabilities. The
sale resulted in an after-tax gain of approximately $0.06 per share. FirstEnergy is a 15.6% shareholder in
FirstCom.
Consolidated Report to the Financial Community – 1st Quarter 2008 12
13. Forward-looking Statements. This Consolidated Report to the Financial Community includes forward-looking
statements based on information currently available to management. Such statements are subject to certain risks and
uncertainties. These statements include declarations regarding our, or our management’s, intents, beliefs and current
expectations. These statements typically contain, but are not limited to, the terms “anticipate,” “potential,” “expect,”
“believe,” “estimate” and similar words. Forward-looking statements involve estimates, assumptions, known and
unknown risks, uncertainties and other factors that may cause our actual results, performance or achievements to be
materially different from any future results, performance or achievements expressed or implied by such forward-looking
statements. Actual results may differ materially due to the speed and nature of increased competition in the electric
utility industry and legislative and regulatory changes affecting how generation rates will be determined following the
expiration of existing rate plans in Ohio and Pennsylvania, economic or weather conditions affecting future sales and
margins, changes in markets for energy services, changing energy and commodity market prices, replacement power
costs being higher than anticipated or inadequately hedged, the continued ability of FirstEnergy’s regulated utilities to
collect transition and other charges or to recover increased transmission costs, maintenance costs being higher than
anticipated, other legislative and regulatory changes including revised environmental requirements and possible
greenhouse gas emissions regulation, the uncertainty of the timing and amounts of the capital expenditures needed to,
among other things, implement the Air Quality Compliance Plan (including that such amounts could be higher than
anticipated) or levels of emission reductions related to the Consent Decree resolving the New Source Review litigation
or other potential regulatory initiatives, adverse regulatory or legal decisions and outcomes (including, but not limited
to, the revocation of necessary licenses or operating permits and oversight by the Nuclear Regulatory Commission
including, but not limited to, the Demand for Information issued to FENOC on May 14, 2007) as disclosed in our SEC
filings, the timing and outcome of various proceedings before the PUCO (including, but not limited to, the Distribution
Rate Cases and the generation supply plan filing for the Ohio Companies and the successful resolution of the issues
remanded to the PUCO by the Supreme Court of Ohio regarding the Rate Stabilization Plan and the Rate Certainty Plan,
including the deferral of fuel costs) and Met-Ed and Penelec’s transmission service charge filings with the PPUC (as
well as the resolution of the Petitions for Review filed with the Commonwealth Court of Pennsylvania with respect to
the transition rate plan for Met-Ed and Penelec), the continuing availability of generating units and their ability to
continue to operate at or near full capacity, the ability to comply with applicable state and federal reliability standards,
the ability to accomplish or realize anticipated benefits from strategic goals (including employee workforce initiatives),
the ability to improve electric commodity margins and to experience growth in the distribution business, changing
market conditions that could affect the value of assets held in our nuclear decommissioning trust fund, pension fund and
other trust funds, the ability to access the public securities and other capital markets and the cost of such capital, the
risks and other factors discussed from time to time in our SEC filings, and other similar factors. The foregoing review
of factors should not be construed as exhaustive. New factors emerge from time to time, and it is not possible for us to
predict all such factors, nor can we assess the impact of any such factor on our business or the extent to which any
factor, or combination of factors, may cause results to differ materially from those contained in any forward-looking
statements. We expressly disclaim any current intention to update any forward-looking statements contained herein as a
result of new information, future events, or otherwise.
Consolidated Report to the Financial Community – 1st Quarter 2008 13