
Recomendados
Más contenido relacionado
La actualidad más candente
La actualidad más candente (10)
Destacado
Destacado (20)
Similar a fifth third bancorp Q3-07
Similar a fifth third bancorp Q3-07 (20)
Más de finance28
Más de finance28 (20)
Último
Último (20)
fifth third bancorp Q3-07
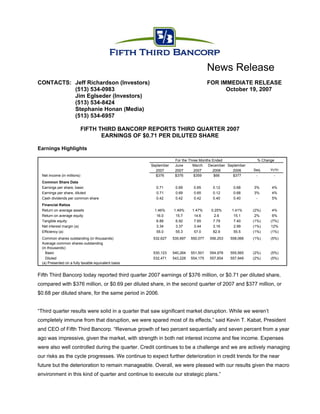
- 1. News Release CONTACTS: Jeff Richardson (Investors) FOR IMMEDIATE RELEASE (513) 534-0983 October 19, 2007 Jim Eglseder (Investors) (513) 534-8424 Stephanie Honan (Media) (513) 534-6957 FIFTH THIRD BANCORP REPORTS THIRD QUARTER 2007 EARNINGS OF $0.71 PER DILUTED SHARE Earnings Highlights For the Three Months Ended % Change September June March December September Seq Yr/Yr 2007 2007 2007 2006 2006 Net income (in millions) $376 $376 $359 $66 $377 - - Common Share Data Earnings per share, basic 0.71 0.69 0.65 0.12 0.68 3% 4% Earnings per share, diluted 0.71 0.69 0.65 0.12 0.68 3% 4% Cash dividends per common share 0.42 0.42 0.42 0.40 0.40 - 5% Financial Ratios Return on average assets 1.46% 1.49% 1.47% 0.25% 1.41% (2%) 4% Return on average equity 16.0 15.7 14.6 2.6 15.1 2% 6% Tangible equity 6.88 6.92 7.65 7.79 7.40 (1%) (7%) Net interest margin (a) 3.34 3.37 3.44 3.16 2.99 (1%) 12% Efficiency (a) 55.0 55.3 57.0 82.9 55.5 (1%) (1%) Common shares outstanding (in thousands) 532,627 535,697 550,077 556,253 558,066 (1%) (5%) Average common shares outstanding (in thousands): Basic 530,123 540,264 551,501 554,978 555,565 (2%) (5%) Diluted 532,471 543,228 554,175 557,654 557,949 (2%) (5%) (a) Presented on a fully taxable equivalent basis Fifth Third Bancorp today reported third quarter 2007 earnings of $376 million, or $0.71 per diluted share, compared with $376 million, or $0.69 per diluted share, in the second quarter of 2007 and $377 million, or $0.68 per diluted share, for the same period in 2006. “Third quarter results were solid in a quarter that saw significant market disruption. While we weren’t completely immune from that disruption, we were spared most of its effects,” said Kevin T. Kabat, President and CEO of Fifth Third Bancorp. “Revenue growth of two percent sequentially and seven percent from a year ago was impressive, given the market, with strength in both net interest income and fee income. Expenses were also well controlled during the quarter. Credit continues to be a challenge and we are actively managing our risks as the cycle progresses. We continue to expect further deterioration in credit trends for the near future but the deterioration to remain manageable. Overall, we were pleased with our results given the macro environment in this kind of quarter and continue to execute our strategic plans.”
- 2. Income Statement Highlights For the Three Months Ended % Change September June March December September Seq Yr/Yr 2007 2007 2007 2006 2006 Condensed Statements of Income ($ in millions) Net interest income (taxable equivalent) $760 $745 $742 $744 $719 2% 6% Provision for loan and lease losses 139 121 84 107 87 14% 59% Total noninterest income 722 707 648 219 662 2% 9% Total noninterest expense 816 803 793 798 767 2% 6% 527 528 513 58 527 - - Income before income taxes (taxable equivalent) Taxable equivalent adjustment 6 6 6 6 6 - - Applicable income taxes 145 146 148 (14) 144 (1%) 1% Net income available to common 376 375 359 66 377 - - shareholders (a) Earnings per share, diluted $0.71 $0.69 $0.65 $0.12 $0.68 3% 4% (a) Dividends on preferred stock are $.185 million for all quarters presented Net Interest Income For the Three Months Ended % Change September June March December September Seq Yr/Yr 2007 2007 2007 2006 2006 Interest Income ($ in millions) Total interest income (taxable equivalent) $1,535 $1,495 $1,466 $1,551 $1,540 3% - 775 750 724 807 821 Total interest expense 3% (6%) Net interest income (taxable equivalent) $760 $745 $742 $744 $719 2% 6% Average Yield Yield on interest-earning assets 6.74% 6.76% 6.79% 6.58% 6.40% - 5% Yield on interest-bearing liabilities 4.04% 4.08% 4.07% 4.17% 4.14% (1%) (2%) Net interest rate spread (taxable equivalent) 2.70% 2.68% 2.72% 2.41% 2.26% 1% 19% Net interest margin (taxable equivalent) 3.34% 3.37% 3.44% 3.16% 2.99% (1%) 12% Average Balances ($ in millions) Loans and leases, including held for sale $78,244 $77,048 $75,861 $75,262 $73,938 2% 6% 12,129 11,711 11,673 18,262 21,582 Total securities and other short-term investments 4% (44%) 76,070 73,735 72,148 76,769 78,735 Total interest-bearing liabilities 3% (3%) 9,325 9,599 9,970 10,150 9,878 Shareholders' equity (3%) (6%) Net interest income of $760 million on a taxable equivalent basis was up $15 million, or two percent, from the second quarter. Growth was driven by a two percent increase in earning assets, wider asset spreads, and lower wholesale borrowing rates during the quarter. Otherwise, the following factors offset one another in their effect on net interest income. Interest reversals on higher nonperforming assets as well as issuance of trust preferred securities and share repurchases in the second and third quarters lowered net interest income, while net interest income benefited from $6 million in dividend rate adjustments associated with the agreement to repurchase our REIT preferred stock, modest reductions in consumer deposit rates, and a higher day count. The net interest margin was 3.34 percent, down 3 bps. The margin was reduced by the impact of interest reversals on nonperforming loans, day count, and the issuance of trust preferred securities and share repurchases, offset by the benefit of the REIT dividends. Otherwise, wider asset spreads and lower wholesale borrowing costs produced modest margin expansion. Compared with the third quarter 2006, net interest income increased $41 million, or six percent, and the net interest margin expanded 35 bps, primarily the result of the fourth quarter 2006 balance sheet actions. 2
- 3. Average Loans For the Three Months Ended % Change September June March December September Seq Yr/Yr 2007 2007 2007 2006 2006 Average Loans and Leases ($ in millions) Commercial: Commercial loans $22,345 $21,587 $20,908 $21,228 $20,879 4% 7% Commercial mortgage 11,117 11,030 10,566 9,929 9,833 1% 13% Commercial construction 5,499 5,595 6,014 6,099 5,913 (2%) (7%) Commercial leases 3,700 3,678 3,661 3,762 3,740 1% (1%) Subtotal - commercial loans and leases 42,661 41,890 41,149 41,018 40,365 2% 6% Consumer: Residential mortgage loans 10,396 10,201 10,166 10,038 9,699 2% 7% Home equity 11,752 11,886 12,072 12,225 12,174 (1%) (3%) Automobile loans 10,865 10,552 10,230 9,834 9,522 3% 14% Credit card 1,366 1,248 1,021 915 870 9% 57% Other consumer loans and leases 1,204 1,271 1,223 1,232 1,308 (5%) (8%) Subtotal - consumer loans and leases 35,583 35,158 34,712 34,244 33,573 1% 6% Total average loans and leases $78,244 $77,048 $75,861 $75,262 $73,938 2% 6% Average loan and lease balances grew two percent sequentially and six percent over the third quarter last year. Average commercial loans and leases grew two percent sequentially and six percent compared with the year ago quarter. Average C&I loan growth was four percent sequentially and reflects growth in customer balances related to the disruption in wholesale capital markets. Commercial mortgage balances grew $87 million and commercial construction loans declined $96 million, reflecting the conversion of construction loans to permanent financing and otherwise low levels of activity in this sector. Consumer loans and leases grew one percent sequentially and six percent compared with the year ago quarter, reflecting strong auto loan and credit card growth, offset by anticipated run-off in the consumer lease portfolio totaling $381 million versus third quarter 2006. Excluding this run-off, consumer loans and leases grew seven percent versus the quarter a year ago. Average Deposits For the Three Months Ended % Change September June March December September Seq Yr/Yr 2007 2007 2007 2006 2006 Average Deposits ($ in millions) Demand deposits $13,143 $13,370 $13,185 $13,882 $13,642 (2%) (4%) Interest checking 14,334 15,061 15,509 15,744 16,251 (5%) (12%) Savings 15,390 14,620 13,689 12,812 12,279 5% 25% Money market 6,247 6,244 6,377 6,572 6,371 - (2%) Foreign office (a) 1,808 1,637 1,343 1,047 770 10% 135% Subtotal - Transaction deposits 50,922 50,932 50,103 50,057 49,313 - 3% Other time 10,290 10,780 11,037 10,991 10,794 (5%) (5%) Subtotal - Core deposits 61,212 61,712 61,140 61,048 60,107 (1%) 2% Certificates - $100,000 and over 6,062 6,511 6,682 6,750 6,415 (7%) (5%) Other foreign office 1,981 732 364 1,711 2,898 171% (32%) Total deposits $69,255 $68,955 $68,186 $69,509 $69,420 - - (a) Includes commercial customer Eurodollar sweep balances for which the Bancorp pays rates comparable to other commercial deposit accounts. Average core deposits were down one percent sequentially and grew two percent over third quarter 2006. Strong growth in savings was largely offset by declines in interest checking, CDs and commercial demand deposits. Retail core deposits decreased two percent sequentially, driven primarily by growth in savings that was more than offset by declines in interest checking and CDs, and were up two percent from a year ago as 3
- 4. savings and DDA balance growth more than offset declines in interest checking and CDs. Commercial core deposits grew one percent both sequentially and from the third quarter 2006. Weighted average rates paid on interest-bearing core deposits declined to 3.36 percent compared with 3.42 percent in the second quarter. This reflected a modest reduction in rates paid across certain product offerings, partially offset by a continued shift from DDA and interest checking into higher rate deposit products, primarily savings and money market accounts. Noninterest Income For the Three Months Ended % Change September June March December September Seq Yr/Yr 2007 2007 2007 2006 2006 Noninterest Income ($ in millions) Electronic payment processing revenue $253 $243 $225 $232 $218 4% 16% 151 142 126 122 134 Service charges on deposits 6% 13% 95 97 96 90 89 Investment advisory revenue (3%) 7% 91 88 83 82 79 Corporate banking revenue 3% 15% 26 41 40 30 36 Mortgage banking net revenue (36%) (28%) 93 96 78 58 87 Other noninterest income (3%) 6% 13 - - (398) 19 Securities gains (losses), net NM (32%) Securities gains, net - non-qualifying hedges - - - 3 - on mortgage servicing rights NM NM Total noninterest income $722 $707 $648 $219 $662 2% 9% Noninterest income rose $15 million sequentially, or two percent, on higher revenues in payment processing, deposit service charges and corporate banking, as securities gains were more than offset by a sequential reduction in mortgage banking revenue. Compared with third quarter 2006, noninterest income grew nine percent, with growth across nearly every category except mortgage banking. We saw particular year-over- year strength in electronic payment processing revenue, deposit service charges and corporate banking revenue. Excluding securities gains, mortgage banking, and other noninterest income, sequential growth was three percent and year-over-year growth was 13 percent. Electronic payment processing revenue of $253 million increased four percent sequentially and 16 percent over last year, on strong growth in merchant processing and card issuer interchange offset by slower growing business financial institutions revenue. We expect growth in merchant processing to approximate current levels as we continue adding large, national merchant accounts. Higher card usage and an increase in credit card accounts, stemming from success in our initiative to increase our customer penetration, drove increased card issuer interchange. Higher card usage volumes drove financial institutions revenue growth. Service charges on deposits of $151 million increased six percent sequentially and 13 percent versus the same quarter last year. Retail service charges increased 11 percent from the second quarter, driven by strong new account openings and higher levels of customer activity. Retail deposit revenue grew 19 percent compared with the year ago quarter. Commercial service charges increased by one percent sequentially and increased five percent compared with last year. 4
- 5. Investment advisory revenue of $95 million was down three percent sequentially and up seven percent over third quarter last year. Private bank revenue increased three percent sequentially and was up 10 percent from the same quarter last year. Brokerage fee revenue declined nine percent sequentially, reflecting seasonality and volatile equity markets in the third quarter, and increased seven percent year-over-year due to growth in the number of licensed brokers. Corporate banking revenue of $91 million increased three percent sequentially and 15 percent year-over- year, reflecting our continued efforts to build out our corporate banking capabilities. Growth was driven by higher letter of credit fees and foreign exchange revenue, as well as loan syndications and asset backed securities activity. Mortgage banking net revenue totaled $26 million, compared with $41 million last quarter and $36 million in the prior year quarter, with the reduction from prior quarters primarily attributable to lower gain-on-sale margins realized during the quarter. Mortgage originations of $3.0 billion were down from $3.3 billion in second quarter 2007 and up from $2.3 billion in third quarter 2006. Gains on loan sales and other fees of $9 million declined from $25 million in the second quarter and $21 million in third quarter 2006. Gains were significantly affected by liquidity issues in mortgage markets during the third quarter, resulting in wider credit spreads. Third quarter 2007 results included the impact of $3 million in mark-to-market losses on $470 million of jumbo mortgages and $110 million of Alt-A mortgages, previously held for sale, which were transferred to the loan portfolio. We expect to hold future jumbo loan production in our portfolio, while current Alt-A production is being underwritten and delivered within agency flow sale agreements. Net servicing revenue, before MSR valuation adjustments, totaled $14 million in the third quarter, compared with $13 million in the second quarter and $13 million a year ago. The MSR valuation and related mark-to-market adjustments on free-standing derivatives netted to a positive $3 million adjustment in the third quarter, the same as in the second and year ago quarters. The mortgage-servicing asset, net of the valuation reserve, was $621 million at quarter end on a servicing portfolio of $33.1 billion. Securities gains and losses were $13 million in net gains on investment securities in the third quarter of 2007 compared with net gains of $19 million in the third quarter of 2006. Results last year consisted of $53 million in gains from sale of MasterCard, Inc. shares and $34 million of losses on investment securities. Other noninterest income totaled $93 million in the third quarter compared with $96 million last quarter and $87 million in the same quarter last year. Included in third quarter 2007 results were a gain of $15 million on the sale of FDIC deposit insurance credits and a loss of $6 million on auto loans held for securitization. Last quarter’s results included a $16 million gain on sale of $89 million in certain non-strategic credit card accounts. Third quarter 2006 results included net gains totaling $10.5 million from the sale of three Indiana branches and the sale of $23 million of out-of-footprint credit card receivables. 5
- 6. Noninterest Expense For the Three Months Ended % Change September June March December September Seq Yr/Yr 2007 2007 2007 2006 2006 Noninterest Expense ($ in millions) Salaries, wages and incentives $310 $309 $292 $300 $288 1% 8% Employee benefits 67 68 87 61 74 (2%) (10%) Payment processing expense 105 97 92 89 84 9% 25% Net occupancy expense 66 68 65 65 63 (2%) 6% Technology and communications 41 41 40 39 36 - 15% Equipment expense 30 31 29 30 32 (2%) (7%) Other noninterest expense 197 189 188 214 190 4% 4% Total noninterest expense $816 $803 $793 $798 $767 2% 6% Noninterest expense of $816 million increased two percent from second quarter 2007 and increased six percent from third quarter 2006. Payment processing expense growth associated with the increase in processing activity was a significant driver of overall expense growth. Otherwise, expense growth was flat sequentially and four percent versus a year ago. Salaries, wages and incentives were up $1 million sequentially, reflecting higher revenue-based incentives partially offset by lower salaries and wages. Second quarter 2007 results included $5 million in severance expense associated with expense reduction initiatives. Compared with the third quarter of 2006, noninterest expense increased six percent as salaries, wages and incentives were up eight percent largely as a result of higher performance-based compensation. Employee benefits expense included $6 million in costs associated with pension settlement expense in the third quarter, compared with $8 million in the third quarter last year. Payment processing expense growth of 25 percent was driven by similar growth in transaction volumes. Third quarter 2006 results included an $11 million charge associated with early extinguishment of debt. Year-over-year expense growth in other categories largely reflected higher de novo related expenses, up $7 million, and technology investments. Credit Quality For the Three Months Ended September June March December September 2007 2007 2007 2006 2006 Total net losses charged off ($ in millions) Commercial loans ($23) ($24) ($15) ($29) ($25) Commercial mortgage loans (8) (16) (7) (11) (7) Commercial construction loans (5) (7) (6) (3) (1) Commercial leases - - (1) - 1 Residential mortgage loans (9) (9) (7) (8) (5) Home equity (27) (20) (17) (14) (14) Automobile loans (25) (15) (16) (19) (15) Credit card (13) (10) (8) (10) (8) Other consumer loans and leases (5) (1) 6 (3) (5) Total net losses charged off (115) (102) (71) (97) (79) Total losses (127) (124) (99) (118) (96) Total recoveries 12 22 28 21 17 Total net losses charged off ($115) ($102) ($71) ($97) ($79) Ratios Net losses charged off as a percent of average loans and leases (excluding held for sale) 0.60% 0.55% 0.39% 0.52% 0.43% Commercial 0.33% 0.44% 0.27% 0.42% 0.32% Consumer 0.93% 0.68% 0.53% 0.64% 0.57% 6
- 7. Net charge-offs as a percentage of average loans and leases were 60 bps in the third quarter, compared with 55 bps last quarter and 43 bps in the third quarter of 2006. Sequential growth was primarily due to higher consumer charge-offs and lower commercial recoveries. Gross charge-offs and recoveries were 66 bps and 6 bps, respectively, of loans and leases, compared with 66 bps and 11 bps in the second quarter of 2007. Consumer net charge-offs of $79 million, or 93 bps, grew $24 million from the second quarter, driven primarily by losses in the auto and home equity portfolios. Auto charge-offs increased $10 million compared with last quarter primarily driven by higher deficiency balances on repossessed autos. Home equity losses increased $7 million compared with last quarter primarily due to increased losses on higher LTV and brokered second mortgage loans, reflecting borrower stress and lower home price valuations in certain geographies. Commercial net charge-offs of $36 million, or 33 bps, declined $11 million compared with the second quarter, driven by lower losses in the C&I and commercial mortgage portfolio and lower C&I recoveries. No commercial charge-off recorded in the third quarter exceeded $2 million. Second quarter net charge-offs included $3 million in losses related to the sale of $27 million in nonperforming commercial loans, and third quarter 2006 net charge-offs included $3 million in losses on the sale of $17 million in nonperforming commercial loans. For the Three Months Ended September June March December September 2007 2007 2007 2006 2006 Allowance for Credit Losses ($ in millions) Allowance for loan and lease losses, beginning $803 $784 $771 $761 $753 Total net losses charged off (115) (102) (71) (97) (79) Provision for loan and lease losses 139 121 84 107 87 Allowance for loan and lease losses, ending 827 803 784 771 761 Reserve for unfunded commitments, beginning 77 79 76 76 74 Provision for unfunded commitments 2 (2) 3 - 2 Reserve for unfunded commitments, ending 79 77 79 76 76 Components of allowance for credit losses: Allowance for loan and lease losses 827 803 784 771 761 Reserve for unfunded commitments 79 77 79 76 76 Total allowance for credit losses $906 $880 $863 $847 $837 Ratios Allowance for loan and lease losses as a percent of loans and leases 1.08% 1.06% 1.05% 1.04% 1.04% Provision for loan and lease losses totaled $139 million in the third quarter, exceeding net charge-offs of $115 million, compared with $121 million last quarter and $87 million in the same quarter last year. The allowance for loan and lease losses represented 1.08 percent of total loans and leases outstanding as of quarter end, compared with 1.06 percent last quarter and 1.04 percent in the same quarter last year. For the Three Months Ended September June March December September 2007 2007 2007 2006 2006 Nonperforming Assets and Delinquent Loans ($ in millions) Nonaccrual loans and leases $569 $406 $390 $352 $320 Other assets, including other real estate owned 137 122 104 103 91 Total nonperforming assets 706 528 494 455 411 Ninety days past due loans and leases 360 302 243 210 196 Nonperforming assets as a percent of loans, leases and other assets, including other real estate owned 0.92% 0.70% 0.66% 0.61% 0.56% 7
- 8. Nonperforming assets (NPAs) at quarter end were $706 million, or 92 bps of total loans and leases and other real estate owned, up from 70 bps last quarter and 56 bps in the third quarter a year ago. Sequential growth in NPAs was $178 million, or 34 percent. Commercial NPAs of $446 million, or 104 bps, grew $116 million. Commercial construction and commercial mortgage continued to drive commercial NPA growth, particularly in Eastern Michigan, Northeastern Ohio, and Southern Florida which together accounted for two-thirds of the increase in commercial NPAs. Consumer NPAs of $260 million, or 78 bps, grew $62 million, driven primarily by higher first and second mortgage non-accrual loans, including $22 million related to debt restructurings with borrowers as well as higher foreclosed real estate, reflecting the impact of a weaker economy in parts of our footprint and generally lower home prices. Florida and Michigan accounted for almost two-thirds of the consumer NPA increase. Delinquent loans were $360 million, up $58 million from the second quarter, with the growth split evenly between commercial and consumer. Commercial delinquency growth was concentrated in construction lending, particularly in Southern Florida and Eastern Michigan. Consumer growth was driven by residential delinquencies in Florida and Michigan. Capital Position/Other For the Three Months Ended September June March December September 2007 (a) 2007 2007 2006 2006 Capital Position Average shareholders' equity to average assets 9.13% 9.53% 10.05% 9.70% 9.33% Tangible equity 6.88% 6.92% 7.65% 7.79% 7.40% Regulatory capital ratios: Tier I capital 8.50% 8.45% 8.13% 8.71% 8.39% 8.64% Total risk-based capital 10.91% 10.54% 11.19% 11.07% 10.61% 10.95% Tier I leverage 9.27% 8.76% 9.36% 8.44% 8.52% (a) Current period regulatory capital data and ratios are estimated The tangible equity ratio was relatively flat sequentially, and declined 52 bps compared with the prior year third quarter primarily due to the effect of share repurchases partially offset by lower tangible assets as a result of the fourth quarter 2006 balance sheet actions. Regulatory capital ratios benefited from the issuance of $575 million in trust preferred securities. As previously announced, Fifth Third entered into an agreement to repurchase the outstanding Series B preferred shares of the Fifth Third REIT. The transaction is expected to close in December 2007 and will lower fourth quarter regulatory capital ratios by approximately 65 bps. During the quarter, we repurchased 2.9 million shares at a total cost of $110 million. As of September 30, 2007, there were 19.2 million shares remaining under our current share repurchase authorization. Our effective tax rate was 27.9%, similar to the tax rates experienced in the second quarter of 2007 and third quarter of 2006. The third quarter tax rate benefited from certain items that resulted in a net benefit of $8 million after-tax. On August 16, 2007, Fifth Third Bancorp and First Charter Corporation (“FCTR”) signed a definitive agreement under which Fifth Third will acquire First Charter Bank, which operates 57 branches in North 8
- 9. Carolina and two in Atlanta, Georgia. The transaction is expected to close in the first quarter of 2008. On September 21, 2007, Fifth Third and First Horizon Corporation (“FHN”) signed a definitive agreement under which Fifth Third will acquire nine branches in the Atlanta metro area from First Horizon. The transaction is expected to close in the first quarter of 2008. These transactions are expected to reduce first quarter 2008 capital ratios by approximately 45 bps. Additionally, we have received the necessary regulatory approvals to complete our acquisition of R-G Crown Bank, expected to close in November 2007. This transaction is expected to reduce fourth quarter capital ratios by approximately 40 bps. Outlook The following outlook represents currently expected full year growth rates compared with full year 2006 results. The outlook does not include the effect of our pending acquisition of R-G Crown Bank. Our outlook is based on current expectations as of the date of this release for results within our businesses; prevailing views related to economic growth, inflation, unemployment and other economic factors; and market forward interest rate expectations. These expectations are inherently subject to risks and uncertainties. There are a number of factors that could cause results to differ materially from historical performance and these expectations. We undertake no obligation to update these expectations after the date of this release. Please refer to the cautionary statement at the end of this release for more information. Category Growth, percentage, or bps range [change from July] Net interest income Mid single digits Net interest margin 3.35-3.40% Noninterest income* High single digits Noninterest expense** Mid-to-high single digits Loans Mid single digits Core deposits Low-to-mid single digits Net charge-offs Mid-50 bps range Effective tax rate [non-tax equivalent] 28.5-29.0% Tangible equity/tangible asset ratio 2007 target 6.5% [including R-G Crown] *comparison with the prior year excludes $415 million of losses recorded in noninterest income related to fourth quarter 2006 balance sheet actions **comparison with the prior year excludes $49 million of charges: $10 million in third quarter 2006 related to the early retirement of debt, and $39 million in fourth quarter 2006 related to termination of financing agreements Conference Call Fifth Third will host a conference call to discuss these financial results at 8:30 a.m. (Eastern Time) today. The audio webcast is available through the Fifth Third Investor Relations website at www.53.com (click on “About Fifth Third” then “Investor Relations”). Participants are advised to access the conference call at least 15 minutes prior to the scheduled start time. The dial-in number is 877-309-0967 for domestic access and 706- 679-3977 for international access (password: Fifth Third). 9
- 10. If you are unable to listen to the live call you may access a webcast replay or podcast through the Fifth Third Investor Relations website at www.53.com. Additionally, a replay of the conference call will be available until Friday, November 2nd by dialing 800-642-1687 for domestic access and 706-645-9291 for international access (passcode 5024648#). Corporate Profile Fifth Third Bancorp is a diversified financial services company headquartered in Cincinnati, Ohio. The Company has $104 billion in assets, operates 18 affiliates with 1,181 full-service Banking Centers, including 104 Bank Mart® locations open seven days a week inside select grocery stores and 2,153 ATMs in Ohio, Kentucky, Indiana, Michigan, Illinois, Florida, Tennessee, West Virginia, Pennsylvania and Missouri. Fifth Third operates five main businesses: Commercial Banking, Branch Banking, Consumer Lending, Investment Advisors and Fifth Third Processing Solutions. Fifth Third is among the largest money managers in the Midwest and, as of September 30, 2007, has $232 billion in assets under care, of which it managed $34 billion for individuals, corporations and not-for-profit organizations. Investor information and press releases can be viewed at www.53.com. Fifth Third’s common stock is traded through the NASDAQ® National Global Select Market System under the symbol “FITB.” FORWARD-LOOKING STATEMENTS This report may contain forward-looking statements about Fifth Third Bancorp and/or the company as combined acquired entities within the meaning of Sections 27A of the Securities Act of 1933, as amended, and Rule 175 promulgated thereunder, and 21E of the Securities Exchange Act of 1934, as amended, and Rule 3b-6 promulgated thereunder, that involve inherent risks and uncertainties. This report may contain certain forward-looking statements with respect to the financial condition, results of operations, plans, objectives, future performance and business of Fifth Third Bancorp and/or the combined company including statements preceded by, followed by or that include the words or phrases such as “believes,” “expects,” “anticipates,” “plans,” “trend,” “objective,” “continue,” “remain” or similar expressions or future or conditional verbs such as “will,” “would,” “should,” “could,” “might,” “can,” “may” or similar expressions. There are a number of important factors that could cause future results to differ materially from historical performance and these forward-looking statements. Factors that might cause such a difference include, but are not limited to: (1) general economic conditions, either national or in the states in which Fifth Third, one or more acquired entities and/or the combined company do business, are less favorable than expected; (2) political developments, wars or other hostilities may disrupt or increase volatility in securities markets or other economic conditions; (3) changes in the interest rate environment reduce interest margins; (4) prepayment speeds, loan origination and sale volumes, charge-offs and loan loss provisions; (5) our ability to maintain required capital levels and adequate sources of funding and liquidity; (6) changes and trends in capital markets; (7) competitive pressures among depository institutions increase significantly; (8) effects of critical accounting policies and judgments; (9) changes in accounting policies or procedures as may be required by the Financial Accounting Standards Board or other regulatory agencies; (10) legislative or regulatory changes or actions, or significant litigation, adversely affect Fifth Third, one or more acquired entities and/or the combined company or the businesses in which Fifth Third, one or more acquired entities and/or the combined company are engaged; (11) ability to maintain favorable ratings from rating agencies; (12) fluctuation of Fifth Third’s stock price; (13) ability to attract and retain key personnel; (14) ability to receive dividends from its subsidiaries; (15) potentially dilutive effect of future acquisitions on current shareholders' ownership of Fifth Third; (16) effects of accounting or financial results of one or more acquired entity; (17) difficulties in combining the operations of acquired entities; (18) ability to secure confidential information through the use of computer systems and telecommunications network; and (19) the impact of reputational risk created by these developments on such matters as business generation and retention, funding and liquidity. Additional information concerning factors that could cause actual results to differ materially from those expressed or implied in the forward-looking statements is available in the Bancorp's Annual Report on Form 10-K for the year ended December 31, 2006, filed with the United States Securities and Exchange Commission (SEC). Copies of this filing are available at no cost on the SEC's Web site at www.sec.gov or on the Fifth Third’s Web site at www.53.com. Fifth Third undertakes no obligation to release revisions to these forward-looking statements or reflect events or circumstances after the date of this report. ### 10
- 11. Quarterly Financial Review for September 30, 2007 Table of Contents Financial Highlights 12-13 Consolidated Statements of Income 14 Consolidated Statements of Income (Taxable Equivalent) 15 Consolidated Balance Sheets 16-17 Consolidated Statements of Changes in Shareholders’ Equity 18 Average Balance Sheet and Yield Analysis 19-21 Summary of Loans and Leases 22 Regulatory Capital 23 Summary of Credit Loss Experience 24 Asset Quality 25 11
- 12. Fifth Third Bancorp and Subsidiaries Financial Highlights $ in millions, except per share data (unaudited) For the Three Months Ended % Change Year to Date % Change September June September September September 2007 2007 2006 Seq Yr/Yr 2007 2006 Yr/Yr Income Statement Data Net interest income (a) $760 $745 $719 2% 6% $2,247 $2,154 4% Noninterest income 722 707 662 2% 9% 2,077 1,934 7% Total revenue (a) 1,482 1,452 1,381 2% 7% 4,324 4,088 6% Provision for loan and lease losses 139 121 87 14% 59% 344 236 45% Noninterest expense 816 803 767 2% 6% 2,411 2,257 7% Net income 376 376 377 - - 1,111 1,123 (1%) Common Share Data Earnings per share, basic $0.71 $0.69 $0.68 3% 4% $2.05 $2.02 1% Earnings per share, diluted 0.71 0.69 0.68 3% 4% 2.04 2.01 1% Cash dividends per common share $0.42 $0.42 $0.40 - 5% $1.26 $1.18 7% Book value per share 17.54 17.16 17.96 2% (2%) 17.54 17.96 (2%) Dividend payout ratio 59.3% 59.7% 59.2% (1%) - 61.1% 58.6% 4% Market price per share: High $41.17 $43.32 $40.18 (5%) 2% $43.32 $41.43 5% Low 33.60 37.88 35.95 (11%) (7%) 33.60 35.86 (6%) End of period 33.88 39.77 38.08 (15%) (11%) 33.88 38.08 (11%) Common shares outstanding (in thousands) 532,627 535,697 558,066 (1%) (5%) 532,627 558,066 (5%) Average common shares outstanding (in thousands): Basic 530,123 540,264 555,565 (2%) (5%) 540,551 554,985 (3%) Diluted 532,471 543,228 557,949 (2%) (5%) 543,212 557,440 (3%) Market capitalization $18,045 $21,305 $21,251 (15%) (15%) $18,045 $21,251 (15%) Price/earnings ratio (b) 15.61 18.58 14.53 (16%) 7% 15.61 14.53 7% Financial Ratios Return on average assets 1.46% 1.49% 1.41% (2%) 4% 1.47% 1.42% 4% Return on average equity 16.0% 15.7% 15.1% 2% 6% 15.4% 15.5% (1%) Noninterest income as a percent of total revenue 49% 49% 48% - 2% 48% 47% 2% Average equity as a percent of average assets 9.13% 9.53% 9.33% (4%) (2%) 9.56% 9.19% 4% Tangible equity 6.88% 6.92% 7.40% (1%) (7%) 6.88% 7.40% (7%) Net interest margin (a) 3.34% 3.37% 2.99% (1%) 12% 3.38% 3.03% 12% Efficiency (a) 55.0% 55.3% 55.5% (1%) (1%) 55.8% 55.2% 1% Effective tax rate 27.9% 28.1% 27.6% (1%) 1% 28.4% 28.9% (2%) Credit Quality Net losses charged off $115 $102 $79 13% 46% $288 $219 32% Net losses charged off as a percent of average loans and leases 0.60% 0.55% 0.43% 9% 40% 0.51% 0.41% 24% Allowance for loan and lease losses as a percent of loans and leases 1.08% 1.06% 1.04% 2% 4% 1.08% 1.04% 4% Allowance for credit losses as a percent of loans and leases 1.19% 1.16% 1.14% 3% 4% 1.19% 1.14% 4% Nonperforming assets as a percent of loans, leases and other assets, including other real estate owned 0.92% 0.70% 0.56% 31% 64% 0.92% 0.56% 64% Average Balances Loans and leases, including held for sale $78,244 $77,048 $73,938 2% 6% $77,060 $72,896 6% Total securities and other short-term investments 12,129 11,711 21,582 4% (44%) 11,839 22,309 (47%) Total assets 102,131 100,767 105,868 1% (4%) 100,707 105,452 (4%) Transaction deposits (d) 50,922 50,932 49,313 - 3% 50,657 49,549 2% Core deposits (e) 61,212 61,712 60,107 (1%) 2% 61,357 59,883 2% Wholesale funding (f) 28,001 25,393 32,270 10% (13%) 25,875 32,396 (20%) Shareholders' equity 9,325 9,599 9,878 (3%) (6%) 9,629 9,696 (1%) Regulatory Capital Ratios (c) Tier I capital 8.50% 8.13% 8.64% 5% (2%) 8.50% 8.64% (2%) Total risk-based capital 10.91% 10.54% 10.61% 4% 3% 10.91% 10.61% 3% Tier I leverage 9.27% 8.76% 8.52% 6% 9% 9.27% 8.52% 9% Operations Banking centers 1,181 1,167 1,145 1% 3% 1,181 1,145 3% ATMs 2,153 2,132 2,114 1% 2% 2,153 2,114 2% Full-time equivalent employees 20,775 21,033 21,301 (1%) (2%) 20,775 21,301 (2%) (a) Presented on a fully taxable equivalent basis (b) Based on the most recent twelve-month diluted earnings per share and end of period stock prices (c) Current period regulatory capital ratios are estimates (d) Includes demand, interest checking, savings, money market and foreign office deposits of commercial customers (e) Includes transaction deposits plus other time deposits (f) Includes certificates $100,000 and over, other foreign office deposits, federal funds purchased, short-term borrowings and long-term debt 12
- 13. Fifth Third Bancorp and Subsidiaries Financial Highlights $ in millions, except per share data (unaudited) For the Three Months Ended September June March December September 2007 2007 2007 2006 2006 Income Statement Data Net interest income (a) $760 $745 $742 $744 $719 Noninterest income 722 707 648 219 662 Total revenue (a) 1,482 1,452 1,390 963 1,381 Provision for loan and lease losses 139 121 84 107 87 Noninterest expense 816 803 793 798 767 Net income 376 376 359 66 377 Common Share Data Earnings per share, basic $0.71 $0.69 $0.65 $0.12 $0.68 Earnings per share, diluted 0.71 0.69 0.65 0.12 0.68 Cash dividends per common share $0.42 $0.42 $0.42 $0.40 $0.40 Book value per share 17.54 17.16 17.82 18.02 17.96 Dividend payout ratio 59.3% 59.7% 64.5% 338.0% 59.2% Market price per share: High $41.17 $43.32 $41.41 $41.57 $40.18 Low 33.60 37.88 37.93 37.75 35.95 End of period 33.88 39.77 38.69 40.93 38.08 Common shares outstanding (in thousands) 532,627 535,697 550,077 556,253 558,066 Average common shares outstanding (in thousands): Basic 530,123 540,264 551,501 554,978 555,565 Diluted 532,471 543,228 554,175 557,654 557,949 Market capitalization $18,045 $21,305 $21,282 $22,767 $21,251 Price/earnings ratio (b) 15.61 18.58 18.08 19.13 14.53 Financial Ratios Return on average assets 1.46% 1.49% 1.47% 0.25% 1.41% Return on average equity 16.0% 15.7% 14.6% 2.6% 15.1% Noninterest income as a percent of total revenue 49% 49% 47% 23% 48% Average equity as a percent of average assets 9.13% 9.53% 10.05% 9.70% 9.33% Tangible equity 6.88% 6.92% 7.65% 7.79% 7.40% Net interest margin (a) 3.34% 3.37% 3.44% 3.16% 2.99% Efficiency (a) 55.0% 55.3% 57.0% 82.9% 55.5% Effective tax rate 27.9% 28.1% 29.3% (27.0%) 27.6% Credit Quality Net losses charged off $115 $102 $71 $97 $79 Net losses charged off as a percent of average loans and leases 0.60% 0.55% 0.39% 0.52% 0.43% Allowance for loan and lease losses as a percent of loans and leases 1.08% 1.06% 1.05% 1.04% 1.04% Allowance for credit losses as a percent of loans and leases 1.19% 1.16% 1.15% 1.14% 1.14% Nonperforming assets as a percent of loans, leases and other assets, including other real estate owned 0.92% 0.70% 0.66% 0.61% 0.56% Average Balances Loans and leases, including held for sale $78,244 $77,048 $75,861 $75,262 $73,938 Total securities and other short-term investments 12,129 11,711 11,673 18,262 21,582 Total assets 102,131 100,767 99,192 104,602 105,868 Transaction deposits (d) 50,922 50,932 50,103 50,057 49,313 Core deposits (e) 61,212 61,712 61,140 61,048 60,107 Wholesale funding (f) 28,001 25,393 24,193 29,603 32,270 Shareholders' equity 9,325 9,599 9,970 10,150 9,878 Regulatory Capital Ratios (c) Tier I capital 8.50% 8.13% 8.71% 8.39% 8.64% Total risk-based capital 10.91% 10.54% 11.19% 11.07% 10.61% Tier I leverage 9.27% 8.76% 9.36% 8.44% 8.52% Operations Banking centers 1,181 1,167 1,161 1,150 1,145 ATMs 2,153 2,132 2,104 2,096 2,114 Full-time equivalent employees 20,775 21,033 21,442 21,362 21,301 (a) Presented on a fully taxable equivalent basis (b) Based on the most recent twelve-month diluted earnings per share and end of period stock prices (c) Current period regulatory capital ratios are estimates (d) Includes demand, interest checking, savings, money market and foreign office deposits of commercial customers (e) Includes transaction deposits plus other time deposits (f) Includes certificates $100,000 and over, other foreign office deposits, federal funds purchased, short-term borrowings and long-term debt 13
- 14. Fifth Third Bancorp and Subsidiaries Consolidated Statements of Income $ in millions (unaudited) For the Three Months Ended % Change Year to Date % Change September June September September September 2007 2007 2006 Seq Yr/Yr 2007 2006 Yr/Yr Interest Income Interest and fees on loans and leases $1,376 $1,343 $1,294 2% 6% $4,032 $3,668 10% Interest on securities 147 143 238 3% (38%) 433 735 (41%) Interest on other short-term investments 6 3 2 136% 171% 12 7 78% Total interest income 1,529 1,489 1,534 3% - 4,477 4,410 2% Interest Expense Interest on deposits 511 505 510 1% - 1,514 1,392 9% Interest on short-term borrowings 93 72 106 29% (12%) 224 302 (26%) Interest on long-term debt 171 173 205 (1%) (16%) 510 582 (12%) Total interest expense 775 750 821 3% (6%) 2,248 2,276 (1%) 754 739 713 2% 6% 2,229 2,134 4% Net Interest Income Provision for loan and lease losses 139 121 87 14% 59% 344 236 45% Net interest income after 615 618 626 (1%) (2%) 1,885 1,898 (1%) provision for loan and lease losses Noninterest Income Electronic payment processing revenue 253 243 218 4% 16% 721 626 15% Service charges on deposits 151 142 134 6% 13% 419 395 6% Investment advisory revenue 95 97 89 (3%) 7% 288 276 4% Corporate banking revenue 91 88 79 3% 15% 261 236 11% Mortgage banking net revenue 26 41 36 (36%) (28%) 107 125 (14%) Other noninterest income 93 96 87 (3%) 6% 267 242 10% Securities gains (losses), net 13 - 19 NM (32%) 14 34 (59%) Securities gains, net - non-qualifying hedges on mortgage servicing rights - - - NM NM - - NM Total noninterest income 722 707 662 2% 9% 2,077 1,934 7% Noninterest Expense Salaries, wages and incentives 310 309 288 1% 8% 912 875 4% Employee benefits 67 68 74 (2%) (10%) 222 230 (4%) Payment processing expense 105 97 84 9% 25% 294 236 25% Net occupancy expense 66 68 63 (2%) 6% 199 180 11% Technology and communications 41 41 36 - 15% 122 102 20% Equipment expense 30 31 32 (2%) (7%) 90 86 5% Other noninterest expense 197 189 190 4% 4% 572 548 4% Total noninterest expense 816 803 767 2% 6% 2,411 2,257 7% Income before income taxes 521 522 521 - - 1,551 1,575 (2%) and cumulative effect Applicable income taxes 145 146 144 (1%) 1% 440 456 (4%) 376 376 377 - - 1,111 1,119 (1%) Income before cumulative effect Cumulative effect of change in accounting principle, net of tax (a) - - - NM NM - 4 (100%) $376 $376 $377 - - $1,111 $1,123 (1%) Net income $376 $375 $377 - - $1,110 $1,122 (1%) Net income available to common shareholders (b) (a) Reflects a benefit of $3.5 million (net of $1.7 million of tax) for the adoption of SFAS No. 123(R) as of January 1, 2006 due to the recognition of an estimate of forfeiture experience to be realized for all stock-based awards (b) Dividends on preferred stock are $.185 million for all quarters presented 14
- 15. Fifth Third Bancorp and Subsidiaries Consolidated Statements of Income (Taxable Equivalent) $ in millions (unaudited) For the Three Months Ended September June March December September 2007 2007 2007 2006 2006 Interest Income Interest and fees on loans and leases $1,376 $1,343 $1,314 $1,332 $1,294 Interest on securities 147 143 143 199 238 Interest on other short-term investments 6 3 3 14 2 Total interest income 1,529 1,489 1,460 1,545 1,534 Taxable equivalent adjustment 6 6 6 6 6 Total interest income (taxable equivalent) 1,535 1,495 1,466 1,551 1,540 Interest Expense Interest on deposits 511 505 498 518 510 Interest on short-term borrowings 93 72 59 100 106 Interest on long-term debt 171 173 167 189 205 Total interest expense 775 750 724 807 821 760 745 742 744 719 Net interest income (taxable equivalent) Provision for loan and lease losses 139 121 84 107 87 Net interest income (taxable equivalent) after 621 624 658 637 632 provision for loan and lease losses Noninterest Income Electronic payment processing revenue 253 243 225 232 218 Service charges on deposits 151 142 126 122 134 Investment advisory revenue 95 97 96 90 89 Corporate banking revenue 91 88 83 82 79 Mortgage banking net revenue 26 41 40 30 36 Other noninterest income 93 96 78 58 87 Securities gains (losses), net 13 - - (398) 19 Securities gains, net - non-qualifying hedges on mortgage servicing rights - - - 3 - Total noninterest income 722 707 648 219 662 Noninterest Expense Salaries, wages and incentives 310 309 292 300 288 Employee benefits 67 68 87 61 74 Payment processing expense 105 97 92 89 84 Net occupancy expense 66 68 65 65 63 Technology and communications 41 41 40 39 36 Equipment expense 30 31 29 30 32 Other noninterest expense 197 189 188 214 190 Total noninterest expense 816 803 793 798 767 Income before income taxes and 527 528 513 58 527 cumulative effect (taxable equivalent) Taxable equivalent adjustment 6 6 6 6 6 Income before income taxes 521 522 507 52 521 and cumulative effect Applicable income taxes 145 146 148 (14) 144 376 376 359 66 377 Income before cumulative effect Cumulative effect of change in accounting principle, net of tax - - - - - $376 $376 $359 $66 $377 Net income $376 $375 $359 $66 $377 Net income available to common shareholders (a) (a) Dividends on preferred stock are $.185 million for all quarters presented 15
- 16. Fifth Third Bancorp and Subsidiaries Consolidated Balance Sheets $ in millions, except per share data (unaudited) As of % Change September June September 2007 2007 2006 Seq Yr/Yr Assets Cash and due from banks $2,540 $2,327 $2,399 9% 6% Available-for-sale and other securities (a) 10,777 11,015 19,514 (2%) (45%) Held-to-maturity securities (b) 346 346 359 - (4%) Trading securities 155 148 164 5% (5%) Other short-term investments 720 404 125 78% 476% Loans held for sale 2,761 1,708 872 62% 216% Portfolio loans and leases: Commercial loans 22,649 22,152 21,260 2% 7% Commercial mortgage loans 11,090 11,044 9,879 - 12% Commercial construction loans 5,463 5,469 5,879 - (7%) Commercial leases 3,710 3,697 3,751 - (1%) Residential mortgage loans 9,057 8,477 8,811 7% 3% Home equity 11,737 11,780 12,235 - (4%) Automobile loans 10,006 10,714 9,599 (7%) 4% Credit card 1,460 1,263 876 16% 67% Other consumer loans and leases 1,082 1,113 1,190 (3%) (9%) Portfolio loans and leases 76,254 75,709 73,480 1% 4% Allowance for loan and lease losses (827) (803) (761) 3% 9% Portfolio loans and leases, net 75,427 74,906 72,719 1% 4% Bank premises and equipment 2,127 2,063 1,902 3% 12% Operating lease equipment 283 209 142 35% 99% Goodwill 2,192 2,192 2,193 - - Intangible assets 138 147 175 (6%) (21%) Servicing rights 626 607 504 3% 24% Other assets 6,173 5,318 4,760 16% 30% $104,265 $101,390 $105,828 3% (1%) Total assets Liabilities Deposits: Demand $13,174 $13,524 $13,883 (3%) (5%) Interest checking 14,294 14,672 15,855 (3%) (10%) Savings 15,599 15,036 12,392 4% 26% Money market 6,163 6,334 6,462 (3%) (5%) Foreign office 2,014 1,744 846 15% 138% Other time 10,267 10,428 10,818 (2%) (5%) Certificates - $100,000 and over 5,973 6,204 6,871 (4%) (13%) Other foreign office 1,898 1,251 1,516 52% 25% Total deposits 69,382 69,193 68,643 - 1% Federal funds purchased 5,130 3,824 5,434 34% (6%) Other short-term borrowings 3,796 3,331 3,833 14% (1%) Accrued taxes, interest and expenses 2,244 2,114 2,156 6% 4% Other liabilities 1,871 1,780 1,570 5% 19% Long-term debt 12,498 11,957 14,170 5% (12%) 94,921 92,199 95,806 3% (1%) Total liabilities 9,344 9,191 10,022 2% (7%) Total shareholders' equity (c) $104,265 $101,390 $105,828 3% (1%) Total liabilities and shareholders' equity (a) Amortized cost $11,007 $11,370 $20,103 (3%) (45%) (b) Market values 346 346 359 - (4%) (c) Common shares, stated value $2.22 per share (in thousands): Authorized 1,300,000 1,300,000 1,300,000 - - Outstanding, excluding treasury 532,627 535,697 558,066 (1%) (5%) Treasury 50,800 47,730 25,361 6% 100% 16
- 17. Fifth Third Bancorp and Subsidiaries Consolidated Balance Sheets $ in millions, except per share data (unaudited) As of September June March December September 2007 2007 2007 2006 2006 Assets Cash and due from banks $2,540 $2,327 $2,244 $2,737 $2,399 Available-for-sale and other securities (a) 10,777 11,015 10,592 11,053 19,514 Held-to-maturity securities (b) 346 346 347 356 359 Trading securities 155 148 160 187 164 Other short-term investments 720 404 223 809 125 Loans held for sale 2,761 1,708 1,382 1,150 872 Portfolio loans and leases: Commercial loans 22,649 22,152 21,479 20,831 21,260 Commercial mortgage loans 11,090 11,044 10,906 10,405 9,879 Commercial construction loans 5,463 5,469 5,688 6,168 5,879 Commercial leases 3,710 3,697 3,687 3,841 3,751 Residential mortgage loans 9,057 8,477 8,484 8,830 8,811 Home equity 11,737 11,780 11,926 12,153 12,235 Automobile loans 10,006 10,714 10,400 10,028 9,599 Credit card 1,460 1,263 1,111 1,004 876 Other consumer loans and leases 1,082 1,113 1,140 1,093 1,190 Portfolio loans and leases 76,254 75,709 74,821 74,353 73,480 Allowance for loan and lease losses (827) (803) (784) (771) (761) Portfolio loans and leases, net 75,427 74,906 74,037 73,582 72,719 Bank premises and equipment 2,127 2,063 2,001 1,940 1,902 Operating lease equipment 283 209 212 202 142 Goodwill 2,192 2,192 2,192 2,193 2,193 Intangible assets 138 147 158 166 175 Servicing rights 626 607 572 524 504 Other assets 6,173 5,318 5,704 5,770 4,760 $104,265 $101,390 $99,824 $100,669 $105,828 Total assets Liabilities Deposits: Demand $13,174 $13,524 $13,510 $14,331 $13,883 Interest checking 14,294 14,672 15,755 15,993 15,855 Savings 15,599 15,036 14,256 13,181 12,392 Money market 6,163 6,334 6,336 6,584 6,462 Foreign office 2,014 1,744 1,495 1,353 846 Other time 10,267 10,428 10,869 10,987 10,818 Certificates - $100,000 and over 5,973 6,204 6,776 6,628 6,871 Other foreign office 1,898 1,251 191 323 1,516 Total deposits 69,382 69,193 69,188 69,380 68,643 Federal funds purchased 5,130 3,824 1,622 1,421 5,434 Other short-term borrowings 3,796 3,331 2,383 2,796 3,833 Accrued taxes, interest and expenses 2,244 2,114 2,324 2,283 2,156 Other liabilities 1,871 1,780 1,883 2,209 1,570 Long-term debt 12,498 11,957 12,620 12,558 14,170 94,921 92,199 90,020 90,647 95,806 Total liabilities 9,344 9,191 9,804 10,022 10,022 Total shareholders' equity (c) $104,265 $101,390 $99,824 $100,669 $105,828 Total liabilities and shareholders' equity (a) Amortized cost $11,007 $11,370 $10,754 $11,236 $20,103 (b) Market values 346 346 347 356 359 (c) Common shares, stated value $2.22 per share (in thousands): Authorized 1,300,000 1,300,000 1,300,000 1,300,000 1,300,000 Outstanding, excluding treasury 532,627 535,697 550,077 556,253 558,066 Treasury 50,800 47,730 33,350 27,174 25,361 17
- 18. Fifth Third Bancorp and Subsidiaries Consolidated Statements of Changes in Shareholders' Equity $ in millions (unaudited) For the Three Months Ended Year to Date September September September September 2007 2006 2007 2006 $9,191 $9,556 $10,022 $9,446 Total shareholders' equity, beginning Net income 376 377 1,111 1,123 Other comprehensive income, net of tax: Change in unrealized gains and (losses): Available-for-sale securities 81 288 (30) 13 Qualifying cash flow hedges 13 3 7 8 Change in accumulated other comprehensive income related to employee benefit plans 1 - 4 - Comprehensive income 471 668 1,092 1,144 Cash dividends declared: Common stock (224) (223) (680) (658) Preferred stock (a) - - (1) (1) Stock-based awards exercised, including treasury shares issued 1 6 46 30 Stock-based compensation expense 11 17 46 61 Loans repaid (issued) related to exercise of stock-based awards, net 1 2 3 7 Change in corporate tax benefit related to stock-based compensation 1 (1) 4 (1) Shares acquired for treasury (110) - (1,084) (1) Impact of cumulative effect of change in accounting principle (b) - - (98) (6) Other 2 (3) (6) 1 $9,344 $10,022 $9,344 $10,022 Total shareholders' equity, ending (a) Dividends on preferred stock are $.185 million for all quarters presented (b) 2007 includes $96 million impact due to the adoption of FSP FAS 13-2, quot;Accounting for a Change or Projected Change in the Timing of Cash Flows Relating to Income Taxes Generated by a Leverage Lease Transactionquot; on January 1, 2007 and $2 million impact due to the adoption of FIN No. 48, quot;Accounting for Uncertainty in Income Taxes - An Interpretation of FASB Statement No. 109quot; on January 1, 2007. 2006 impact is due to the adoption of SFAS No. 123(R) quot;Share-Based Paymentquot; on January 1, 2006. 18
- 19. Fifth Third Bancorp and Subsidiaries Average Balance Sheet and Yield Analysis $ in millions, except share data (unaudited) For the Three Months Ended % Change September June September 2007 2007 2006 Seq Yr/Yr Assets Interest-earning assets: Commercial loans $22,345 $21,587 $20,879 4% 7% Commercial mortgage loans 11,117 11,030 9,833 1% 13% Commercial construction loans 5,499 5,595 5,913 (2%) (7%) Commercial leases 3,700 3,678 3,740 1% (1%) Residential mortgage loans 10,396 10,201 9,699 2% 7% Home equity 11,752 11,886 12,174 (1%) (3%) Automobile loans 10,865 10,552 9,522 3% 14% Credit card 1,366 1,248 870 9% 57% Other consumer loans and leases 1,204 1,271 1,308 (5%) (8%) Taxable securities 11,180 11,030 20,836 1% (46%) Tax exempt securities 490 508 587 (4%) (17%) Other short-term investments 459 173 159 166% 188% Total interest-earning assets 90,373 88,759 95,520 2% (5%) Cash and due from banks 2,228 2,265 2,355 (2%) (5%) Other assets 10,330 10,524 8,745 (2%) 18% Allowance for loan and lease losses (800) (781) (752) 2% 6% $102,131 $100,767 $105,868 1% (4%) Total assets Liabilities Interest-bearing liabilities: Interest checking $14,334 $15,061 $16,251 (5%) (12%) Savings 15,390 14,620 12,279 5% 25% Money market 6,247 6,244 6,371 - (2%) Foreign office 1,808 1,637 770 10% 135% Other time 10,290 10,780 10,794 (5%) (5%) Certificates - $100,000 and over 6,062 6,511 6,415 (7%) (5%) Other foreign office 1,981 732 2,898 171% (32%) Federal funds purchased 4,322 3,540 4,546 22% (5%) Other short-term borrowings 3,285 2,372 4,056 39% (19%) Long-term debt 12,351 12,238 14,355 1% (14%) Total interest-bearing liabilities 76,070 73,735 78,735 3% (3%) Demand deposits 13,143 13,370 13,642 (2%) (4%) Other liabilities 3,593 4,063 3,613 (12%) (1%) 92,806 91,168 95,990 2% (3%) Total liabilities 9,325 9,599 9,878 (3%) (6%) Shareholders' equity $102,131 $100,767 $105,868 1% (4%) Total liabilities and shareholders' equity SEP 07 JUN 07 SEP 06 Yield Analysis Interest-earning assets: Commercial loans 7.45% 7.45% 7.39% Commercial mortgage loans 7.31% 7.30% 7.31% Commercial construction loans 7.55% 7.69% 7.90% Commercial leases 4.23% 4.32% 4.85% Residential mortgage loans 6.12% 6.12% 5.96% Home equity 7.63% 7.66% 7.67% Automobile loans 6.34% 6.26% 5.84% Credit card 10.03% 10.62% 12.06% Other consumer loans and leases 5.23% 5.41% 4.77% Total loans and leases 6.99% 7.01% 6.96% Taxable securities 5.00% 4.98% 4.39% Tax exempt securities 7.17% 7.38% 7.29% Other short-term investments 5.35% 6.08% 5.69% Total interest-earning assets 6.74% 6.76% 6.40% Interest-bearing liabilities: Interest checking 2.14% 2.21% 2.49% Savings 3.15% 3.23% 3.08% Money market 4.35% 4.44% 4.30% Foreign office 4.33% 4.38% 4.11% Other time 4.61% 4.63% 4.24% Certificates - $100,000 and over 5.11% 5.12% 5.03% Other foreign office 5.12% 5.31% 5.30% Federal funds purchased 5.15% 5.31% 5.33% Other short-term borrowings 4.50% 4.31% 4.42% Long-term debt 5.47% 5.65% 5.66% Total interest-bearing liabilities 4.04% 4.08% 4.14% Ratios: Net interest margin (taxable equivalent) 3.34% 3.37% 2.99% Net interest rate spread (taxable equivalent) 2.70% 2.68% 2.26% Interest-bearing liabilities to interest-earning assets 84.17% 83.07% 82.43% 19