1. The Need For Power In Texas
Natural Gas Fundamentals And Reliance On Gas-Fired …That Is Further Complicated By Rapidly Growing Demand
Generation Have Placed Texas’ Power Supply At Risk… And An Aging Generation Fleet
Growing supply deficit for US natural gas… …and increased reliance on foreign reserves… Texas has a rapidly growing population… …that will deplete current reserve margins…
95-10E; TCF 05; Percent (100% = 6,338 TCF) Total population growth ERCOT reserve margins
00-15E; Millions of people 00-11E; Percent
Other Russia
25 6.3 5.7
US Over 80% of 27 5.2 30 29
23 Over 80% of 26
demand total world 41 23
total world
reserves are 16 17 16 15
21 reserves are 2.4 11
controlled by
controlled by 2.0 2.0 9 7
19 US foreign 1.4
1.1 1.1 0.9
5
foreign 15
supply Iran
17 governments
governments 3 14
95 97 99 01 03 05 07 09 U.S. CA TX FL AZ GA NC VA NV WA MD 00 02 04 06E 08E 10E
Qatar
…and stress an aging generation fleet… …resulting in increasing heat rates
…have driven high and volatile prices… …particularly in markets with gas on the ERCOT generation fleet age ERCOT generation supply
95-10E; $/MMBtu1 margin 06; Percent of generation capacity 06; $/MWh @ $8/MMBtu gas
06; Percent of time gas is on the margin 100% = 77 GW Peak demand
150 06 10
12 343%
343% 41-50yrs >50yrs
10 92 90+ 2%
80 79 6% <10yrs 100
8
58 31-40yrs
6 47 22%
40 35% 50
4
2 0
0 19% 0 20 40 60 80
FRCC ERCOT WECC NEPOOL Entergy SPP PJM
95 97 99 01 03 05 07 09 21-30yrs 16% Cumulative capacity (GW)
1 Projected prices from 06-10 based on calendar strip prices as of Aug 31, 2006 1 10-20yrs 2
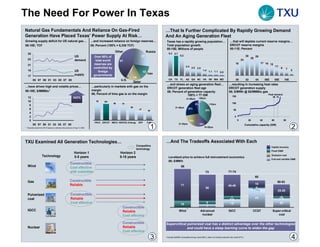
TXU Examined All Generation Technologies… …And The Tradeoffs Associated With Each
Competitive Capital recovery
technology
Fixed O&M
Horizon 1 Horizon 2
Technology Emission cost
0-5 years 5-15 years Levelized price to achieve full reinvestment economics
Fuel and variable O&M
06; $/MWh
Constructible
Wind Cost effective 86
with subsidies 73 71-74
60
Gas Constructible 50-53
Reliable 71 15
45-48
58 2
0.2 25-28
Pulverized Constructible
7 43 4
coal Reliable 0.6 1.0
Cost effective 15
8 18 20
Constructible 7
1
IGCC Reliable Wind Advanced IGCC CCGT Super-critical
Cost effective nuclear coal
Constructible Supercritical pulverized coal has a distinct advantage over the other technologies
Supercritical pulverized coal has a distinct advantage over the other technologies
Nuclear Reliable and could have a steep learning curve to widen the gap
and could have a steep learning curve to widen the gap
Cost effective
3 1Includes $3/MWh renewable energy credit (REC); does not include production tax credit (PTC)
4
2. The Need For Power In Texas
TXU’s Plan Will Help Meet These Challenges In Texas TXU’s Program Will Help Ensure Reliability And Reduce
Reliance On Natural Gas In Texas…
Historical and projected ERCOT Generation capacity by fuel type
Ensuring reliability and reducing reliance of natural gas reserve margins 06-10E; Percent
through a plan to bring on 9 GW of new capacity by 2010, 00-11E; Percent
1 rebalancing the Texas supply stack and helping to maintain
40
Impact of TXU Power 100%= 1,070 GW 77 GW 90 GW
adequate reserve margins through 2014 Generation Program
30
30 29
26 35 42
23 Other 58
19
Lowering prices by leveraging a scale power generation 20 16 17 16 17
2 program to displace high cost generation and share savings
with our customers
15
11 12
12
10 3 12 65
Gas 58
42
9 7 5
0
Improving the environment through the largest ever 00 03 06E 09E US Texas 06E Texas 10E
3 voluntary offset program and displacement of less efficient
generation capacity
2000 – 2004
2000 – 2004
22 GW of natural gas fired
22 GW of natural gas fired
generation added;
generation added;
2005 – 2007
2005 – 2007
Rapid
Rapid
demand
demand
2008 – 2011+
2008 – 2011+
Dangerously
Dangerously
low supplies
low supplies
Reduction in gas
Reduction in gas
reliance and
reliance and
volatility by shifting
volatility by shifting
adequate supplies growth require 1.5 GW the stack away from
adequate supplies growth require 1.5 GW the stack away from
eliminates
eliminates per year
per year gas towards solid
gas towards solid
reserve fuel
reserve fuel
5 Source: ERCOT, 10/1/05 and 6/19/06
6
…Allowing TXU To Deliver Lower Cost Power To Its …While Continuing To Improve The Texas Environment
Customers…
Breakeven power prices for TXU’s Power Generation Program Total annual ERCOT market
Estimated key emissions
SO2 NOX Hg
06E; $/MWh savings Thousands of tons
Forward power price 11E; $ billions 2005 emissions (nine existing facilities) 273.1 42.1 .0025
76-79 17
1.7
Emissions after new development and
218.5 33.7 .0020
5 4
voluntary reductions
50-53 Total TXU reductions 54.6 8.4 .0005
Reduction relative to 05 TXU emissions (20%) (20%) (20%)
Additional reductions from displacement of 3rd
0.0 12.1 0.0
party units
US ranking1 among 20 largest coal generators 1st 1st 2nd
Market savings TXU emissions rates1 relative to US average (63%) (82%) (30%)
Expectations Decreased Decreased Operational TXU
for subscale capital costs fuel costs advantages target
builder
TXU has committed to the largest voluntary emissions reduction in U.S. history
TXU has committed to the largest voluntary emissions reduction in U.S. history
Without scale, it would be virtually impossible for TXU TXU’s plan will more than double its capacity in Texas while cutting key
TXU’s plan will more than double its capacity in Texas while cutting key
Without scale, it would be virtually impossible for TXU
to deliver needed cost savings to its customers emissions by 20% and its emission rates by 70%
emissions by 20% and its emission rates by 70%
to deliver needed cost savings to its customers
7 1 TXU after new power generation development program and retrofits; relative to average US coal plant
8
3. Coal Is The Fuel Of Choice
While TXU Believes A Portfolio Of Technologies Is Needed To …Today, Supercritical Coal Appears To Have The Economic
Meet America’s Energy Challenges… Advantage
Horizon 1 Horizon 2
Capital recovery
Technology 0-5 years 5-15 years
Fixed O&M
Levelized price to achieve full reinvestment economics
Constructible 06; $/MWh Emission cost
Wind Fuel and variable O&M
Cost effective 86
with subsidies
73 71-74
Gas Constructible 60
Reliable
50-53
71 15
45-48
SCPC Constructible 58 2
Reliable 0.2 25-28
Cost effective
7 43 4
Constructible 0.6 1.0
IGCC Reliable 8 18 20
Capacity additions Cost effective 15
7
represent 12% of 06-20 1
US demand growth Constructible Wind Advanced IGCC CCGT Supercritical coal
Nuclear Reliable nuclear
Cost effective
Technology GW Technology GW
TXU aspiration: Wind 1.5 Wind 3.0 Supercritical pulverized coal has a distinct advantage over the other technologies
Supercritical pulverized coal has a distinct advantage over the other technologies
balanced portfolio of
SCPC 23.0 SCPC 30.0 and could have a steep learning curve to widen the gap
and could have a steep learning curve to widen the gap
IGCC 0.0 IGCC 6.0
state of the art Nuclear 2.5 Nuclear 8.0
generation 1Includes
1 2
$3/MWh renewable energy credit (REC); Does not include production tax credit (PTC)
Total 27.0 Total 47.0
While The Characteristics Of Wind Generation Make It …Wind Must Be Part Of The Solution
Difficult To Meet Long-Term Baseload Demand…
TXU plans to double its wind …furthering Texas as the nation’s
portfolio by 2010… leader in wind generation capacity
Wind availability versus hourly electricity demand in ERCOT
06; Percent TXU wind generation purchases Total wind generation capacity
05-10E; MW 06; MW
100 146%
146%
80 1,425 2,370 2,325
Hourly 1,260
1,100
At peak demand demand 930
60 periods wind
averages less than
40 20% capacity 580
Wind 825 800
capacity
20
0
1 5 9 13 17 21
06E 07E 08E 09E 10E TX CA IA MN
Hours
Not only does wind peak in the off-peak hours, it peaks in the shoulder months
Not only does wind peak in the off-peak hours, it peaks in the shoulder months TXU is the largest purchaser of wind generation in Texas
TXU is the largest purchaser of wind generation in Texas
Source: AWEA Second Quarter Market Report, July
3 Source: AWEA Second Quarter Market Report, July
4
4. Coal Is The Fuel Of Choice
There Must Be Regulatory And Capital Breakthroughs To …As Well As Solutions For Long-Term Storage Of Spent Fuel
Make Nuclear Generation Competitive In The Long Term… Escalating costs with expectations of …and concerns about storage capacity have made
additional increases…. nuclear capacity additions uncertain
Estimated construction cost for the Estimated U.S. used nuclear fuel accumulation
High construction costs… …combined with long …result in a high total Yucca Mountain Project 00-50E; Thousands of tons of heavy metal (tHM)
lead times… cost relative to coal 86-00; $ billion1
200
MIT “global
76% growth”
Construction costs Installation time Breakeven power price 76% Nuclear
scenario
06E; $/KW 127% 06E; Months 167% 06E; $/MWh 43% growth
127% 167% 43% 60 150 scenario
Yucca Mountain
2,500 120 70-73 73 capacity according to
DOE 01 study (83,800
20 100 tHM)
34
1,100 45 CO21 50-53
50 Yucca Mountain
legal capacity
(63,000 tHM)
SCPC coal Nuclear SCPC coal Nuclear SCPC coal Nuclear
0
86 00 00 05 15 25 35 45
The lack of a long-term spent fuel solution also makes
The lack of a long-term spent fuel solution also makes
nuclear a longer-term generation solution
nuclear a longer-term generation solution A solution for spent fuel must be defined before nuclear can be a long-term
A solution for spent fuel must be defined before nuclear can be a long-term
solution for America
solution for America
5 6
1 Based on potential carbon scenario with current European ETS pricing 1 02 dollars
Today, IGCC Is Uncompetitive With The Supercritical Coal Gas Fundamentals And Improvements In Supercritical Coal
Technology Make It The Winning Economic Technology Today
Coal is a relatively low cost fuel source… …in abundant supply in the US
Breakeven power price of SCPC and IGCC in Texas Commodity prices US reserves
06; $/MWh 99-06; $/MMBtu 04; Years of remaining reserves
12 191%
200 1,900%
1,900%
3 2 71-74
13 4 1 9 Natural Gas
50-53 1 6
1
3
Coal 29%
0 10
Sep- Sep- Sep- Sep- Sep- Sep- Sep- Sep-
99 00 01 02 03 04 05 06 Gas Coal
TXU PC Lower Lower Higher Lower Longer Longer Higher IGCC
reference emissions heat rate capital capacity ramp up time to operating estimate
Coal technology has become more cost …and emissions have been reduced
plant cost cost factor time build cost effective… dramatically
PC ref plant Per TXU
9,130
$1,100/KW 94% None 38 months $42/KW/yr Improvements in construction cost NOX emissions from US power plants
MMBtu/ 95-05; Percent reduction 05; Lbs/MMBtu
estimate nominal (online 01/10)
MWh
IGCC baseline Per TXU 8,520 $1,800/KW 85% 6 Months 62 months $56/KW/yr
estimate MMBtu/ nominal (online 01/12) 45 85%
MWh 104% 0.33
85%
104%
22
IGCC is unproven on coal available in Texas
IGCC is unproven on coal available in Texas
Longer construction time makes it difficult to hedge output
Longer construction time makes it difficult to hedge output 0.03-0.13
0.05
Cost of carbon capture is not necessarily advantaged
Cost of carbon capture is not necessarily advantaged
US average TXU new Gas
Source: GE; EPRI, academic literature; press reports
7 Gas Coal coal coal 8
5. Coal Is The Fuel Of Choice
TXU Is Investing In The Newest Technology… …To Ensure The Plants Are Part Of The Environmental
Solution
SO2
Building the most efficient plants in the country… …designed for potential future carbon capture Average emission rates
Coal plant steam outlet temperatures for plants NOX
under construction
70-15E; Lbs/MMBtu
06E; Degrees Fahrenheit 4.37
Meet EPRI IEA requirements to be
1,085 1,085 advanced considered carbon capture TXU
supercritical ready status
standard
Sufficient space in critical
access locations
>90%
>90%
1,050 1,050 1,050 Options for CO2 storage
1.08
0.78
Design studies on potential 0.29 0.35 0.29
separation methodologies 0.12 0.12 ~0.2 ~0.1 0.10 0.05
TXU Plant Plant Plant Plant Pre-investments including
US Avg US Avg Texas CAIR Oak Grove, Reference
plant siting
reference A B C D 1970 2004 2004 2015 Sandow 5 plants
plant
TXU is commercializing the most efficient coal plants and continues to ensure
TXU is commercializing the most efficient coal plants and continues to ensure TXU’s new plants will operate with the best available control technology,
TXU’s new plants will operate with the best available control technology,
the plants will be able to be retrofitted with carbon capture technology
the plants will be able to be retrofitted with carbon capture technology reinforcing Texas’ proven environmental track record
reinforcing Texas’ proven environmental track record
9 Source: EPA Acid Rain database and EIA 10
TXU Is Proactively Investing In Next Generation Technologies As In Europe, TXU Believes These Advances Will Continue To
Make Coal The Winning Technology
TXU is investing across technologies… …while working to commercialize
Horizon 1 Horizon 2 technologies across the entire value chain…
0-5 years 5-15 years Generation Demand Levelized breakeven power cost European announced new
Wind $/MWh build capacity
11+; Percent (100%=54 GW)
Gas Fuel
Combustion
Efficiency
Flue gas Customer IGCC Other
Gasification removal initiatives
Advanced coal 100 Wind Coal
• Coal • Waste to • R&D • Solid CO2 • Time of
Wind 5
cleaning energy partnership capture use retail
IGCC • Oxy- • Chilled products
firing NH3 • CO2 free 80 Nuclear
• MEA products 40
• Storage • Efficiency 33
Nuclear study solutions
60
…acquiring the lowest-cost carbon offsets …and starting an environmental ventures CCGT @
across the world economy… fund to spur investment in this area SCPC 6.50/MMBtu
40 5 4
06; $/ton Nuclear 13
TXU 0 5 10 15 20 25 30 35 IGCC
120 Transport Natural
Methane efficiency CO2 credit, $/ton
90 capture
gas
Bank $200M
Industrial
No-till
Advisory
60 gas fund Board
farming Equipment
capture It would take a combination of low gas prices and high sustained carbon prices to
It would take a combination of low gas prices and high sustained carbon prices to
30 supplier make the winning technology a non-coal technology
make the winning technology a non-coal technology
0 Venture
0 1 2 3 4 5 6 7 8 capital This gap will continue to widen as the coal construction learning curve is exploited
This gap will continue to widen as the coal construction learning curve is exploited
CO2 reductions (Billion tons) 11 12
6. TXU Development: Solving America’s
Energy Challenges
TXU Power Development Is Focused On Developing A TXU Announced 9.1 GW of New Coal Capacity To Meet The
Pipeline Of Origination Opportunities Future Power Needs Of Texas
To become the
Net
leading originator Capacity
Mission and constructor of
Unit MW Fuel County
baseload generation
throughout the US Oak Grove 1, 2 1,634 Lignite Robertson
Valley
Monticello Sandow 5 581 Lignite Milam
Morgan Creek Martin Lake
Big Brown Big Brown 3 858 PRB Freestone
Tradinghouse
Originate long-term
Develop steady Construct baseload Lake Creek Oak Grove Monticello 4 858 PRB Titus
off-take agreements
pipeline of baseload generation 35% Sandow
and equity sell Martin Lake 4 858 PRB Rusk
Objectives opportunities to add cheaper and faster
downs to ensure 30%
3 GW of new capacity and make 5% annual
of construction is Morgan Creek 7 858 PRB Mitchell
annually improvement
sold forward
Tradinghouse 3, 4 1,716 PRB McLennan
PJM Development Proprietary Construction Muni/Co-op Solutions
Program Whole System Approach Lake Creek 3 858 PRB McLennan
Industrial Solutions
Incumbent Customer Advantaged Relationships
Equity Partnership Valley 4 858 PRB Fannin
Solutions Strategy With Top Contractors and
Solutions
Manufacturers
Strategies Industrial Partnerships
National Advocacy
Global Low-cost Country, TXU is using its current, advantaged sites to expand capacity in ERCOT
TXU is using its current, advantaged sites to expand capacity in ERCOT
Scaled Sourcing Program
Initiative
Learning Curve Codification
1 2
TXU Has Focused Its Near-Term Ex-ERCOT Growth On The TXU Is Also Working With Regulated Entities To Deliver New
Deregulated PJM and Northeast Markets Generation At Lower All-In Costs
Northeast coal investment return analysis Status of PJM development
TXU’s current origination efforts include up to …to provide potential customers with long-
06; IRR effort 10 GW of new generation… term, low-cost power
Breakeven power prices for TXU’s Power
Generation Program
Completed Outstanding
06E; $/MWh
Status Units GW 4 76-79
Target entry zones 5
3 GW of sites Final fuel plan 17
identified/secured Key Preliminary discussions 5 4
Preliminary stakeholder
transmission agreements 50-53
studies complete completed by
Advanced discussions 4 3.5
Site engineering end of 2006
complete Geo-technical Letters of intent1 3 2.5
Preliminary air evaluation
modeling complete Definitive agreements 0 0
Permit levels
identified and Total 12 10
discussed with
states TXU Increased Increased Operational Regulated
High
target capital fuel costs disadvan- cost
costs tages expecta-
tions
Low TXU has had more than 10 unsolicited requests for development projects in
TXU has had more than 10 unsolicited requests for development projects in
regulated markets
regulated markets
1 Letter of intent signed or in approval process.
3 4
7. TXU Development: Meeting America’s
Energy Challenges
Improving New Build Construction Performance Could …Potentially Opening Additional Markets For New Coal
Enable Displacement Of Existing, Inefficient Generation… Plant Developments…
US 7X24 power prices Designing a business
07E; $/MWh model for advanced coal
to compete in markets
Generation reinvestment economic comparison (PV/I = 1.3)
with coal on the margin
06; $/MWh
71-74 SOx
SOx
73
emissions
emissions
60 7 cost
cost
8 19 56
Variable ~50
cost 7
40-43 43 7X24
43 21 10
Fixed 19 53
prices
58
45-48 4 High
cost 4 15
2 28
Capital 23-26 7
15 17-20
recovery 8 3 5
CCGT Nuclear IGCC Advanced Advanced Nuclear Old CCGT Old un-
($6.50/ coal – TXU coal – (existing) ($6.50/ scrubbed
MMBtu reference potential next MMBtu coal
gas price) plant target1 wave gas price) plants
reference
plant2
Low
If TXU could lower capital costs by ~30% and/or improve heat rate by 7%, TXU’s
If TXU could lower capital costs by ~30% and/or improve heat rate by 7%, TXU’s
next wave of coal plants could displace both gas and old coal plants
next wave of coal plants could displace both gas and old coal plants Coal-on-coal competition represents a 78 GW market opportunity in the US
Coal-on-coal competition represents a 78 GW market opportunity in the US
1 $1,100/KW cost to build, 9.13 MMBtu/MWh heat rate
2 $800/KW cost to build, 8.5 MMBtu/MWh heat rate
5 6
…By Creating An Opportunity To Replace Existing Coal TXU Believes That Tougher Environmental Standards…
With New Efficient Advanced Coal
US coal fleet heat rates US coal fleet ages TXU is redefining environmental standards …and CO2 emissions over the long-term
06; Percent of US coal generation capacity 06; Percent of US coal generation capacity for regulated emissions...
CO2 emissions rate
100% = 313 GW 100% = 313 GW
20E; Tons/MWh
>12 HR 0.96 0.54
>50yrs
8-9 HR 41-50yrs <10yrs 0.80
4% 2% For every incremental 1 ton of
11-12 HR 8% 10-20yrs For every incremental 1 ton of
16% 1%
9% emissions of SO2, ,NOX, ,and Hg
emissions of SO NO and Hg
22% 2 X
from new generation, existing 0.42
34% from new generation, existing
9-10 HR emissions in Texas must be
emissions in Texas must be
reduced by 1.2 tons
reduced by 1.2 tons
34% 32%
Peaking Coal Reduction Long-term
38%
31-40yrs
10-11 HR 21-30yrs gas today levers vision -
(11 HR) CCGT
Almost 60% of generation capacity is more than 30 years old and has a heat
Almost 60% of generation capacity is more than 30 years old and has a heat TXU is working across the power value chain to commercialize
TXU is working across the power value chain to commercialize
rate of above 10.0
rate of above 10.0 technologies that will economically improve environmental performance
technologies that will economically improve environmental performance
7 8