SlideShare una empresa de Scribd logo
1 de 4
Descargar para leer sin conexión
MGM MIRAGE AND SUBSIDIARIES
                            SUPPLEMENTAL DATA - NET REVENUES BY RESORT - LAS VEGAS STRIP
                                                    (In thousands)
                                                      (Unaudited)
                                                      Three Months Ended               Twelve Months Ended
                                                 December 31,    December 31,     December 31,     December 31,
                                                     2008            2007             2008             2007
Bellagio                                         $     291,665   $     333,300   $     1,266,252  $     1,305,072
MGM Grand Las Vegas                                    256,925         312,560         1,114,824        1,203,584
Mandalay Bay                                           192,387         239,354           900,306          966,034
The Mirage                                             149,508         190,508           720,682          809,450
Luxor                                                  100,435         111,247           405,277          451,760
Treasure Island                                         87,747         105,549           376,000          431,176
New York-New York                                       66,449          84,153           300,861          338,492
Excalibur                                               66,606          87,714           319,609          364,692
Monte Carlo                                             56,965          76,388           235,933          312,456
Circus Circus Las Vegas (1)                             50,920          67,792           249,339          291,077
                                                 $   1,319,607   $   1,608,565   $     5,889,083  $     6,473,793

                                          MGM MIRAGE AND SUBSIDIARIES
                               SUPPLEMENTAL DATA - HOTEL STATISTICS - LAS VEGAS STRIP
                                                    (Unaudited)
                                                      Three Months Ended               Twelve Months Ended
                                                 December 31,    December 31,     December 31,     December 31,
                                                     2008            2007             2008             2007
Bellagio
 Occupancy %                                             93.0%           93.6%             95.0%            95.9%
 Average daily rate (ADR)                                 $243            $271              $261             $265
 Revenue per available room (REVPAR)                      $226            $253              $248             $254
MGM Grand Las Vegas
 Occupancy %                                             89.4%           93.6%             95.5%            96.2%
 ADR                                                      $131            $157              $147             $163
 REVPAR                                                   $117            $147              $141             $157
Mandalay Bay
 Occupancy %                                             79.2%           88.1%             90.2%            93.6%
 ADR                                                      $199            $222              $214             $227
 REVPAR                                                   $158            $196              $193             $213
The Mirage
 Occupancy %                                             91.9%           95.1%             95.8%            97.4%
 ADR                                                      $145            $174              $163             $181
 REVPAR                                                   $133            $165              $156             $176
Luxor
 Occupancy %                                             85.4%           95.9%             94.6%            98.2%
 ADR                                                      $103            $130              $116             $132
 REVPAR                                                    $88            $125              $110             $130
Treasure Island
  Occupancy %                                            92.2%           96.3%             95.7%            98.0%
  ADR                                                     $119            $142              $133             $146
  REVPAR                                                  $110            $137              $127             $143
New York-New York
 Occupancy %                                             91.6%           96.6%             95.9%            97.7%
 ADR                                                      $114            $136              $128             $142
 REVPAR                                                   $104            $131              $123             $139
Excalibur
 Occupancy %                                             76.9%           91.0%             87.9%            94.9%
 ADR                                                       $80            $101               $90             $100
 REVPAR                                                    $61             $92               $79              $95
Monte Carlo
 Occupancy %                                             89.1%           94.9%             93.9%            96.9%
 ADR                                                       $96            $124              $109             $132
 REVPAR                                                    $85            $118              $103             $128
Circus Circus Las Vegas
 Occupancy %                                             71.6%           87.5%             84.0%            91.6%
 ADR                                                       $59             $70               $64              $71
 REVPAR                                                    $42             $61               $53              $65

(1) Includes Slots-A-Fun.


                                                     Page 1 of 4
MGM MIRAGE AND SUBSIDIARIES
                            SUPPLEMENTAL DATA - PROPERTY EBITDA BY RESORT - LAS VEGAS STRIP
                                                    (In thousands)
                                                      (Unaudited)

                                                       Three Months Ended                  Twelve Months Ended
                                                  December 31,     December 31,        December 31,    December 31,
                                                      2008             2007                2008            2007
Bellagio                                         $       77,264   $      111,387      $      391,170  $      433,640
MGM Grand Las Vegas                                      43,416          103,394             267,710         388,379
Mandalay Bay                                             43,875           69,401             246,930         280,808
The Mirage                                               15,277           48,277             162,029         232,715
Luxor                                                    28,047           40,163             128,058         170,581
Treasure Island                                          20,352           29,672             101,183         127,949
New York-New York                                        17,962           34,784             107,106         141,425
Excalibur                                                18,716           32,919             109,188         139,096
Monte Carlo                                                7,974          23,494              72,168         110,486
Circus Circus Las Vegas (1)                                7,567          16,474              56,146          80,804
CityCenter                                                   -            (8,031)                -           (54,285)
                                                 $      280,450   $      501,934      $    1,641,688  $    2,051,598


                                           MGM MIRAGE AND SUBSIDIARIES
                       DETAIL OF CERTAIN CHARGES AFFECTING PROPERTY EBITDA - LAS VEGAS STRIP
                                                   (In thousands)
                                                     (Unaudited)

                                          Three Months Ended December 31, 2008

                                                 Preopening and                           Property
                                                     start-up         Restructuring    transactions,
                                                    expenses             costs              net              Total
Bellagio                                         $            -      $           -    $           (81)   $         (81)
MGM Grand Las Vegas                                           -                  -              2,792            2,792
Mandalay Bay                                                    11               -                167              178
The Mirage                                                    -                  -              4,272            4,272
Luxor                                                         339                -                249              588
Treasure Island                                               -                  -                341              341
New York-New York                                               74               -              2,224            2,298
Excalibur                                                     -                  -                960              960
Monte Carlo                                                   -                  -              1,469            1,469
Circus Circus Las Vegas (1)                                   -                  -                (40)             (40)
CityCenter                                                    -                  -                -                -
                                                 $            424    $           -    $       12,353     $      12,777

                                          Three Months Ended December 31, 2007

                                                 Preopening and                           Property
                                                     start-up         Restructuring    transactions,
                                                    expenses             costs              net              Total
Bellagio                                         $            -      $           -    $         6,686    $       6,686
MGM Grand Las Vegas                                          (141)               -                  2              (139)
Mandalay Bay                                                  -                  -               (564)             (564)
The Mirage                                                    -                  -                 53                53
Luxor                                                           20               -              1,355            1,375
Treasure Island                                               -                  -                  9                 9
New York-New York                                               56               -                175               231
Excalibur                                                     -                  -                 18                18
Monte Carlo                                                   158                -                138               296
Circus Circus Las Vegas (1)                                   -                  -                 (2)               (2)
CityCenter                                                  2,740                -                788            3,528
                                                 $          2,833    $           -    $         8,658    $      11,491

(1) Includes Slots-A-Fun.


                                                       Page 2 of 4
MGM MIRAGE AND SUBSIDIARIES
                DETAIL OF CERTAIN CHARGES AFFECTING PROPERTY EBITDA - LAS VEGAS STRIP (continued)
                                                (In thousands)
                                                  (Unaudited)

                                       Twelve Months Ended December 31, 2008

                                                                                           Property
                                               Preopening and       Restructuring       transactions,
                                              start-up expenses        costs                 net              Total
Bellagio                                       $            -      $           -       $         1,130    $        1,130
MGM Grand Las Vegas                                         443                -                 2,639             3,082
Mandalay Bay                                                  11               -                 1,554             1,565
The Mirage                                                  242                -                 6,080             6,322
Luxor                                                     1,116                -                 2,999             4,115
Treasure Island                                             -                  -                 1,828             1,828
New York-New York                                           726                -                 3,627             4,353
Excalibur                                                   -                  -                   961               961
Monte Carlo                                                 -                    75             (7,544)           (7,469)
Circus Circus Las Vegas (1)                                 -                  254                   5               259
CityCenter                                                  -                  -                   -                 -
                                               $          2,538    $           329     $       13,279     $      16,146

                                       Twelve Months Ended December 31, 2007

                                                                                           Property
                                               Preopening and       Restructuring       transactions,
                                              start-up expenses     costs (credit)           net              Total
Bellagio                                       $            -      $           -       $         6,543    $       6,543
MGM Grand Las Vegas                                       1,130                -                 6,895            8,025
Mandalay Bay                                                -                  -                 8,598            8,598
The Mirage                                                  -                  -                 1,218            1,218
Luxor                                                         20               -                 3,247            3,267
Treasure Island                                             -                  -                   109              109
New York-New York                                           101                -                   477              578
Excalibur                                                   -                  -                   261              261
Monte Carlo                                               1,286                -                 1,117            2,403
Circus Circus Las Vegas (1)                                 -                  -                     5                5
CityCenter                                               21,541                -                   788           22,329
                                               $         24,078    $           -       $       29,258     $      53,336

                                        MGM MIRAGE AND SUBSIDIARIES
                            SUPPLEMENTAL DATA - RECONCILIATION OF OPERATING INCOME
                                    TO PROPERTY EBITDA - LAS VEGAS STRIP
                                                 (In thousands)
                                                  (Unaudited)

                                       Three Months Ended December 31, 2008

                                                                       Depreciation
                                              Operating income             and
                                                   (loss)              amortization        EBITDA

Bellagio                                      $         47,380     $          29,884   $       77,264
MGM Grand Las Vegas                                     19,181                24,235           43,416
Mandalay Bay                                            18,694                25,181           43,875
The Mirage                                              (1,115)               16,392           15,277
Luxor                                                   18,012                10,035           28,047
Treasure Island                                         12,984                 7,368           20,352
New York-New York                                       10,353                 7,609           17,962
Excalibur                                               12,149                 6,567           18,716
Monte Carlo                                              2,104                 5,870            7,974
Circus Circus Las Vegas (1)                              1,717                 5,850            7,567
CityCenter                                                 -                     -                -
                                              $        141,459     $         138,991   $      280,450


(1) Includes Slots-A-Fun.


                                                     Page 3 of 4
MGM MIRAGE AND SUBSIDIARIES
                            SUPPLEMENTAL DATA - RECONCILIATION OF OPERATING INCOME
                                    TO PROPERTY EBITDA - LAS VEGAS STRIP
                                                 (In thousands)
                                                  (Unaudited)

                                      Three Months Ended December 31, 2007

                                                                      Depreciation
                                             Operating income             and
                                                  (loss)              amortization        EBITDA

Bellagio                                      $        77,575     $          33,812   $     111,387
MGM Grand Las Vegas                                    78,027                25,367         103,394
Mandalay Bay                                           43,839                25,562          69,401
The Mirage                                             32,424                15,853          48,277
Luxor                                                  30,966                 9,197          40,163
Treasure Island                                        21,033                 8,639          29,672
New York-New York                                      24,371                10,413          34,784
Excalibur                                              27,404                 5,515          32,919
Monte Carlo                                            17,228                 6,266          23,494
Circus Circus Las Vegas (1)                            11,133                 5,341          16,474
CityCenter                                             (8,738)                  707          (8,031)
                                              $       355,262     $         146,672   $     501,934

                                      Twelve Months Ended December 31, 2008

                                                                      Depreciation
                                             Operating income             and
                                                  (loss)              amortization        EBITDA

Bellagio                                      $       257,415     $         133,755   $      391,170
MGM Grand Las Vegas                                   170,049                97,661          267,710
Mandalay Bay                                          145,005               101,925          246,930
The Mirage                                             99,061                62,968          162,029
Luxor                                                  84,948                43,110          128,058
Treasure Island                                        63,454                37,729          101,183
New York-New York                                      74,276                32,830          107,106
Excalibur                                              83,953                25,235          109,188
Monte Carlo                                            46,788                25,380           72,168
Circus Circus Las Vegas (1)                            33,745                22,401           56,146
CityCenter                                                -                     -                -
                                              $     1,058,694     $         582,994   $    1,641,688

                                      Twelve Months Ended December 31, 2007

                                                                      Depreciation
                                             Operating income             and
                                                  (loss)              amortization        EBITDA

Bellagio                                      $       306,916     $         126,724   $      433,640
MGM Grand Las Vegas                                   289,849                98,530          388,379
Mandalay Bay                                          188,996                91,812          280,808
The Mirage                                            172,779                59,936          232,715
Luxor                                                 132,418                38,163          170,581
Treasure Island                                        95,820                32,129          127,949
New York-New York                                     108,099                33,326          141,425
Excalibur                                             117,123                21,973          139,096
Monte Carlo                                            87,655                22,831          110,486
Circus Circus Las Vegas (1)                            59,868                20,936           80,804
CityCenter                                            (57,367)                3,082          (54,285)
                                              $     1,502,156     $         549,442   $    2,051,598
(1) Includes Slots-A-Fun.


                                                    Page 4 of 4

Más contenido relacionado

Destacado

energy future holindings StatisticalSummary2004
energy future holindings StatisticalSummary2004energy future holindings StatisticalSummary2004
energy future holindings StatisticalSummary2004finance29
 
MGMM IaCInfo
MGMM  IaCInfoMGMM  IaCInfo
MGMM IaCInfofinance29
 
energy future holindings TXU_Q2_03
energy future holindings  TXU_Q2_03energy future holindings  TXU_Q2_03
energy future holindings TXU_Q2_03finance29
 
calpine 10K_2006
calpine 10K_2006calpine 10K_2006
calpine 10K_2006finance29
 
MGM_MIRAGE_2004_AR
MGM_MIRAGE_2004_ARMGM_MIRAGE_2004_AR
MGM_MIRAGE_2004_ARfinance29
 
energy future holindings _062705
energy future holindings _062705energy future holindings _062705
energy future holindings _062705finance29
 
energy future holindings Q3_08_Investor_Call_Deck_FINAL
energy future holindings Q3_08_Investor_Call_Deck_FINALenergy future holindings Q3_08_Investor_Call_Deck_FINAL
energy future holindings Q3_08_Investor_Call_Deck_FINALfinance29
 

Destacado (7)

energy future holindings StatisticalSummary2004
energy future holindings StatisticalSummary2004energy future holindings StatisticalSummary2004
energy future holindings StatisticalSummary2004
 
MGMM IaCInfo
MGMM  IaCInfoMGMM  IaCInfo
MGMM IaCInfo
 
energy future holindings TXU_Q2_03
energy future holindings  TXU_Q2_03energy future holindings  TXU_Q2_03
energy future holindings TXU_Q2_03
 
calpine 10K_2006
calpine 10K_2006calpine 10K_2006
calpine 10K_2006
 
MGM_MIRAGE_2004_AR
MGM_MIRAGE_2004_ARMGM_MIRAGE_2004_AR
MGM_MIRAGE_2004_AR
 
energy future holindings _062705
energy future holindings _062705energy future holindings _062705
energy future holindings _062705
 
energy future holindings Q3_08_Investor_Call_Deck_FINAL
energy future holindings Q3_08_Investor_Call_Deck_FINALenergy future holindings Q3_08_Investor_Call_Deck_FINAL
energy future holindings Q3_08_Investor_Call_Deck_FINAL
 

Similar a MGM MIRAGE 1CB229D5-2D26-42C4-8A2E-884E067537F4_ERsupplemental

Similar a MGM MIRAGE 1CB229D5-2D26-42C4-8A2E-884E067537F4_ERsupplemental (15)

MGM MIRAGE SuppData080207
MGM MIRAGE  SuppData080207MGM MIRAGE  SuppData080207
MGM MIRAGE SuppData080207
 
Exame AnaíS
Exame AnaíSExame AnaíS
Exame AnaíS
 
Hawaii Towns Median Rent
Hawaii Towns Median RentHawaii Towns Median Rent
Hawaii Towns Median Rent
 
Plymouth Michigan Real Estate Statistics | May 2010
Plymouth Michigan Real Estate Statistics | May 2010Plymouth Michigan Real Estate Statistics | May 2010
Plymouth Michigan Real Estate Statistics | May 2010
 
Examen Tics
Examen TicsExamen Tics
Examen Tics
 
Finance Stocks And Bonds (Portfolio)
Finance Stocks And Bonds (Portfolio)Finance Stocks And Bonds (Portfolio)
Finance Stocks And Bonds (Portfolio)
 
Monthly Market Watch - September 2012
Monthly Market Watch - September 2012Monthly Market Watch - September 2012
Monthly Market Watch - September 2012
 
Chap 2 lab 2(lord durana) sheet1
Chap 2 lab 2(lord durana) sheet1Chap 2 lab 2(lord durana) sheet1
Chap 2 lab 2(lord durana) sheet1
 
Piab marzo
Piab marzoPiab marzo
Piab marzo
 
Money
MoneyMoney
Money
 
southwest airline ar97
southwest airline ar97southwest airline ar97
southwest airline ar97
 
MGM MIRAGE MandalayHist
MGM MIRAGE  MandalayHistMGM MIRAGE  MandalayHist
MGM MIRAGE MandalayHist
 
DENVER MARKET WATCH YEAR END 2009
DENVER MARKET WATCH YEAR END 2009DENVER MARKET WATCH YEAR END 2009
DENVER MARKET WATCH YEAR END 2009
 
Dagoc chap2 lab2
Dagoc chap2 lab2Dagoc chap2 lab2
Dagoc chap2 lab2
 
Burlat chap2 lab2
Burlat chap2 lab2Burlat chap2 lab2
Burlat chap2 lab2
 

Más de finance29

Chesapeake Latest_IR_Presentation
Chesapeake Latest_IR_PresentationChesapeake Latest_IR_Presentation
Chesapeake Latest_IR_Presentationfinance29
 
ChesapeakeEnergy07ARFINAL
ChesapeakeEnergy07ARFINALChesapeakeEnergy07ARFINAL
ChesapeakeEnergy07ARFINALfinance29
 
ChesapeakeEnergy07ARFINAL
ChesapeakeEnergy07ARFINALChesapeakeEnergy07ARFINAL
ChesapeakeEnergy07ARFINALfinance29
 
Chesapeake Latest_IR_Presentation
Chesapeake Latest_IR_PresentationChesapeake Latest_IR_Presentation
Chesapeake Latest_IR_Presentationfinance29
 
Chesapeake Latest_IR_Presentation
Chesapeake Latest_IR_PresentationChesapeake Latest_IR_Presentation
Chesapeake Latest_IR_Presentationfinance29
 
ChesapeakeEnergy07ARFINAL
ChesapeakeEnergy07ARFINALChesapeakeEnergy07ARFINAL
ChesapeakeEnergy07ARFINALfinance29
 
Chesapeake Energy07ARFINAL
Chesapeake Energy07ARFINALChesapeake Energy07ARFINAL
Chesapeake Energy07ARFINALfinance29
 
Chesapeake Latest_IR_Presentation
Chesapeake Latest_IR_PresentationChesapeake Latest_IR_Presentation
Chesapeake Latest_IR_Presentationfinance29
 
MGM 93005SuppDataMandalayHistorical
MGM 93005SuppDataMandalayHistoricalMGM 93005SuppDataMandalayHistorical
MGM 93005SuppDataMandalayHistoricalfinance29
 
MGMMIRAGE 93005SuppDataProForma
MGMMIRAGE 93005SuppDataProFormaMGMMIRAGE 93005SuppDataProForma
MGMMIRAGE 93005SuppDataProFormafinance29
 
MGMMIRAGE 93005SuppDataActual
MGMMIRAGE 93005SuppDataActualMGMMIRAGE 93005SuppDataActual
MGMMIRAGE 93005SuppDataActualfinance29
 
MGM MIRAGE Mandalayhist_022306
MGM MIRAGE  Mandalayhist_022306MGM MIRAGE  Mandalayhist_022306
MGM MIRAGE Mandalayhist_022306finance29
 
MGM MIRAGE SuppActual_022306
MGM MIRAGE  SuppActual_022306MGM MIRAGE  SuppActual_022306
MGM MIRAGE SuppActual_022306finance29
 
MGM MIRAGE SuppProForma_022306
MGM MIRAGE  SuppProForma_022306MGM MIRAGE  SuppProForma_022306
MGM MIRAGE SuppProForma_022306finance29
 
MGM Mandalay
MGM MandalayMGM Mandalay
MGM Mandalayfinance29
 
MGM ProForma
MGM ProFormaMGM ProForma
MGM ProFormafinance29
 
MGM AnnualReport2003
MGM AnnualReport2003MGM AnnualReport2003
MGM AnnualReport2003finance29
 
MGMM IaCInfo00
MGMM  IaCInfo00MGMM  IaCInfo00
MGMM IaCInfo00finance29
 
MGMM FinNote00
MGMM  FinNote00MGMM  FinNote00
MGMM FinNote00finance29
 

Más de finance29 (20)

Chesapeake Latest_IR_Presentation
Chesapeake Latest_IR_PresentationChesapeake Latest_IR_Presentation
Chesapeake Latest_IR_Presentation
 
ChesapeakeEnergy07ARFINAL
ChesapeakeEnergy07ARFINALChesapeakeEnergy07ARFINAL
ChesapeakeEnergy07ARFINAL
 
ChesapeakeEnergy07ARFINAL
ChesapeakeEnergy07ARFINALChesapeakeEnergy07ARFINAL
ChesapeakeEnergy07ARFINAL
 
Chesapeake Latest_IR_Presentation
Chesapeake Latest_IR_PresentationChesapeake Latest_IR_Presentation
Chesapeake Latest_IR_Presentation
 
Chesapeake Latest_IR_Presentation
Chesapeake Latest_IR_PresentationChesapeake Latest_IR_Presentation
Chesapeake Latest_IR_Presentation
 
ChesapeakeEnergy07ARFINAL
ChesapeakeEnergy07ARFINALChesapeakeEnergy07ARFINAL
ChesapeakeEnergy07ARFINAL
 
Chesapeake Energy07ARFINAL
Chesapeake Energy07ARFINALChesapeake Energy07ARFINAL
Chesapeake Energy07ARFINAL
 
Chesapeake Latest_IR_Presentation
Chesapeake Latest_IR_PresentationChesapeake Latest_IR_Presentation
Chesapeake Latest_IR_Presentation
 
MGM 93005SuppDataMandalayHistorical
MGM 93005SuppDataMandalayHistoricalMGM 93005SuppDataMandalayHistorical
MGM 93005SuppDataMandalayHistorical
 
MGMMIRAGE 93005SuppDataProForma
MGMMIRAGE 93005SuppDataProFormaMGMMIRAGE 93005SuppDataProForma
MGMMIRAGE 93005SuppDataProForma
 
MGMMIRAGE 93005SuppDataActual
MGMMIRAGE 93005SuppDataActualMGMMIRAGE 93005SuppDataActual
MGMMIRAGE 93005SuppDataActual
 
MGM MIRAGE Mandalayhist_022306
MGM MIRAGE  Mandalayhist_022306MGM MIRAGE  Mandalayhist_022306
MGM MIRAGE Mandalayhist_022306
 
MGM MIRAGE SuppActual_022306
MGM MIRAGE  SuppActual_022306MGM MIRAGE  SuppActual_022306
MGM MIRAGE SuppActual_022306
 
MGM MIRAGE SuppProForma_022306
MGM MIRAGE  SuppProForma_022306MGM MIRAGE  SuppProForma_022306
MGM MIRAGE SuppProForma_022306
 
MGM Mandalay
MGM MandalayMGM Mandalay
MGM Mandalay
 
MGM ProForma
MGM ProFormaMGM ProForma
MGM ProForma
 
MGM Supp
MGM SuppMGM Supp
MGM Supp
 
MGM AnnualReport2003
MGM AnnualReport2003MGM AnnualReport2003
MGM AnnualReport2003
 
MGMM IaCInfo00
MGMM  IaCInfo00MGMM  IaCInfo00
MGMM IaCInfo00
 
MGMM FinNote00
MGMM  FinNote00MGMM  FinNote00
MGMM FinNote00
 

Último

212MTAMount Durham University Bachelor's Diploma in Technology
212MTAMount Durham University Bachelor's Diploma in Technology212MTAMount Durham University Bachelor's Diploma in Technology
212MTAMount Durham University Bachelor's Diploma in Technologyz xss
 
Governor Olli Rehn: Dialling back monetary restraint
Governor Olli Rehn: Dialling back monetary restraintGovernor Olli Rehn: Dialling back monetary restraint
Governor Olli Rehn: Dialling back monetary restraintSuomen Pankki
 
Unveiling Business Expansion Trends in 2024
Unveiling Business Expansion Trends in 2024Unveiling Business Expansion Trends in 2024
Unveiling Business Expansion Trends in 2024Champak Jhagmag
 
NO1 Certified kala jadu karne wale ka contact number kala jadu karne wale bab...
NO1 Certified kala jadu karne wale ka contact number kala jadu karne wale bab...NO1 Certified kala jadu karne wale ka contact number kala jadu karne wale bab...
NO1 Certified kala jadu karne wale ka contact number kala jadu karne wale bab...Amil baba
 
House of Commons ; CDC schemes overview document
House of Commons ; CDC schemes overview documentHouse of Commons ; CDC schemes overview document
House of Commons ; CDC schemes overview documentHenry Tapper
 
Role of Information and technology in banking and finance .pptx
Role of Information and technology in banking and finance .pptxRole of Information and technology in banking and finance .pptx
Role of Information and technology in banking and finance .pptxNarayaniTripathi2
 
原版1:1复刻堪萨斯大学毕业证KU毕业证留信学历认证
原版1:1复刻堪萨斯大学毕业证KU毕业证留信学历认证原版1:1复刻堪萨斯大学毕业证KU毕业证留信学历认证
原版1:1复刻堪萨斯大学毕业证KU毕业证留信学历认证jdkhjh
 
2024 Q1 Crypto Industry Report | CoinGecko
2024 Q1 Crypto Industry Report | CoinGecko2024 Q1 Crypto Industry Report | CoinGecko
2024 Q1 Crypto Industry Report | CoinGeckoCoinGecko
 
『澳洲文凭』买科廷大学毕业证书成绩单办理澳洲Curtin文凭学位证书
『澳洲文凭』买科廷大学毕业证书成绩单办理澳洲Curtin文凭学位证书『澳洲文凭』买科廷大学毕业证书成绩单办理澳洲Curtin文凭学位证书
『澳洲文凭』买科廷大学毕业证书成绩单办理澳洲Curtin文凭学位证书rnrncn29
 
Call Girls Near Delhi Pride Hotel, New Delhi|9873777170
Call Girls Near Delhi Pride Hotel, New Delhi|9873777170Call Girls Near Delhi Pride Hotel, New Delhi|9873777170
Call Girls Near Delhi Pride Hotel, New Delhi|9873777170Sonam Pathan
 
Stock Market Brief Deck for "this does not happen often".pdf
Stock Market Brief Deck for "this does not happen often".pdfStock Market Brief Deck for "this does not happen often".pdf
Stock Market Brief Deck for "this does not happen often".pdfMichael Silva
 
Financial analysis on Risk and Return.ppt
Financial analysis on Risk and Return.pptFinancial analysis on Risk and Return.ppt
Financial analysis on Risk and Return.ppttadegebreyesus
 
(办理原版一样)QUT毕业证昆士兰科技大学毕业证学位证留信学历认证成绩单补办
(办理原版一样)QUT毕业证昆士兰科技大学毕业证学位证留信学历认证成绩单补办(办理原版一样)QUT毕业证昆士兰科技大学毕业证学位证留信学历认证成绩单补办
(办理原版一样)QUT毕业证昆士兰科技大学毕业证学位证留信学历认证成绩单补办fqiuho152
 
The Core Functions of the Bangko Sentral ng Pilipinas
The Core Functions of the Bangko Sentral ng PilipinasThe Core Functions of the Bangko Sentral ng Pilipinas
The Core Functions of the Bangko Sentral ng PilipinasCherylouCamus
 
Tenets of Physiocracy History of Economic
Tenets of Physiocracy History of EconomicTenets of Physiocracy History of Economic
Tenets of Physiocracy History of Economiccinemoviesu
 
magnetic-pensions-a-new-blueprint-for-the-dc-landscape.pdf
magnetic-pensions-a-new-blueprint-for-the-dc-landscape.pdfmagnetic-pensions-a-new-blueprint-for-the-dc-landscape.pdf
magnetic-pensions-a-new-blueprint-for-the-dc-landscape.pdfHenry Tapper
 
NO1 Certified Black Magic Specialist Expert In Bahawalpur, Sargodha, Sialkot,...
NO1 Certified Black Magic Specialist Expert In Bahawalpur, Sargodha, Sialkot,...NO1 Certified Black Magic Specialist Expert In Bahawalpur, Sargodha, Sialkot,...
NO1 Certified Black Magic Specialist Expert In Bahawalpur, Sargodha, Sialkot,...Amil baba
 
Managing Finances in a Small Business (yes).pdf
Managing Finances  in a Small Business (yes).pdfManaging Finances  in a Small Business (yes).pdf
Managing Finances in a Small Business (yes).pdfmar yame
 
cost of capital questions financial management
cost of capital questions financial managementcost of capital questions financial management
cost of capital questions financial managementtanmayarora23
 
Uae-NO1 Kala Jadu specialist Expert in Pakistan kala ilam specialist Expert i...
Uae-NO1 Kala Jadu specialist Expert in Pakistan kala ilam specialist Expert i...Uae-NO1 Kala Jadu specialist Expert in Pakistan kala ilam specialist Expert i...
Uae-NO1 Kala Jadu specialist Expert in Pakistan kala ilam specialist Expert i...Amil baba
 

Último (20)

212MTAMount Durham University Bachelor's Diploma in Technology
212MTAMount Durham University Bachelor's Diploma in Technology212MTAMount Durham University Bachelor's Diploma in Technology
212MTAMount Durham University Bachelor's Diploma in Technology
 
Governor Olli Rehn: Dialling back monetary restraint
Governor Olli Rehn: Dialling back monetary restraintGovernor Olli Rehn: Dialling back monetary restraint
Governor Olli Rehn: Dialling back monetary restraint
 
Unveiling Business Expansion Trends in 2024
Unveiling Business Expansion Trends in 2024Unveiling Business Expansion Trends in 2024
Unveiling Business Expansion Trends in 2024
 
NO1 Certified kala jadu karne wale ka contact number kala jadu karne wale bab...
NO1 Certified kala jadu karne wale ka contact number kala jadu karne wale bab...NO1 Certified kala jadu karne wale ka contact number kala jadu karne wale bab...
NO1 Certified kala jadu karne wale ka contact number kala jadu karne wale bab...
 
House of Commons ; CDC schemes overview document
House of Commons ; CDC schemes overview documentHouse of Commons ; CDC schemes overview document
House of Commons ; CDC schemes overview document
 
Role of Information and technology in banking and finance .pptx
Role of Information and technology in banking and finance .pptxRole of Information and technology in banking and finance .pptx
Role of Information and technology in banking and finance .pptx
 
原版1:1复刻堪萨斯大学毕业证KU毕业证留信学历认证
原版1:1复刻堪萨斯大学毕业证KU毕业证留信学历认证原版1:1复刻堪萨斯大学毕业证KU毕业证留信学历认证
原版1:1复刻堪萨斯大学毕业证KU毕业证留信学历认证
 
2024 Q1 Crypto Industry Report | CoinGecko
2024 Q1 Crypto Industry Report | CoinGecko2024 Q1 Crypto Industry Report | CoinGecko
2024 Q1 Crypto Industry Report | CoinGecko
 
『澳洲文凭』买科廷大学毕业证书成绩单办理澳洲Curtin文凭学位证书
『澳洲文凭』买科廷大学毕业证书成绩单办理澳洲Curtin文凭学位证书『澳洲文凭』买科廷大学毕业证书成绩单办理澳洲Curtin文凭学位证书
『澳洲文凭』买科廷大学毕业证书成绩单办理澳洲Curtin文凭学位证书
 
Call Girls Near Delhi Pride Hotel, New Delhi|9873777170
Call Girls Near Delhi Pride Hotel, New Delhi|9873777170Call Girls Near Delhi Pride Hotel, New Delhi|9873777170
Call Girls Near Delhi Pride Hotel, New Delhi|9873777170
 
Stock Market Brief Deck for "this does not happen often".pdf
Stock Market Brief Deck for "this does not happen often".pdfStock Market Brief Deck for "this does not happen often".pdf
Stock Market Brief Deck for "this does not happen often".pdf
 
Financial analysis on Risk and Return.ppt
Financial analysis on Risk and Return.pptFinancial analysis on Risk and Return.ppt
Financial analysis on Risk and Return.ppt
 
(办理原版一样)QUT毕业证昆士兰科技大学毕业证学位证留信学历认证成绩单补办
(办理原版一样)QUT毕业证昆士兰科技大学毕业证学位证留信学历认证成绩单补办(办理原版一样)QUT毕业证昆士兰科技大学毕业证学位证留信学历认证成绩单补办
(办理原版一样)QUT毕业证昆士兰科技大学毕业证学位证留信学历认证成绩单补办
 
The Core Functions of the Bangko Sentral ng Pilipinas
The Core Functions of the Bangko Sentral ng PilipinasThe Core Functions of the Bangko Sentral ng Pilipinas
The Core Functions of the Bangko Sentral ng Pilipinas
 
Tenets of Physiocracy History of Economic
Tenets of Physiocracy History of EconomicTenets of Physiocracy History of Economic
Tenets of Physiocracy History of Economic
 
magnetic-pensions-a-new-blueprint-for-the-dc-landscape.pdf
magnetic-pensions-a-new-blueprint-for-the-dc-landscape.pdfmagnetic-pensions-a-new-blueprint-for-the-dc-landscape.pdf
magnetic-pensions-a-new-blueprint-for-the-dc-landscape.pdf
 
NO1 Certified Black Magic Specialist Expert In Bahawalpur, Sargodha, Sialkot,...
NO1 Certified Black Magic Specialist Expert In Bahawalpur, Sargodha, Sialkot,...NO1 Certified Black Magic Specialist Expert In Bahawalpur, Sargodha, Sialkot,...
NO1 Certified Black Magic Specialist Expert In Bahawalpur, Sargodha, Sialkot,...
 
Managing Finances in a Small Business (yes).pdf
Managing Finances  in a Small Business (yes).pdfManaging Finances  in a Small Business (yes).pdf
Managing Finances in a Small Business (yes).pdf
 
cost of capital questions financial management
cost of capital questions financial managementcost of capital questions financial management
cost of capital questions financial management
 
Uae-NO1 Kala Jadu specialist Expert in Pakistan kala ilam specialist Expert i...
Uae-NO1 Kala Jadu specialist Expert in Pakistan kala ilam specialist Expert i...Uae-NO1 Kala Jadu specialist Expert in Pakistan kala ilam specialist Expert i...
Uae-NO1 Kala Jadu specialist Expert in Pakistan kala ilam specialist Expert i...
 

MGM MIRAGE 1CB229D5-2D26-42C4-8A2E-884E067537F4_ERsupplemental

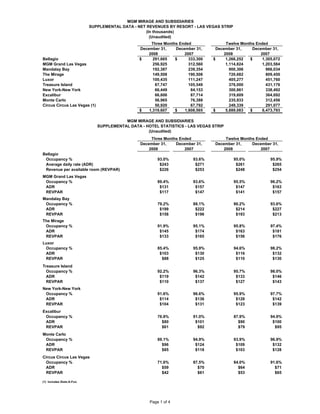
  • 1. MGM MIRAGE AND SUBSIDIARIES SUPPLEMENTAL DATA - NET REVENUES BY RESORT - LAS VEGAS STRIP (In thousands) (Unaudited) Three Months Ended Twelve Months Ended December 31, December 31, December 31, December 31, 2008 2007 2008 2007 Bellagio $ 291,665 $ 333,300 $ 1,266,252 $ 1,305,072 MGM Grand Las Vegas 256,925 312,560 1,114,824 1,203,584 Mandalay Bay 192,387 239,354 900,306 966,034 The Mirage 149,508 190,508 720,682 809,450 Luxor 100,435 111,247 405,277 451,760 Treasure Island 87,747 105,549 376,000 431,176 New York-New York 66,449 84,153 300,861 338,492 Excalibur 66,606 87,714 319,609 364,692 Monte Carlo 56,965 76,388 235,933 312,456 Circus Circus Las Vegas (1) 50,920 67,792 249,339 291,077 $ 1,319,607 $ 1,608,565 $ 5,889,083 $ 6,473,793 MGM MIRAGE AND SUBSIDIARIES SUPPLEMENTAL DATA - HOTEL STATISTICS - LAS VEGAS STRIP (Unaudited) Three Months Ended Twelve Months Ended December 31, December 31, December 31, December 31, 2008 2007 2008 2007 Bellagio Occupancy % 93.0% 93.6% 95.0% 95.9% Average daily rate (ADR) $243 $271 $261 $265 Revenue per available room (REVPAR) $226 $253 $248 $254 MGM Grand Las Vegas Occupancy % 89.4% 93.6% 95.5% 96.2% ADR $131 $157 $147 $163 REVPAR $117 $147 $141 $157 Mandalay Bay Occupancy % 79.2% 88.1% 90.2% 93.6% ADR $199 $222 $214 $227 REVPAR $158 $196 $193 $213 The Mirage Occupancy % 91.9% 95.1% 95.8% 97.4% ADR $145 $174 $163 $181 REVPAR $133 $165 $156 $176 Luxor Occupancy % 85.4% 95.9% 94.6% 98.2% ADR $103 $130 $116 $132 REVPAR $88 $125 $110 $130 Treasure Island Occupancy % 92.2% 96.3% 95.7% 98.0% ADR $119 $142 $133 $146 REVPAR $110 $137 $127 $143 New York-New York Occupancy % 91.6% 96.6% 95.9% 97.7% ADR $114 $136 $128 $142 REVPAR $104 $131 $123 $139 Excalibur Occupancy % 76.9% 91.0% 87.9% 94.9% ADR $80 $101 $90 $100 REVPAR $61 $92 $79 $95 Monte Carlo Occupancy % 89.1% 94.9% 93.9% 96.9% ADR $96 $124 $109 $132 REVPAR $85 $118 $103 $128 Circus Circus Las Vegas Occupancy % 71.6% 87.5% 84.0% 91.6% ADR $59 $70 $64 $71 REVPAR $42 $61 $53 $65 (1) Includes Slots-A-Fun. Page 1 of 4
  • 2. MGM MIRAGE AND SUBSIDIARIES SUPPLEMENTAL DATA - PROPERTY EBITDA BY RESORT - LAS VEGAS STRIP (In thousands) (Unaudited) Three Months Ended Twelve Months Ended December 31, December 31, December 31, December 31, 2008 2007 2008 2007 Bellagio $ 77,264 $ 111,387 $ 391,170 $ 433,640 MGM Grand Las Vegas 43,416 103,394 267,710 388,379 Mandalay Bay 43,875 69,401 246,930 280,808 The Mirage 15,277 48,277 162,029 232,715 Luxor 28,047 40,163 128,058 170,581 Treasure Island 20,352 29,672 101,183 127,949 New York-New York 17,962 34,784 107,106 141,425 Excalibur 18,716 32,919 109,188 139,096 Monte Carlo 7,974 23,494 72,168 110,486 Circus Circus Las Vegas (1) 7,567 16,474 56,146 80,804 CityCenter - (8,031) - (54,285) $ 280,450 $ 501,934 $ 1,641,688 $ 2,051,598 MGM MIRAGE AND SUBSIDIARIES DETAIL OF CERTAIN CHARGES AFFECTING PROPERTY EBITDA - LAS VEGAS STRIP (In thousands) (Unaudited) Three Months Ended December 31, 2008 Preopening and Property start-up Restructuring transactions, expenses costs net Total Bellagio $ - $ - $ (81) $ (81) MGM Grand Las Vegas - - 2,792 2,792 Mandalay Bay 11 - 167 178 The Mirage - - 4,272 4,272 Luxor 339 - 249 588 Treasure Island - - 341 341 New York-New York 74 - 2,224 2,298 Excalibur - - 960 960 Monte Carlo - - 1,469 1,469 Circus Circus Las Vegas (1) - - (40) (40) CityCenter - - - - $ 424 $ - $ 12,353 $ 12,777 Three Months Ended December 31, 2007 Preopening and Property start-up Restructuring transactions, expenses costs net Total Bellagio $ - $ - $ 6,686 $ 6,686 MGM Grand Las Vegas (141) - 2 (139) Mandalay Bay - - (564) (564) The Mirage - - 53 53 Luxor 20 - 1,355 1,375 Treasure Island - - 9 9 New York-New York 56 - 175 231 Excalibur - - 18 18 Monte Carlo 158 - 138 296 Circus Circus Las Vegas (1) - - (2) (2) CityCenter 2,740 - 788 3,528 $ 2,833 $ - $ 8,658 $ 11,491 (1) Includes Slots-A-Fun. Page 2 of 4
  • 3. MGM MIRAGE AND SUBSIDIARIES DETAIL OF CERTAIN CHARGES AFFECTING PROPERTY EBITDA - LAS VEGAS STRIP (continued) (In thousands) (Unaudited) Twelve Months Ended December 31, 2008 Property Preopening and Restructuring transactions, start-up expenses costs net Total Bellagio $ - $ - $ 1,130 $ 1,130 MGM Grand Las Vegas 443 - 2,639 3,082 Mandalay Bay 11 - 1,554 1,565 The Mirage 242 - 6,080 6,322 Luxor 1,116 - 2,999 4,115 Treasure Island - - 1,828 1,828 New York-New York 726 - 3,627 4,353 Excalibur - - 961 961 Monte Carlo - 75 (7,544) (7,469) Circus Circus Las Vegas (1) - 254 5 259 CityCenter - - - - $ 2,538 $ 329 $ 13,279 $ 16,146 Twelve Months Ended December 31, 2007 Property Preopening and Restructuring transactions, start-up expenses costs (credit) net Total Bellagio $ - $ - $ 6,543 $ 6,543 MGM Grand Las Vegas 1,130 - 6,895 8,025 Mandalay Bay - - 8,598 8,598 The Mirage - - 1,218 1,218 Luxor 20 - 3,247 3,267 Treasure Island - - 109 109 New York-New York 101 - 477 578 Excalibur - - 261 261 Monte Carlo 1,286 - 1,117 2,403 Circus Circus Las Vegas (1) - - 5 5 CityCenter 21,541 - 788 22,329 $ 24,078 $ - $ 29,258 $ 53,336 MGM MIRAGE AND SUBSIDIARIES SUPPLEMENTAL DATA - RECONCILIATION OF OPERATING INCOME TO PROPERTY EBITDA - LAS VEGAS STRIP (In thousands) (Unaudited) Three Months Ended December 31, 2008 Depreciation Operating income and (loss) amortization EBITDA Bellagio $ 47,380 $ 29,884 $ 77,264 MGM Grand Las Vegas 19,181 24,235 43,416 Mandalay Bay 18,694 25,181 43,875 The Mirage (1,115) 16,392 15,277 Luxor 18,012 10,035 28,047 Treasure Island 12,984 7,368 20,352 New York-New York 10,353 7,609 17,962 Excalibur 12,149 6,567 18,716 Monte Carlo 2,104 5,870 7,974 Circus Circus Las Vegas (1) 1,717 5,850 7,567 CityCenter - - - $ 141,459 $ 138,991 $ 280,450 (1) Includes Slots-A-Fun. Page 3 of 4
  • 4. MGM MIRAGE AND SUBSIDIARIES SUPPLEMENTAL DATA - RECONCILIATION OF OPERATING INCOME TO PROPERTY EBITDA - LAS VEGAS STRIP (In thousands) (Unaudited) Three Months Ended December 31, 2007 Depreciation Operating income and (loss) amortization EBITDA Bellagio $ 77,575 $ 33,812 $ 111,387 MGM Grand Las Vegas 78,027 25,367 103,394 Mandalay Bay 43,839 25,562 69,401 The Mirage 32,424 15,853 48,277 Luxor 30,966 9,197 40,163 Treasure Island 21,033 8,639 29,672 New York-New York 24,371 10,413 34,784 Excalibur 27,404 5,515 32,919 Monte Carlo 17,228 6,266 23,494 Circus Circus Las Vegas (1) 11,133 5,341 16,474 CityCenter (8,738) 707 (8,031) $ 355,262 $ 146,672 $ 501,934 Twelve Months Ended December 31, 2008 Depreciation Operating income and (loss) amortization EBITDA Bellagio $ 257,415 $ 133,755 $ 391,170 MGM Grand Las Vegas 170,049 97,661 267,710 Mandalay Bay 145,005 101,925 246,930 The Mirage 99,061 62,968 162,029 Luxor 84,948 43,110 128,058 Treasure Island 63,454 37,729 101,183 New York-New York 74,276 32,830 107,106 Excalibur 83,953 25,235 109,188 Monte Carlo 46,788 25,380 72,168 Circus Circus Las Vegas (1) 33,745 22,401 56,146 CityCenter - - - $ 1,058,694 $ 582,994 $ 1,641,688 Twelve Months Ended December 31, 2007 Depreciation Operating income and (loss) amortization EBITDA Bellagio $ 306,916 $ 126,724 $ 433,640 MGM Grand Las Vegas 289,849 98,530 388,379 Mandalay Bay 188,996 91,812 280,808 The Mirage 172,779 59,936 232,715 Luxor 132,418 38,163 170,581 Treasure Island 95,820 32,129 127,949 New York-New York 108,099 33,326 141,425 Excalibur 117,123 21,973 139,096 Monte Carlo 87,655 22,831 110,486 Circus Circus Las Vegas (1) 59,868 20,936 80,804 CityCenter (57,367) 3,082 (54,285) $ 1,502,156 $ 549,442 $ 2,051,598 (1) Includes Slots-A-Fun. Page 4 of 4