2. The CarMax Advantage ®
1 2 3 4 5 6
COMPELLING SKILLED, UNIQUE PROPRIETARY STRONG SOLID GROWTH
MARKET DEDICATED CONSUMER PROCESSES AND RESULTS OPPORTUNITY
PEOPLE OFFER SYSTEMS
■ ■ ■ ■ ■ ■
Huge Training and Low, No-Haggle Information Systems Revenues Growth Plan
Development Prices
■ ■ ■ ■
Stable Purchasing Earnings Defensible Competitive
■ ■
Above & Beyond Broad Selection and Inventory Advantage
■ ■
Non-Commodity Return on
Award Program Management
■ Great Quality Invested Capital
■ Fragmented See page 14
■ Reconditioning
■ ■
Competition See page 6 Customer-Friendly Return on
■
Service Finance Originations Shareholders’ Equity
■ Consumer Need
■ carmax.com® See page 10 See page 13
See page 4
See page 8
Financial Highlights
Percent Change Fiscal Years Ended February 28 or 29
’05 to ’06 2006 2005 2004 2003* 2002*
(Dollars in millions except per share data)
Operating Results
Net sales and operating revenues 19% $6,260.0 $5,260.3 $4,597.7 $3,969.9 $3,533.8
Net earnings 31% $ 148.1 $ 112.9 $ 116.5 $ 94.8 $ 90.8
Separation costs* nm $ — $ — $ — $ 7.8 $ 0.4
Net earnings excluding separation costs 31% $ 148.1 $ 112.9 $ 116.5 $ 102.6 $ 91.2
Per Share Data
Diluted earnings 30% $ 1.39 $ 1.07 $ 1.10 $ 0.91 $ 0.87
Separation costs* nm $ — $ — $ — $ 0.07 $ 0.01
Diluted earnings excluding separation costs 30% $ 1.39 $ 1.07 $ 1.10 $ 0.98 $ 0.88
Other Information
Cash provided by operating activities 167% $ 122.3 $ 45.7 $ 147.0 $ 60.5 $ 42.6
Used car superstores, at year-end 16% 67 58 49 40 35
* Results for fiscal 2003 and fiscal 2002 include costs related to the October 2002 separation of CarMax from Circuit City Stores, Inc. nm = not meaningful
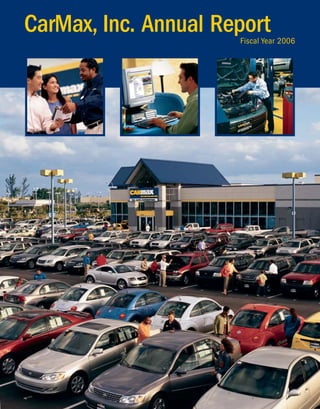
Cover photo: CarMax’s used car satellite superstore in Miami Lakes, Florida, opened in September 2005.
3. CarMax, Inc. is the nation's largest retailer of used cars. As of February 28, 2006,
CarMax operated 67 used car superstores in 31 markets, as well as seven new car
franchises, all of which were integrated or co-located with its used car superstores.
CarMax retailed 289,888 used vehicles in fiscal 2006, representing 93% of the total
310,789 vehicles retailed by the company during the year.
CARMAX MARKETS CARMAX USED CAR SUPERSTORES
(As of February 28, 2006)
Alabama Kansas/ Tennessee
Birmingham Missouri Knoxville
Kansas City (2) Memphis
California
Wichita Nashville (2)
Los Angeles (5)
Sacramento Kentucky Texas
Louisville Austin
Florida
Dallas/Fort Worth (4)
Jacksonville Nevada
Houston (4)
Miami (5) Las Vegas (2)
San Antonio
Orlando (2) New Mexico
Tampa (2) Utah
Albuquerque
Salt Lake City
Georgia North Carolina
Atlanta (4) Virginia
Charlotte (2)
Richmond (2)
Illinois Greensboro (2)
Virginia Beach
Chicago (8) Raleigh (2)
Washington, D.C./
Indiana South Carolina
Baltimore (4)
Large Markets (8) Indianapolis Columbia
Greenville
Mid-Sized Markets (23)
REVENUES NET C O M PA R A B L E S TO R E USED
$6.26
289,888
EARNINGS USED UNIT SALES VEHICLES
(In billions)
$148.1
SOLD
$5.26
(In millions) (Percentage change)
253,168
224,099
$4.60
$116.5
$112.9
190,135
24
$3.97
164,062
$3.53
$94.8
$90.8
8
6
4
1
02 03 04 05 06
02 03 04 05 06
02 03 04 05 06 02 03 04 05 06
Forward-Looking Statements: Statements in this annual report about the company's future business plans, operations, opportunities, or prospects, including without limitation any statements or factors regarding expected sales,
margins, or earnings, are forward-looking statements made pursuant to the safe harbor provisions of the Private Securities Reform Act of 1995. Such forward-looking statements are based on management's current knowledge and
assumptions about future events and involve risks and uncertainties that could cause actual results to differ materially from anticipated results. For more details on factors that could affect expectations, see “Management's
Discussion and Analysis of Financial Condition and Results of Operations” contained in this annual report and the reports that the company files with or furnishes to the Securities and Exchange Commission.
Separation: On October 1, 2002, CarMax, Inc. was separated from Circuit City Stores, Inc. and became an independent, separately traded public company. Details of the separation are discussed in the company's Annual Report on
Form 10-K for the fiscal year ended February 28, 2006. The consolidated financial statements and related information contained in this annual report are presented as if CarMax existed as a separate entity during all periods presented.
4. Letter to Shareholders
■ Associate Development: — Systematically
WHERE WE ARE identify, hire, train, and
continuously develop a broadly diverse group of talented associates
Sales and Earnings. In fiscal 2006 we experienced many of the
to support both our new store growth and continued operational
market challenges we had seen in fiscal 2005. Unexpected spikes
improvement. During the year, we successfully developed more
in gas prices, rising wholesale vehicle prices, rising interest rates,
than 200 new managers to support growth, and we opened
Iraq war anxiety — all were key factors we noted last year that we
nine superstores, which employ more than 800 associates. We
thought might come into play this year, and indeed they did.
also enhanced our continuing training and development pro-
Nonetheless, our sales and earnings growth was much stronger grams for existing managers. Finally, we launched an on-line
this year than last. Net earnings increased 31% on a sales increase job application and screening system that significantly improved
of 19%, including 4% growth in comparable store used units. Key the quantity and quality of our applicants.
drivers of our performance included:
■ Company Culture: — Maintain an enthusiastic, down-to-earth,
■ We learned how to optimize our appraisal approach in the non-hierarchical business culture that treats every associate and
rising wholesale price environment, offsetting margin pressure every customer with the respect and personal attention they deserve,
on our retail business. and lets us all have fun doing it. CarMax was named to the
■ We benefited this year from the summer incentive environment. Fortune “100 Best Companies to Work For” list for the second
consecutive year and we were named the nation’s “Most
New car manufacturer employee pricing programs drove traffic
Admired” auto retail/service company in a Fortune industry
into the marketplace, providing the consumer greater pricing
survey. We’re proud of this recognition of what we’ve achieved
clarity — an environment where the transparent CarMax offer
with our culture; we’re also aware that there are many opportu-
produced strong results.
nities for further improvement.
■ CarMax Auto Finance continued to provide a strong
We surveyed all our associates in fiscal 2006 to define the core
earnings contribution.
elements of our culture. We have also begun an annual associate
Additional Accomplishments. Our store growth stayed on target.
engagement benchmarking process with the Gallup organization
We added nine stores, increasing our superstores 16%, in line with
that helps us understand where we’re good and where we need
our plan to grow our store base 15% to 20% per year. We also con-
to be better. The process allows us to focus on tangible incre-
tinued to balance our store growth by market size and type of store, mental improvements in our daily working relationships at the
adding five standard superstores and four satellite superstores. individual work team level. It also allows us to benchmark our-
selves against other world-class organizations to keep our sights
O P E R AT I O N A L G O A L S on an ever higher goal.
We continue to focus on the three broad operational goals that ■ carmax.com: — Assure that carmax.com is both the single best
we’ve discussed in our last two annual reports, and we’ve added place on the internet to shop for a used car, and is a comfortable,
carmax.com to this list because of its increasingly central role in user-friendly home where the automotive shopper can find all the
our marketing program: tools and information needed. Over the last five years, carmax.com
■ Quality/Waste Elimination: — Further systematize our efforts at has become a central feature of our sales and marketing program.
continuous quality improvement, combined with a relentless focus on There were more than 40 million visits to carmax.com this
waste elimination. During fiscal 2005, we launched a systematic year, and approximately 70% of in-store customers indicate they
visited our site before coming to the store. During fiscal 2006,
framework for achieving process improvement in our recondi-
we undertook extensive consumer research to identify those
tioning and service operations. During fiscal 2006, we extended
improvements that were most important to shoppers and cus-
it to our cosmetic process. We also launched a ground-zero
tomers. We launched a significant rewrite of the site providing
redesign of our reconditioning process at our newly opened
improved “power search” functionality, improved quantity and
Virginia Beach superstore based on a single-piece flow system
quality of vehicle photos, and improved overall graphic quality.
that eliminates waste, insures quality, and provides superior
We also significantly expanded our use of key-word search
diagnostics at each step of the process. We will continue to
advertising. During the coming year, we will continue to shift
develop and refine this process over the coming year.
advertising dollars from newspaper to online search, online
Waste elimination is a key to the continuous improvement
classified advertising, and other innovative ways of using the
process. By identifying and eliminating wasted motion, materials,
web to drive customers to carmax.com. We will also undertake
and labor we can improve efficiency and quality while reducing
additional significant investment in carmax.com usability,
cost. We plan to extend this waste elimination focus to key
functionality, and information resource connections.
opportunity areas of our store operations over the coming year.
2 CARMAX 2006
5. Austin Ligon, President and Chief Executive Officer
Austin Ligon, President and Chief Executive Officer
C O M M U N I T Y I N VO LV E M E N T market/small trade area store. Charlottesville is a separate televi-
sion market with approximately 185,000 people, less than half the
We continue to believe it’s important for CarMax to contribute to
size of our next smallest trade area. We will be opening the market
the communities where we live and work. During fiscal 2006, the
with a 14,000 ft.2 satellite that will operate with a different manage-
CarMax Foundation made new grants totaling $1.2 million focusing
ment structure designed for efficiency at volumes of 100 to 175 cars
on these primary areas:
per month, which, while lower than our norm, still are 2 to 4 times
■ At the national level, family automotive safety: We continued
that of a typical new car dealer’s used operation. This store will
a focused strategy of investing to promote driver and passen-
allow us to understand and refine the operating characteristics
ger auto safety, providing grants to: Driver’s Edge, providing
both for smaller markets and smaller fill-in trade areas and will
safety and collision-avoidance education to young drivers;
contribute to our efforts to ultimately increase market share and
Mother’s Against Drunk Driving, funding nine new chapters
overall growth potential through denser storing patterns.
at universities; and The Healthy Mothers, Healthy Babies
Coalition, for further development of booster seat safety. We also are opening the CarMax Car Buying Center, our first
■ In Richmond, education and youth development: Our home appraisal-only location. This center is on a one-half acre site where
we will conduct appraisals and purchase vehicles using the same
town efforts continue to focus on education and youth develop-
ment, particularly among economically disadvantaged inner city processes and systems utilized in our used car superstores. This
youth. We provided grants to 31 organizations including a seed- test is part of our long-term program to increase both appraisal
grant to the National Center for Neighborhood Enterprise to traffic and our retail vehicle sourcing self sufficiency.
bring its successful “Violence-Free Zone” initiative to Richmond.
Going forward, our growth program will continue to include a mix
■ Local, matching gifts, and volunteer grants: Approximately of stores each year designed to balance the opening load across our
15% of our funds are reserved to support matching gifts by our regions and the risks and rewards of new versus established, and
associates to charitable organizations. We also provide matching large versus small, markets.
grants of $10 per hour of volunteer time our associates provide
to qualified organizations. The enormous tragedy created by
THANKS
Hurricane Katrina brought out the natural generosity of our
I want to again thank all 12,000 CarMax associates for the terrific
associates. Despite the fact we currently have no operations in
job they did helping us successfully navigate a very volatile auto-
Louisiana or Mississippi, our associates provided donations for
motive market and still turn in an outstanding performance for
Katrina relief which, with foundation and corporate matching,
both our customers and our shareholders. As I will be retiring this
totaled nearly a half million dollars. We also make grants to
year after 15 years of work on CarMax, I also want to particularly
local charities as part of each CarMax grand opening.
thank the long-serving CarMax associates, the Pam Hill’s and
Kenny West’s, Joe Palermo’s and Ruby McNeil’s, Shawn Vu’s
WHERE WE’RE GOING and Esther Tedesco’s. I continuously receive the credit for what
Growth Program. Our focus since resuming growth in late fiscal is really the work that they and their counterparts have done to
2002 has been to add fill-in stores in established markets and stan- create and build CarMax into the wonderful company it is today.
dard stores in new, mid-sized markets. These represent the lowest My sincerest thanks to each of you.
risk, highest early return opportunities, helping to offset the
expense penalties of our growth program buildup. In fiscal 2006,
we also added two new stores and launched a full advertising
program in Los Angeles. We’re quite pleased with the progress of
this market, and will continue to add stores to L.A., with a goal
of moving to 10 or more stores over the next several years.
Austin Ligon
In fiscal 2007, we plan to add approximately eleven stores, includ- President and Chief Executive Officer
March 30, 2006
ing a superstore in Charlottesville, Virginia, our first test of a small
CARMAX 2006 3
6. 1 Compelling Market
Satellite superstore showroom
HUGE year to the next, far less volatile than the annual change
in new car units sold.
■ With annual sales of approximately $370 billion, used
■ The market for late-model used cars is generally resistant
vehicles comprise nearly half of the U.S. auto retail
to typical economic cycles. As the economy improves,
market, the largest retail segment of the economy.
buyers who move from late-model used cars to new cars
■ In 2005, there were an estimated 44 million used
are replaced by buyers who move from older, higher
vehicles sold compared with 17 million new vehicles.
mileage cars to later model used cars.
■ CarMax’s primary focus — 1- to 6-year-old vehicles — is
■ This stability provides the foundation for CarMax’s
a market estimated approximately at $280 billion in
market share growth strategy in both existing and
annual sales and 21 million units per year.
new markets.
■ The used vehicle market is substantially larger than
other large retail categories such as the school and office
U S E D V E H I C L E S A L E S S T A B I L I T Y (Percent change)
products market ($206 billion in estimated annual sales) 15
and the home improvement market ($291 billion in 10
estimated annual sales). 5
0
-5
S TA B L E -10
■ Only three times in the last 20 years has the volume of -15
05
85 87 89 91 93 97 99 01 03
95
used unit sales fluctuated by more than 3% from one % Change Used Vehicle Unit Sales % Change New Vehicle Unit Sales
Source: Manheim Auctions and ADESA, Inc.
4 CARMAX 2006
7. CarMax began with a search for a compelling retail idea. We looked for a
large retail category with no significant national competitors and plenty of
unmet consumer needs. Extensive research showed an excellent opportunity
existed in automotive retailing, especially in used cars.
Superstore display lot The customer experience
NON-COMMODITY FRAGMENTED COMPETITION
■ ■
Unlike new cars, every used car is unique, reflecting The U.S. used car marketplace is highly fragmented and
differences in mileage, condition, and age. This includes about 21,600 franchised new car dealers and
uniqueness provides CarMax the opportunity to 44,700 independent dealers, as well as millions of
add value. private individuals.
■ ■
We carefully select the vehicles we offer for retail sale. Our primary competitors are the franchised new car
Our choices are driven by our high quality standards dealers, who sell the majority of late-model, 1- to 6-year-
and our exceptional understanding of consumer old used vehicles. These dealers focus primarily on new
buying preferences at each of our superstores. cars and secondarily on financing and service. Used car
retailing is often a lower priority business for them.
■ Every retail vehicle undergoes a rigorous reconditioning
■
process to ensure it meets our high quality standards. Independent dealers predominantly sell older, higher
mileage cars than does CarMax.
■ To date, there have been no successful, large-scale attempts
S TA B I L I T Y P R O V I D E D B Y C O N S I S T E N T
to replicate the CarMax used car superstore model.
T U R N O V E R O F V E H I C L E S I N O P E R AT I O N
(Percent annual turnover*)
25
CONSUMER NEED
■ Our consumer research confirms that most consumers
20
dislike the traditional high-pressure sales tactics
15
employed by many auto retailers.
10
■ “Car salesmen” have ranked at the bottom of virtually
every Gallup survey on the honesty and ethics of
5
various professions since the survey began in 1976.
0
■ The CarMax customer-friendly consumer offer is unique
94 95 96 97 98 99 00 01 02 03 04 05
in auto retailing. We eliminate the traditional adversarial
1 out of 5 vehicles in operation in the U.S. changes hands annually.
relationship and let customers shop for cars the same
* Total used vehicle sales divided by total vehicles in operation
way they shop at other “big-box” retailers.
Source: Manheim Auctions and ADESA, Inc.
CARMAX 2006 5
5 CARMAX 2006
8. 2 Skilled, Dedicated People
Reconditioning expertise
TRAINING AND DEVELOPMENT A B OV E & B E YO N D AWA R D P R O G R A M
■ ■
In any complex retail business, the primary challenge In 2003, we created the Above & Beyond Award to
and limitation to growth is in the ability to acquire, train, recognize store associates who deliver exceptional
and develop people. customer service, “above & beyond” even CarMax’s
high standards.
■ We believe that the integrity and transparency of the
■
CarMax consumer offer allows us to attract managers Above & Beyond Award winners are selected each
and associates with much more diverse backgrounds month based on customer feedback or nominations
than the traditional auto retailer. by co-workers or management. Winners receive a
monetary award and company-wide recognition.
■ We recruit the majority of our superstore managers from
■
the top big-box retailers across the country, focusing on This program is one example of the many ways that
individuals with a broad general management back- we are fostering an environment grounded in providing
ground and a successful career progression. unparalleled service to our customers. A variety of other
award programs have been developed to recognize
■ Our formal training programs span each of our four
exceptional associate contributions.
functional areas — sales, operations, buying, and business
■
office. The programs include classroom and online The associates pictured at right represent a few
training as well as formal mentoring assignments. of the 28 Above & Beyond Award recipients for
Standardized training, procedures, and processes calendar 2005.
facilitate transfers between stores and regions.
6 CARMAX 2006
9. CarMax’s success depends on the skilled and dedicated people who deliver
our consumer offer, execute our processes, and develop our systems.
Matt Pietrowski Deborah DeWitty Roy Arcilla Trevor Moss
Miguel Cossyleon Franklin Jackson, Jr. Rachel Myatt Brian Fletter
David Hove Andrea Kelly Matt Williamson George Johnson
A B OV E & B E YO N D AWA R D W I N N E R S ( C A L E N DA R 2 0 0 5 )
Roy Arcilla CJ Fondaw Chad Hellams Andy Little Zack Reaves
Inventory Sales Detailer Technician Technician
Plano (Dallas/Fort Worth) Nashville Greenville Greenville Greenville
Sherman Blankenship Clayton Fulmer David Hove Will McCutchan Jorge Silva
Sales Detailer Sales Technician Sales
Winston-Salem Greenville Jacksonville Dulles (D.C./Baltimore) Rockville (D.C./Baltimore)
Miguel Cossyleon Nick Fulton Franklin Jackson, Jr. Trevor Moss Jennifer Spencer
Sales Service Sales Inventory Customer Service
Oak Lawn (Chicago) Greenville Rockville (D.C./Baltimore) Houston North Independence (Kansas City)
Angel Cruz Kevin Hagedon George Johnson Rachel Myatt Michelle Topping
Technician Sales Inventory Sales Business Office
Greenville Roseville (Sacramento) Houston North Charlotte Winston-Salem
Deborah DeWitty Shantel Hamilton Andrea Kelly Matt Pietrowski Bob Ward
Business Office Sales Business Office Technician Sales
Southwest Freeway (Houston) Roseville (Sacramento) Sample Road (Miami) Richmond Orlando
Brian Fletter Jared Kelly Matt Williamson
Service Inventory Technician
Orlando Chrysler Jeep Dodge Independence (Kansas City) Richmond
CARMAX 2006 7
7 CARMAX 2006
10. 3 Unique Consumer Offer
No-haggle pricing
L OW, N O - H A G G L E P R I C E S BROAD SELECTION
■ ■
We offer our best price up front and never haggle on An average CarMax superstore has between 300 and
any element of the sales transaction. 400 vehicles for sale, compared with approximately 90
used vehicles at the average new car dealer.
■ The price of the vehicle is competitively low and clearly
■
posted on the car, in the store, and on carmax.com. Our primary focus is vehicles that are 1 to 6 years old,
with fewer than 60,000 miles. For the most cost-con-
■ The price of the extended service plan is competitive
scious consumer, we also offer older, higher mileage
and fixed, based primarily on the repair record of similar
ValuMax® cars that meet our same quality standards.
vehicles and the length of coverage.
ValuMax vehicles comprise approximately 15% of our
■ The price of the financing is competitive and no-haggle
inventory.
and is based on the finance company’s assessment of
■ Each store’s inventory is tailored to the buying prefer-
credit risk. Customers see each finance offer as it is
ences of the consumers in that store’s trade area.
made directly from the finance company and may
choose among competing offers.
■ The price of the “trade-in” is a written cash offer, based
on the wholesale value of the vehicle, and we’ll buy the
customer’s vehicle whether or not the customer is buy-
ing from us. The offer is good for 7 days or 300 miles.
8 CARMAX 2006
11. The CarMax offer is structured around our core equities — the benefits
we offer customers that, taken together, make us unique in auto retailing.
Guaranteed quality Easy vehicle transfers
G R E AT Q UA L I T Y CARMAX.COM®
■ ■
Every used vehicle we retail must meet stringent Carmax.com is a valuable marketing and research tool
mechanical, electrical, and safety standards. that allows customers to see a car’s photos, price, and
specifications, as well as to make side-by-side vehicle
■ Every used vehicle we retail is put through a thorough,
comparisons, all from the comfort of home. We have
125-point inspection. Needed repairs are made and the
sales consultants dedicated to caring for customers who
car is thoroughly detailed inside and out to make it look
contact us through the Internet.
and feel as close to new as possible.
■ Using carmax.com, customers can browse our nation-
■ We stand behind our quality standards with our 5-day,
wide inventory of more than 22,000 used vehicles. This
money-back guarantee and our industry-leading, 30-day
web-accessible inventory will continue to expand
limited warranty. We also offer extended service plans
as we grow geographically.
on every vehicle we retail that provide up to 6 years
■
of coverage. In February 2006, we began leveraging the power of
carmax.com by also listing all of our vehicles on
AutoTrader.com and cars.com. We believe partnering
C U S TO M E R - F R I E N D LY S E RV I C E with these online classified providers will drive incre-
mental traffic to carmax.com and our stores.
■ We designed the CarMax offer to give consumers
what they asked for: no haggling on any aspect of the ■ Virtually any used vehicle in our nationwide inventory
sale, broad selection, high quality, and a customer- can be transferred at customer request to their local
friendly process. superstore. Transfers are free within a market; longer-
distance transfers include a charge to cover transporta-
■ To ensure that sales consultant objectives are completely
tion costs.
aligned with those of the customer, we base sales
consultant commissions on a fixed dollars-per-unit ■ Currently, approximately 20% of our vehicles sold are
standard. Consequently, each sales consultant’s only transferred at customer request, and more than 20% of
objective is to help customers find the right cars for retail sales are initiated through our Internet sales
their needs at prices they can afford. process.
■ Our computerized inventory system makes it easy
to search our vehicle inventory at each store or
company-wide.
■ There is no hand-off of customers to a finance manager
or sales manager. The sales consultant helps the customer
through the entire sales process.
CARMAX 2006 9
9 CARMAX 2006
12. 4 Proprietary Processes & Systems
CarMax wholesale auction
P R O P R I E TA R Y P R O C E S S E S A N D S Y S T E M S I N F O R M AT I O N S Y S T E M S
■ Our systems capture data on every aspect of our
business. We collect data on activities such as:
● Customer visits.
Consumer ● Sales consultant/customer engagements.
Offer
● Test drives.
● Appraisals and appraisal purchases.
● Financings.
● Extended service plan sales.
Purchasing/
■ Every retail vehicle is electronically tracked throughout
Inventory
Management its CarMax life from purchase through reconditioning to
ultimate sale. We also capture data on vehicles we whole-
sale, helping us track market pricing.
Finance
Reconditioning ■ This information is used to continually enhance and
Originations
refine our processes and systems, as well as to provide
the basis for managing our associates’ performance.
IN
S
FO
EM
RM
AT I O N S Y S T
10 C A R M A X 2 0 0 6
13. Our business is not unlike an iceberg. Our unique consumer offer is what draws customers
to our stores; it is what can be seen “above the waterline.” However, our associates’ devel-
opment and use of key processes and systems “below the waterline” are what make our
business successful — sophisticated purchasing and inventory management, recondition-
ing, and finance originations, all supported by proprietary information systems.
Customer vehicle appraisal Capturing test drive information
■ ●
We believe our processes and systems provide us with a Make pricing adjustments based on complex algorithms
key competitive advantage. These enabling technologies that take into account factors including sales history,
have been developed during our more than 12-year consumer interest, and seasonal patterns.
history, and we are dedicated to their continuous ● Optimize inventory turns to help maintain gross
improvement to maintain this competitive edge. margin dollars per unit and minimize the depreciation
risk inherent in used cars.
P U R C H A S I N G A N D I N V E N TO RY
MANAGMENT RECONDITIONING
■ More than half the cars we retail are purchased directly ■ The majority of our service operation resources are used
from consumers, an excellent source of quality, high- in vehicle reconditioning, which supports our used vehicle
demand vehicles. Customer vehicle purchases that do retail sales.
not meet our retail standards are sold to other dealers at
■ We employ state-of-the-art production techniques, and we
our own in-store auctions, which are an economic and
focus on balancing quality, speed, and cost. Our produc-
efficient means of disposal.
tion planning process allows us to match reconditioning
■ We have built a team of more than 675 skilled buyers. capacity and inventory demand across multiple stores.
The team includes 172 buyers who have each completed
■ We maximize our service bay utilization by implement-
more than 10,000 appraisals and an additional 21 buyers
ing 24/7 shift scheduling where appropriate.
who have surpassed the 20,000-appraisal mark. Our
■ Over the past several years, we have significantly reduced
buyers have online access to information on current
our work-in-process inventory requirements through our
inventory and recent sales, as well as wholesale industry
improved process and production techniques.
information. Our high volume of in-store appraisals and
■ Automotive technicians are in short supply in the U.S.
outside auction purchases provides a great training
We are able to attract and retain skilled technicians by
ground that gives us an advantage compared with other
offering a superior working environment, including air-
used car retailers.
conditioned bays; a corporate benefit program; and the
■ Our inventory and pricing models help us to:
opportunity for career advancement. We also have
● Buy a mix of makes, models, age, mileage, and price
developed an extensive in-house apprentice program.
points tailored to customer buying preferences at
each superstore.
CARMAX 2006 11
11 C A R M A X 2 0 0 6
14. Straightforward finance originations Reconditioning systems
■
F I N A N C E O R I G I N AT I O N S This financing process reduces or eliminates two of the
three risks inherent in used car lending.
■ CarMax has created a unique finance origination process
● The collateral risk — the risk of the vehicle — is mini-
that provides significant customer benefits and competi-
mized by the consistent, high quality of our cars,
tive advantages.
the large percentage of vehicles covered by extended
● The sales consultant collects the customer’s credit
service plans, and the consistency of the relationship
information and electronically submits the credit
between wholesale and retail values for CarMax
application to CarMax Auto Finance (“CAF”) and a
vehicles. CAF and our third-party finance companies
third-party prime finance company. Applications are
have found they can rely on CarMax information to
automatically rerouted to third-party nonprime
determine true vehicle worth.
finance companies if neither CAF nor the third-party
● The “intermediary” risk — the risk introduced by
prime finance company makes an offer.
the person between the customer and the finance
● Customers see each offer directly from the finance
source — is eliminated at CarMax. There is no
company, and, where multiple offers exist, they may
commission-driven finance manager to distort the
choose the offer that best suits their needs.
facts on the price or quality of the vehicle or the
● We provide a 3-day payoff option, which gives consumer credit information. With the price of
customers up to three business days to replace the all components fixed, value-oriented, and non-
financing with cash or an alternative lending source, negotiable at CarMax, both CAF and third-party
free of penalty or interest. finance companies benefit from superior information
● The sales consultant receives no commission on quality in making financing decisions.
the finance process. ● The consumer risk — the customer’s willingness and
ability to pay — is the basic risk borne by all lenders.
■ Having a captive finance operation also reduces the
sales risk associated with changes in third-party credit
availability.
12 C A R M A X 2 0 0 6
15. 5
Strong Results
Since opening our first store in September 1993, we have grown to more than
$6 billion in annual sales in the short span of 12 years. Our economic returns
are similar to many industry-leading, big-box retailers and significantly better
than the publicly traded new car dealer groups.
$6,260.0
REVENUES R E T U R N O N I N V E S T E D C A P I TA L
(In millions) (Unleveraged)
$5,260.3
12.7%
$4,597.7
12.4%
12.1%
11.5%
10.8%
$3,969.9
8.5%
$3,533.8
$2,758.5
3.5%
$2,201.2
$1,607.3
$950.7
(0.5)%
(0.8)%
(0.8)%
$566.7
$327.1
(5.3)%
96 97 98 99 00 02 03 04 05 06
01
01 02 03 04 05 06
96 97 98 99 00
EARNINGS RETURN ON SHAREHOLDERS’ EQUITY
$148.1
(In millions)
$116.5
$112.9
20.7%
$94.8
18.9%
18.2%
$90.8
16.8%
15.2%
12.4%
$45.6
0.3%
$1.1
$(5.2)
$(9.3)
$(23.5)
(4.9)%
(6.7)%
$(34.2)
(9.1)%
02 03 04 05 06
97 98 99 00 01
02 03 04 05 06
01
96 97 98 99 00
ROE calculations not meaningful for periods prior to fiscal 1997.
CARMAX 2006 13
16. 6 Solid Growth Opportunity
SC & customers in display lot
NEW PHOTO
Superstore display lot
G R OW T H P L A N to increase market share. Satellite stores are highly
efficient because they are built on smaller sites and
■ We plan to open stores at an annual rate of approxi-
require little-to-no incremental advertising.
mately 15%-20% of our used car superstore base. In
■ In fiscal 2007, we expect to open approximately
fiscal 2007, the majority of our store openings will
11 superstores, representing a 16% increase in our
be superstores in new mid-sized markets and satellite
used car superstore base. Store opening dates are
superstores in existing markets. After fiscal 2007, we
heavily weighted to the second half of the fiscal year.
expect to resume store growth in new large markets.
■ One of the openings will be in Charlottesville, Va.,
■ We initially defined mid-sized markets as those with
which has a television viewing population of approxi-
television viewing populations ranging from 1 million
mately 185,000. This test store will help us understand
to 2.5 million. As we have refined our operations and
our longer-term opportunities in small markets.
market data, we now believe a more appropriate defini-
■
tion of a mid-size market is one with a television view- We also are opening our first appraisal-only “CarMax
ing population between 600,000 and 2.5 million. These Car Buying Center.” Located in the Atlanta market,
markets are the easiest to enter from a real estate and the center is staffed with CarMax buyers who conduct
advertising perspective, and historically they are where appraisals and purchase vehicles using the same
we have experienced the fastest store sales ramp-up processes and systems utilized in our used car super-
and profitability. stores. This test store is part of our long-term program
to increase appraisal traffic and retail vehicle sourcing
■ We are adding satellite stores both in under-served trade
self-sufficiency.
areas in existing large markets and in mid-sized markets
14 C A R M A X 2 0 0 6
17. By focusing on used cars, CarMax can grow organically, unrestrained by franchise law
or manufacturer restrictions. At the end of fiscal 2006, we had 67 used car superstores
in 31 U.S. markets representing approximately one-third of the U.S. population. We
believe the combination of continued geographic expansion and market share gains
resulting from our consumer-preferred concept can fuel growth for years to come.
Test drive In-store inventory kiosk
■ For the foreseeable future, we believe we can achieve DEFENSIBLE COMPETITIVE
average comparable store used unit growth in the range A DVA N TA G E
of 4% to 8% per year. This range assumes modest over-
■ There have been several unsuccessful attempts to repli-
all market growth, continued CarMax market share
cate the CarMax model. Competitors who have tried
gains, and the effect of higher sales growth rates at stores
to copy our concept have typically failed because they
that have not yet reached basic maturity.
focused only on our consumer concept. They ignored
■ We estimate that we have an 8% to 10% market share the hidden danger of failing to build strong operating
of late model, 1- to 6-year-old used cars within the processes early in concept development.
trade areas of our most mature stores. This benchmark
■ At present, we are fortunate to have no similar-format,
implies a sales potential of approximately $25 billion
multi-market challengers. This advantageous competitive
in today’s dollars as our stores reach maturity and we
landscape is allowing us to expand on our own timetable,
achieve full national scope.
following our own strategic priorities.
■ Our market share is significantly higher within a 5- to
■ CarMax has a more than 12-year development advan-
10-mile radius of our most mature stores. Our satellite
tage over any challenger who attempts to copy our busi-
store additions and our small market store test will help
ness. Building an organization, developing specialized
us to determine incremental market share opportunities
processes and systems, refining execution…all take time.
and optimal storing densities and patterns.
■ CarMax intends to stay ahead of any potential competi-
tion through relentless attention to people, processes,
and execution.
S TO R E E X PA N S I O N
(Number of used car superstores at fiscal year end) 67
58
49
40
35
33
33
29
18
7
4
2
1
94 95 96 97 98 99 00 01 02 03 04 05 06 07 08
CARMAX 2006 15
15 C A R M A X 2 0 0 6
18. Management Teams
■ ■
People are the lifeblood of any retailer, and nowhere is Most of our corporate associates are also directly involved
this more true than at CarMax. Our associates are the in supporting our stores, whether it be in creating the
face of CarMax to our customers, and the success of the systems and analytical tools used by store associates,
company depends upon our associates’ success. developing and executing our marketing programs, or
planning and coordinating future store expansion.
■ At the store level, our management teams are organized
■
by functional areas, and each team member is responsible Pictured on this page are members of our store, region,
for developing associates, consistently executing our and corporate management teams, and they represent
processes and systems, and ensuring a favorable the approximately 12,000 CarMax associates who
customer experience. contribute to our success every day.
■ Our six regional management teams assure consistent
execution of our processes and systems across our
entire store base.
16 C A R M A X 2 0 0 6
19. S E L E C T E D F I N A N C I A L D ATA
FY06 FY05 FY04 FY03 FY02 FY01 FY00 FY99 FY98 FY97
(Dollars in millions except per share data)
Net sales and operating revenues .................... $6,260.0 $5,260.3 $4,597.7 $3,969.9 $3,533.8 $2,758.5 $2,201.2 $1,607.3 $950.7 $566.7
Net earnings (loss).............................................. $ 148.1 $ 112.9 $ 116.5 $ 94.8 $ 90.8 $ 45.6 $ 1.1 $ (23.5) $ (34.2) $ (9.3)
Net earnings (loss) per share:
Basic ................................................................. $ 1.41 $ 1.09 $ 1.13 $ 0.92 $ 0.89 $ 0.45 $ 0.01 $ (0.24) $ (0.35) $ (0.10)
Diluted ............................................................... $ 1.39 $ 1.07 $ 1.10 $ 0.91 $ 0.87 $ 0.44 $ 0.01 $ (0.24) $ (0.35) $ (0.10)
Total assets........................................................... $1,489.2 $1,293.0 $1,047.9 $ 917.6 $ 720.2 $ 711.0 $ 675.5 $ 571.2 $448.3 $427.2
Long-term debt, excluding current portion... $ 134.8 $ 128.4 $ 100.0 $ 100.0 $ — $ 83.1 $ 121.3 $ 139.7 $ 27.4 $ —
Used vehicle units sold...................................... 289,888 253,168 224,099 190,135 164,062 132,868 111,247 96,915 56,594 31,701
New vehicle units sold....................................... 20,901 20,636 21,641 22,360 24,164 20,157 17,775 6,152 4,265 2,799
Wholesale vehicle units sold ............................ 179,548 155,393 127,168 104,593 90,937 73,323 58,452 46,784 24,475 15,252
Percent changes in:
Comparable store used vehicle unit sales.... 4 1 6 8 24 13 (8) (5) 6 7
Total used vehicle unit sales........................... 15 13 18 16 23 19 15 71 79 62
Total net sales and operating revenues ........ 19 14 16 12 28 25 37 69 68 73
Diluted net earnings (loss) per share............ 30 (3) 21 5 98 4,300 104 31 (250) nm
Used car superstores at year-end..................... 67 58 49 40 35 33 33 29 18 7
Retail stores at year-end .................................... 71 61 52 44 40 40 40 31 18 7
Associates at year-end........................................ 11,712 10,815 9,355 8,263 7,196 6,065 5,676 4,789 3,605 1,614
nm = not meaningful. The initial public offering of CarMax stock occurred in 1997.
CARMAX 2006 17
20. M A N A G E M E N T ’ S D I S C U S S I O N A N D A N A LY S I S
The following Management’s Discussion and Analysis of Financial Condition and Results of Operations
(“MD&A”) is intended to help the reader understand the financial performance of CarMax, Inc. MD&A is
presented in eight sections: Business Overview; Critical Accounting Policies; Results of Operations;
Operations Outlook; Recent Accounting Pronouncements; Financial Condition; Market Risk; and
Cautionary Information About Forward-Looking Statements. MD&A is provided as a supplement to, and
should be read in conjunction with, our consolidated financial statements and the accompanying notes
contained elsewhere in this annual report.
In MD&A, “we,” “our,” “us,” “CarMax,” “CarMax, Inc.,” and “the company” refer to CarMax, Inc. and its
wholly owned subsidiaries, unless the context requires otherwise. Amounts and percentages in tables may not
total due to rounding.
BUSINESS OVERVIEW
General
CarMax is the nation’s largest retailer of used vehicles. We pioneered the used car superstore concept, opening
our first store in 1993. Over the next six years, we opened an additional 32 used car superstores before
suspending new store development to focus on improving sales and profits. After a period of concept refinement
and execution improvement, we resumed opening new stores at the end of fiscal 2002. At February 28, 2006,
we had 67 used car superstores in 31 markets, including 23 mid-sized markets and 8 large markets. We initially
defined mid-sized markets as those with television viewing populations generally between 1 million and
2.5 million people. As we have refined our operations and market data, we now believe a more appropriate
definition of a mid-sized market is one with a television viewing population generally between 600,000 and
2.5 million people. During fiscal 2006, we also operated seven new car franchises, all of which were integrated
or co-located with our used car superstores. In fiscal 2006, we sold 289,888 used cars, representing 93% of the
total 310,789 vehicles the company sold at retail.
We believe the CarMax consumer offer is unique in the automobile retailing marketplace. Our offer gives
consumers a way to shop for cars in the same manner that they shop for items at other “big box” retailers. Our
consumer offer is structured around four core equities: low, no-haggle prices; a broad selection; high quality;
and customer-friendly service. Our website, carmax.com, is a valuable tool for communicating the CarMax
consumer offer, a sophisticated search engine, and an efficient sales channel for customers who prefer to
complete part of the shopping and sales process online. We generate revenues, income, and cash flows
primarily by retailing used vehicles and associated items including vehicle financing, extended service plans,
and vehicle repair service. A majority of the used vehicles we sell at retail are purchased directly from
consumers. Vehicles purchased through our appraisal process that do not meet our retail standards are sold at
on-site wholesale auctions.
Wholesale auctions are conducted at the majority of our superstores and are held on a weekly, bi-weekly, or
monthly basis. On average, the vehicles we wholesale are approximately 10 years old and have more than
100,000 miles. Participation in our wholesale auctions is restricted to licensed automobile dealers, the majority
of whom are independent dealers.
CarMax provides prime-rated financing to qualified customers through CarMax Auto Finance (“CAF”),
the company’s finance operation, and Bank of America. Nonprime financing is provided through several third-
party lenders, and subprime financing is provided through a third-party lender under a program rolled out
near the end of the second quarter of fiscal 2005. We periodically test additional third-party lenders. CarMax
has no recourse liability for loans provided by third-party lenders. Having our own finance operation allows us
to limit the risk of relying on third-party finance sources, while also allowing us to capture additional profit and
cash flows. The majority of CAF’s profit contribution is generated by the spread between the interest rates
charged to customers and our cost of funds. We collect fixed, prenegotiated fees from the third parties that
finance prime- and nonprime-rated customers. As is customary in the subprime finance industry, the subprime
lender purchases the loans at a discount.
18 C A R M A X 2 0 0 6
21. We sell extended service plans on behalf of unrelated third parties who are the primary obligors. We have
no contractual liability to the customer under these third-party service plans. Extended service plan revenue
represents commissions from the unrelated third parties.
We are still at a relatively early stage in the national rollout of our retail concept. We believe the primary
driver for future earnings growth will be vehicle unit sales growth from comparable store sales increases and
from geographic expansion. We target a similar dollar amount of gross profit per used unit, regardless of
retail price. Used unit sales growth is our primary focus. We plan to open used car superstores at a rate of
approximately 15% to 20% of our used car superstore base each year. In fiscal 2007, we plan to focus our
store growth primarily on adding standard superstores in new mid-sized markets and satellite fill-in
superstores in established markets. After fiscal 2007, we expect to resume store growth in new large markets.
For the foreseeable future, we expect used unit comparable store sales increases to average in the range of 4%
to 8%, reflecting the multi-year ramp in sales at newly opened stores as they mature and continued market
share gains at stores that have reached basic maturity sales levels, which generally occurs in a store’s fifth
year of operation.
The principal challenges we face in expanding our store base include our ability to build our management
bench strength to support the store growth and our ability to procure suitable real estate at reasonable costs.
We staff each newly opened store with an experienced management team, generally including a location
general manager, operations manager, purchasing manager, and business office manager, as well as a
number of experienced sales managers and buyers. We must therefore continually recruit, train, and
develop managers and associates to fill the pipeline necessary to support future store openings. If at any
time we believed that the rate of store growth was causing our performance to falter, we would consider
slowing the growth rate.
Fiscal 2006 Highlights
Net sales and operating revenues increased 19% to $6.26 billion from $5.26 billion in fiscal 2005, and net
3
earnings increased 31% to $148.1 million, or $1.39 per share, from $112.9 million, or $1.07 per share.
Total used vehicle unit sales increased 15%, reflecting the combination of the growth in our store base and a
3
4% increase in comparable store used unit sales.
We opened nine used car superstores in fiscal 2006, including four standard superstores in new markets and
3
one standard and four satellite superstores in existing markets. Two of the superstore openings were in Los
Angeles, bringing our presence in this large market to five superstores and giving us the critical mass to
commence television advertising in this market.
Our total gross profit per unit increased to $2,544 from $2,375 in fiscal 2005. Compared with the prior
3
year, used vehicle gross profit per unit was similar, and wholesale vehicle gross profit per unit increased
substantially. The wholesale gross profit benefited from the exceptionally strong wholesale pricing
environment, particularly in the second half of the fiscal year, and the success of our in-store appraisal
strategy.
CAF income increased 26% to $104.3 million from $82.7 million in fiscal 2005, reflecting the growth in
3
retail vehicle sales and managed receivables. CAF income included a benefit of $0.09 per share for favorable
items, primarily valuation adjustments to the retained interest, in fiscal 2006, compared with a benefit of
$0.02 per share in fiscal 2005.
Selling, general, and administrative expenses as a percent of net sales and operating revenues (the
3
“SG&A ratio”) was 10.4% in both fiscal 2006 and fiscal 2005. The moderate rate of increase in
comparable store used unit sales was not sufficient to provide SG&A leverage. The increase in the
percentage of our store base that is comprised of stores not yet at basic maturity, the launch of market-
wide television advertising in Los Angeles, and the lower-than-normal corporate bonus expense in fiscal
2005 were also factors precluding SG&A leverage. Stores generally have higher SG&A ratios during
their first four years of operation.
Net cash provided by operations increased to $122.3 million from $45.7 million in fiscal 2005, reflecting the
3
improved net earnings and changes in working capital.
CARMAX 2006 19