SlideShare a Scribd company logo
1 of 3
Download to read offline
ADVANCED MICRO DEVICES, INC.
CONSOLIDATED STATEMENTS OF OPERATIONS
(Millions except per share amounts and percentages)


                                                                                                                                   Quarter Ended                           Year Ended
                                                                                                                     Dec. 27,        Sept. 27,    Dec. 29,            Dec. 27,     Dec. 29,
                                                                                                                      2008             2008        2007                2008         2007*
                                                                                                                   (Unaudited)      (Unaudited) (Unaudited)         (Unaudited)

Net revenue                                                                                                       $      1,162     $     1,797     $    1,737       $    5,808     $   5,858

Cost of sales                                                                                                              890             881               968         3,488         3,669


Gross margin                                                                                                               272             916               769         2,320         2,189

Gross margin %                                                                                                             23%             51%               44%           40%           37%

Research and development                                                                                                   465             438               455         1,848         1,771

Marketing, general and administrative                                                                                      317             315               319         1,304         1,360

Amortization of acquired intangible assets and integration charges                                                           30             30                50           137           236

Impairment of goodwill and acquired intangible assets                                                                      684               2          1,132            1,089         1,132

Restructuring charges                                                                                                        50              9                 -            90                -

Gain on sale of 200 millimeter equipment                                                                                      -               -                -          (193)               -


Operating income (loss)                                                                                                 (1,274)            122         (1,187)           (1,955)       (2,310)

Interest income                                                                                                               7              7                19            39            73
Interest expense                                                                                                            (89)           (87)              (95)         (366)         (367)
Other income (expense), net                                                                                                  37             (4)                1            22            (7)


Income (loss) from continuing operations before minority interest,
  equity in net loss of Spansion Inc. and other and income taxes                                                        (1,319)             38         (1,262)           (2,260)       (2,611)

Minority interest in consolidated subsidiaries                                                                               (6)             (7)              (9)           (33)          (35)

Equity in net loss of Spansion Inc. and other                                                                               (20)             (9)             (69)           (53)        (155)


Income (loss) from continuing operations before income taxes                                                            (1,345)             22         (1,340)           (2,346)       (2,801)

Provision (benefit) for income taxes                                                                                         69              (1)             (42)           68            27


Income (loss) from continuing operations                                                                          $     (1,414) $           23     $   (1,298)      $    (2,414) $     (2,828)

Income (loss) from discontinued operations, net of tax                                                                      (10)          (150)          (474)            (684)         (551)


Net income (loss)                                                                                                 $     (1,424) $         (127) $      (1,772)      $    (3,098) $     (3,379)


Net income (loss) per common share

Basic and diluted
  Continuing operations                                                                                           $       (2.32) $        0.04 $         (2.24)     $     (3.98) $      (5.07)
  Discontinued operations                                                                                         $       (0.02) $       (0.25) $        (0.82)     $     (1.12) $      (0.99)
Basic and diluted net income (loss) per common share                                                              $       (2.34) $       (0.21) $        (3.06)     $     (5.10) $      (6.06)


Shares used in per share calculation

Basic and diluted                                                                                                          609             608               579           607           558

* Amounts for the year ended December 29, 2007 were derived from the December 29, 2007 audited financial statements, adjusted for discontinued operations.
ADVANCED MICRO DEVICES, INC.
CONSOLIDATED BALANCE SHEETS
(Millions)
                                                                                                          Dec. 27,             Dec. 29,
                                                                                                           2008                 2007*
                                                                                                        (Unaudited)

Assets

Current assets:
  Cash, cash equivalents and marketable securities                                                  $           1,096     $          1,889
  Accounts receivable, net                                                                                        320                  640
  Inventories                                                                                                     656                  810
  Prepaid expenses and other current assets                                                                       279                  401
  Deferred income taxes                                                                                            28                   64
  Assets of discontinued operations                                                                                 -                  759


          Total current assets                                                                                  2,379                4,563

Property, plant and equipment, net                                                                              4,296                4,716
Goodwill                                                                                                          323                1,286
Acquisition related intangible assets, net                                                                        168                  465
Other assets                                                                                                      509                  520


Total Assets                                                                                        $           7,675     $         11,550

Liabilities and Stockholders' Equity (Deficit)

Current liabilities:
  Accounts payable                                                                                  $             631     $          1,009
  Accrued compensation and benefits                                                                               162                  186
  Accrued liabilities                                                                                             785                  821
  Deferred income on shipments to distributors                                                                     50                  101
  Current portion of long-term debt and capital lease obligations                                                 286                  238
  Other short-term obligations                                                                                     86                    -
  Other current liabilities                                                                                       226                  270


          Total current liabilities                                                                             2,226                2,625

Deferred income taxes                                                                                              91                    6
Long-term debt and capital lease obligations, less current portion                                              4,702                5,031
Other long-term liabilities                                                                                       569                  633
Minority interest in consolidated subsidiaries                                                                    169                  265

Stockholders' equity (deficit):
   Capital stock:
      Common stock, par value                                                                                       6                     6
      Capital in excess of par value                                                                            6,002                 5,921
   Retained earnings (deficit)                                                                                 (6,198)               (3,100)
   Accumulated other comprehensive income                                                                         108                   163


          Total stockholders' equity (deficit)                                                                    (82)               2,990


Total Liabilities and Stockholders' Equity (Deficit)                                                $           7,675     $         11,550


* Amounts for the year ended December 29, 2007 were derived from the December 29, 2007 audited financial statements, adjusted for
  discontinued operations.
ADVANCED MICRO DEVICES, INC.
SELECTED CORPORATE DATA (1)
(Unaudited)
(Millions except headcount and percentages)

                                                                                                                                                      Quarter Ended                                                                                           Year Ended
                                                                                                                      Dec. 27,                            Sept. 27,                          Dec. 29,                                            Dec. 27,                            Dec. 29,
Segment Information from Continuing Operations                                                                         2008                                 2008                              2007                                                2008                                2007


Computing Solutions (2)
   Net revenue                                                                                                        $      873                          $    1,391                         $    1,402                                      $     4,559                        $      4,702
   Operating income (loss)                                                                                            $     (431)                         $      143                         $       10                                      $      (461)                       $       (712)

Graphics (3)
    Net revenue                                                                                                             270                                 385                                295                                             1,165                                 992
    Operating income (loss)                                                                                                 (10)                                 47                                 15                                                12                                 (39)

All Other (4)
     Net revenue                                                                                                              19                                  21                                 40                                                84                                164
     Operating income (loss)                                                                                                (833)                                (68)                            (1,212)                                           (1,506)                            (1,559)

Total from Continuing Operations
    Net revenue                                                                                                       $ 1,162                             $    1,797                         $ 1,737                                         $ 5,808                            $ 5,858
    Operating income (loss)                                                                                           $ (1,274)                           $      122                         $ (1,187)                                       $ (1,955)                          $ (2,310)


Revenue Reconciliation

Revenue from continuing operations                                                                                    $    1,162                          $    1,797                         $    1,737                                      $     5,808                         $     5,858
Revenue from discontinued operations                                                                                           8                                  23                                 33                                               73                                 155
    Total revenue                                                                                                     $    1,170                          $    1,820                         $    1,770                                      $     5,881                         $     6,013

Components of Discontinued Operations

Operating income (loss)                                                                                               $      (10)                         $      (15)                        $        2                                      $        (74)                      $        (75)
Impairment of goodwill and acquired intangible assets                                                                        -                                  (135)                              (476)                                             (609)                              (476)
Restructuring charges                                                                                                        -                                   -                                  -                                                  (1)                               -
     Total loss from discontinued operations                                                                          $      (10)                         $     (150)                        $     (474)                                     $       (684)                      $       (551)


Other Data

Depreciation & amortization
    (excluding amortization of acquired intangible assets)                                                            $     271                           $     266                          $     272                                       $     1,068                         $     1,030

Capital additions                                                                                                     $     112                           $      83                          $     264                                       $       621                         $     1,683

Adjusted EBITDA (5)                                                                                                   $     (271)                         $     406                          $     206                                       $       313                        $        (64)


Headcount                                                                                                                 14,652                              15,460                             16,420                                           14,652                              16,420


(1) Comparative amounts adjusted for discontinued operations except for headcount data.
(2) Computing Solutions segment includes microprocessors, chipsets and embedded processors. For the year ended December 27, 2008 , the operating loss includes a $193M gain on the sale of 200 mm equipment. For the quarter ended Sept. 27, 2008 and year
    ended December 27, 2008, net revenue includes $191M in technology license revenue.
(3) Graphics segment includes graphics, video and multimedia products developed for use in desktop and notebook computers, including home media PCs, professional workstations and servers. Starting in the quarter ended June 28, 2008 this segment also includes
    royalties received in connection with the sale of game console systems that incorporate the Company’s graphics technology. Prior periods have been recast to conform to current period presentation.
(4) All Other category includes employee stock-based compensation expense and certain operating expenses and credits that are not allocated to the operating segments. Also included in this category are charges for the impairment of goodwill and acquired intangible
    assets, amortization of acquired intangible assets and integration, restructuring, severance; The Foundry Company formation costs; and the cost of fair value adjustment of acquired inventory. Details of these significant items are shown below. Starting in the
    quarter ended December 27, 2008, the All Other category includes the results of our Handheld business. Prior periods have been recast to conform to current period presentation.

       Significant items in All Other                                                                                                                                           Employee stock-based compensation expense:
                                                                                                    Quarter Ended                               Year Ended                                                                               Quarter Ended                             Year Ended
                                                                                               Q408     Q308      Q407                        FY08     FY07                                                                        Q408     Q308       Q407                       FY08     FY07
       Impairment of goodwill and acquired intangible assets                                                                                                                    Cost of sales
                                                                                             $   684 $        2 $ 1,132                      $ 1,089 $ 1,132                                                                      $    2$         2$        5                   $    10 $     11
       Amortization of acquired intangible assets and integration charges                         30         30      50                          137      236                   Research and development                              10         10       11                         44       50
       Restructuring charges                                                                      50          9        -                          90        -                   Marketing, general and administrative                  8          7       10                         23       48
       The Foundry Company formation costs                                                                                                                                                                                        $   20 $       19 $     26                    $    77 $ 109
                                                                                                  23          -        -                          23        -
       Cost of fair value adjustment of acquired inventory                                          -         -        -                            -      25
       Severance charges                                                                            -         -        -                            -      18
                                                                                             $   787 $       41 $ 1,182                      $ 1,339 $ 1,411

(5) Reconciliation of income (loss) from continuing operations to Adjusted EBITDA*
                                                                                                     Quarter Ended                               Year Ended
                                                                                              Q408       Q308      Q407                       FY08      FY07
       Income (loss) from continuing operations                                              $ (1,414) $      23 $ (1,298)                   $ (2,414) $ (2,828)
       Impairment of goodwill and acquired intangible assets                                      684          2    1,132                       1,089     1,132
       Depreciation and amortization                                                              271        266      272                       1,068     1,030
       Amortization of acquired intangible assets                                                  30         29       47                         136       208
       Interest expense                                                                            89         87       95                         366       367
       Provision (benefit) for income taxes                                                        69         (1)     (42)                         68        27
       Adjusted EBITDA                                                                       $ (271) $       406 $ 206                       $ 313 $        (64)

   *
       The Company defines Adjusted EBITDA as income (loss) from continuing operations adjusted for impairment of goodwill and acquired intangible assets, depreciation and amortization, amortization of acquired intangible assets, interest expense and taxes. The Company calculates and
       communicates Adjusted EBITDA because management believes it is of interest to investors and lenders in relation to its overall capital structure and its ability to borrow additional funds. The Company’s calculation of Adjusted EBITDA may or may not be consistent with the calculation of
       this measure by other companies in the same industry. Investors should not view Adjusted EBITDA as an alternative to the U.S. GAAP operating measure of net income (loss) or U.S. GAAP liquidity measures of cash flows from operating, investing and financing activities. In addition,
       Adjusted EBITDA does not take into account changes in certain assets and liabilities as well as interest and income taxes that can affect cash flows.

More Related Content

What's hot

conoco phillips 2004Fourth Quarter
conoco phillips 2004Fourth Quarterconoco phillips 2004Fourth Quarter
conoco phillips 2004Fourth Quarterfinance1
 
conoco phillips 2006Fourth Quarter
conoco phillips 2006Fourth Quarterconoco phillips 2006Fourth Quarter
conoco phillips 2006Fourth Quarterfinance1
 
el paso 22758BEF-CBE8-4368-BDC6-D02434EE5C13_EP_4Q08OpStatsFinal
el paso 22758BEF-CBE8-4368-BDC6-D02434EE5C13_EP_4Q08OpStatsFinalel paso 22758BEF-CBE8-4368-BDC6-D02434EE5C13_EP_4Q08OpStatsFinal
el paso 22758BEF-CBE8-4368-BDC6-D02434EE5C13_EP_4Q08OpStatsFinalfinance49
 
Conforming Wireless P&L for 12 Months Ending 9/30/07
 	Conforming Wireless P&L for 12 Months Ending 9/30/07 	Conforming Wireless P&L for 12 Months Ending 9/30/07
Conforming Wireless P&L for 12 Months Ending 9/30/07finance6
 
conoco phillips 2005Third Quarter
conoco phillips 2005Third Quarterconoco phillips 2005Third Quarter
conoco phillips 2005Third Quarterfinance1
 
4Q06OpStats_FNAL_022307
4Q06OpStats_FNAL_0223074Q06OpStats_FNAL_022307
4Q06OpStats_FNAL_022307finance49
 
Big_Lots_AR2003FSO
Big_Lots_AR2003FSOBig_Lots_AR2003FSO
Big_Lots_AR2003FSOfinance50
 
dover Q208_Supplement_r232g32g32g
dover Q208_Supplement_r232g32g32gdover Q208_Supplement_r232g32g32g
dover Q208_Supplement_r232g32g32gfinance30
 

What's hot (10)

conoco phillips 2004Fourth Quarter
conoco phillips 2004Fourth Quarterconoco phillips 2004Fourth Quarter
conoco phillips 2004Fourth Quarter
 
conoco phillips 2006Fourth Quarter
conoco phillips 2006Fourth Quarterconoco phillips 2006Fourth Quarter
conoco phillips 2006Fourth Quarter
 
4Q05OpStats
4Q05OpStats4Q05OpStats
4Q05OpStats
 
el paso 22758BEF-CBE8-4368-BDC6-D02434EE5C13_EP_4Q08OpStatsFinal
el paso 22758BEF-CBE8-4368-BDC6-D02434EE5C13_EP_4Q08OpStatsFinalel paso 22758BEF-CBE8-4368-BDC6-D02434EE5C13_EP_4Q08OpStatsFinal
el paso 22758BEF-CBE8-4368-BDC6-D02434EE5C13_EP_4Q08OpStatsFinal
 
Conforming Wireless P&L for 12 Months Ending 9/30/07
 	Conforming Wireless P&L for 12 Months Ending 9/30/07 	Conforming Wireless P&L for 12 Months Ending 9/30/07
Conforming Wireless P&L for 12 Months Ending 9/30/07
 
conoco phillips 2005Third Quarter
conoco phillips 2005Third Quarterconoco phillips 2005Third Quarter
conoco phillips 2005Third Quarter
 
Amd Q207 Financials
Amd Q207 FinancialsAmd Q207 Financials
Amd Q207 Financials
 
4Q06OpStats_FNAL_022307
4Q06OpStats_FNAL_0223074Q06OpStats_FNAL_022307
4Q06OpStats_FNAL_022307
 
Big_Lots_AR2003FSO
Big_Lots_AR2003FSOBig_Lots_AR2003FSO
Big_Lots_AR2003FSO
 
dover Q208_Supplement_r232g32g32g
dover Q208_Supplement_r232g32g32gdover Q208_Supplement_r232g32g32g
dover Q208_Supplement_r232g32g32g
 

Viewers also liked

WESCO_2004AR
WESCO_2004ARWESCO_2004AR
WESCO_2004ARfinance34
 
WESCO_2002AR
WESCO_2002ARWESCO_2002AR
WESCO_2002ARfinance34
 
AMD annual-1998
AMD annual-1998AMD annual-1998
AMD annual-1998finance34
 
WESCO_2000-proxy
WESCO_2000-proxyWESCO_2000-proxy
WESCO_2000-proxyfinance34
 
AMD-2008-Annual-Report
AMD-2008-Annual-ReportAMD-2008-Annual-Report
AMD-2008-Annual-Reportfinance34
 
WESCO_04-proxy
WESCO_04-proxyWESCO_04-proxy
WESCO_04-proxyfinance34
 
AMD-CompCharteramended2008final
AMD-CompCharteramended2008finalAMD-CompCharteramended2008final
AMD-CompCharteramended2008finalfinance34
 

Viewers also liked (8)

CHTR_AR05
CHTR_AR05CHTR_AR05
CHTR_AR05
 
WESCO_2004AR
WESCO_2004ARWESCO_2004AR
WESCO_2004AR
 
WESCO_2002AR
WESCO_2002ARWESCO_2002AR
WESCO_2002AR
 
AMD annual-1998
AMD annual-1998AMD annual-1998
AMD annual-1998
 
WESCO_2000-proxy
WESCO_2000-proxyWESCO_2000-proxy
WESCO_2000-proxy
 
AMD-2008-Annual-Report
AMD-2008-Annual-ReportAMD-2008-Annual-Report
AMD-2008-Annual-Report
 
WESCO_04-proxy
WESCO_04-proxyWESCO_04-proxy
WESCO_04-proxy
 
AMD-CompCharteramended2008final
AMD-CompCharteramended2008finalAMD-CompCharteramended2008final
AMD-CompCharteramended2008final
 

Similar to AMD-Q408Financials

advanced micro devices Q308Financials
advanced micro devices Q308Financialsadvanced micro devices Q308Financials
advanced micro devices Q308Financialsfinance34
 
advanced micro devices Q208Financials
advanced micro devices Q208Financialsadvanced micro devices Q208Financials
advanced micro devices Q208Financialsfinance34
 
advanced micro devices Q407Financials
advanced micro devices Q407Financialsadvanced micro devices Q407Financials
advanced micro devices Q407Financialsfinance34
 
Q1 2009 Earning Report of Advanced Micro Devices
Q1 2009 Earning Report of Advanced Micro DevicesQ1 2009 Earning Report of Advanced Micro Devices
Q1 2009 Earning Report of Advanced Micro Devicesearningreport earningreport
 
advanced micro devices ResultsQ406
advanced micro devices ResultsQ406advanced micro devices ResultsQ406
advanced micro devices ResultsQ406finance34
 
advanced micro devices Q307Financials
advanced micro devices Q307Financialsadvanced micro devices Q307Financials
advanced micro devices Q307Financialsfinance34
 
el paso 22758BEF-CBE8-4368-BDC6-D02434EE5C13_EP_4Q08OpStatsFinal
el paso 22758BEF-CBE8-4368-BDC6-D02434EE5C13_EP_4Q08OpStatsFinalel paso 22758BEF-CBE8-4368-BDC6-D02434EE5C13_EP_4Q08OpStatsFinal
el paso 22758BEF-CBE8-4368-BDC6-D02434EE5C13_EP_4Q08OpStatsFinalfinance49
 
22758BEF-CBE8-4368-BDC6-D02434EE5C13_EP_4Q08OpStatsFinal
22758BEF-CBE8-4368-BDC6-D02434EE5C13_EP_4Q08OpStatsFinal22758BEF-CBE8-4368-BDC6-D02434EE5C13_EP_4Q08OpStatsFinal
22758BEF-CBE8-4368-BDC6-D02434EE5C13_EP_4Q08OpStatsFinalfinance49
 
advanced micro devices Q207Financials
advanced micro devices Q207Financialsadvanced micro devices Q207Financials
advanced micro devices Q207Financialsfinance34
 
fredie mac financial-statement
fredie mac financial-statementfredie mac financial-statement
fredie mac financial-statementfinance6
 
4Q06OpStats_FNAL_022307
4Q06OpStats_FNAL_0223074Q06OpStats_FNAL_022307
4Q06OpStats_FNAL_022307finance49
 
Duke_Energy_2005_Annual_Report
Duke_Energy_2005_Annual_ReportDuke_Energy_2005_Annual_Report
Duke_Energy_2005_Annual_Reportfinance21
 
reliance steel & aluminum 2006_AnnualReport
reliance steel & aluminum  2006_AnnualReportreliance steel & aluminum  2006_AnnualReport
reliance steel & aluminum 2006_AnnualReportfinance32
 
dover Q308_Supplement
dover Q308_Supplementdover Q308_Supplement
dover Q308_Supplementfinance30
 
alltel 1q 07recons
alltel  1q 07reconsalltel  1q 07recons
alltel 1q 07reconsfinance27
 
2Q08_Op_Stats_Final
2Q08_Op_Stats_Final2Q08_Op_Stats_Final
2Q08_Op_Stats_Finalfinance49
 
2Q08_Op_Stats_Final
2Q08_Op_Stats_Final2Q08_Op_Stats_Final
2Q08_Op_Stats_Finalfinance49
 

Similar to AMD-Q408Financials (20)

advanced micro devices Q308Financials
advanced micro devices Q308Financialsadvanced micro devices Q308Financials
advanced micro devices Q308Financials
 
advanced micro devices Q208Financials
advanced micro devices Q208Financialsadvanced micro devices Q208Financials
advanced micro devices Q208Financials
 
advanced micro devices Q407Financials
advanced micro devices Q407Financialsadvanced micro devices Q407Financials
advanced micro devices Q407Financials
 
Q1 2009 Earning Report of Advanced Micro Devices
Q1 2009 Earning Report of Advanced Micro DevicesQ1 2009 Earning Report of Advanced Micro Devices
Q1 2009 Earning Report of Advanced Micro Devices
 
Amd Results Q406
Amd Results Q406Amd Results Q406
Amd Results Q406
 
advanced micro devices ResultsQ406
advanced micro devices ResultsQ406advanced micro devices ResultsQ406
advanced micro devices ResultsQ406
 
advanced micro devices Q307Financials
advanced micro devices Q307Financialsadvanced micro devices Q307Financials
advanced micro devices Q307Financials
 
Amd Q307 Financials
Amd Q307 FinancialsAmd Q307 Financials
Amd Q307 Financials
 
4Q05OpStats
4Q05OpStats4Q05OpStats
4Q05OpStats
 
el paso 22758BEF-CBE8-4368-BDC6-D02434EE5C13_EP_4Q08OpStatsFinal
el paso 22758BEF-CBE8-4368-BDC6-D02434EE5C13_EP_4Q08OpStatsFinalel paso 22758BEF-CBE8-4368-BDC6-D02434EE5C13_EP_4Q08OpStatsFinal
el paso 22758BEF-CBE8-4368-BDC6-D02434EE5C13_EP_4Q08OpStatsFinal
 
22758BEF-CBE8-4368-BDC6-D02434EE5C13_EP_4Q08OpStatsFinal
22758BEF-CBE8-4368-BDC6-D02434EE5C13_EP_4Q08OpStatsFinal22758BEF-CBE8-4368-BDC6-D02434EE5C13_EP_4Q08OpStatsFinal
22758BEF-CBE8-4368-BDC6-D02434EE5C13_EP_4Q08OpStatsFinal
 
advanced micro devices Q207Financials
advanced micro devices Q207Financialsadvanced micro devices Q207Financials
advanced micro devices Q207Financials
 
fredie mac financial-statement
fredie mac financial-statementfredie mac financial-statement
fredie mac financial-statement
 
4Q06OpStats_FNAL_022307
4Q06OpStats_FNAL_0223074Q06OpStats_FNAL_022307
4Q06OpStats_FNAL_022307
 
Duke_Energy_2005_Annual_Report
Duke_Energy_2005_Annual_ReportDuke_Energy_2005_Annual_Report
Duke_Energy_2005_Annual_Report
 
reliance steel & aluminum 2006_AnnualReport
reliance steel & aluminum  2006_AnnualReportreliance steel & aluminum  2006_AnnualReport
reliance steel & aluminum 2006_AnnualReport
 
dover Q308_Supplement
dover Q308_Supplementdover Q308_Supplement
dover Q308_Supplement
 
alltel 1q 07recons
alltel  1q 07reconsalltel  1q 07recons
alltel 1q 07recons
 
2Q08_Op_Stats_Final
2Q08_Op_Stats_Final2Q08_Op_Stats_Final
2Q08_Op_Stats_Final
 
2Q08_Op_Stats_Final
2Q08_Op_Stats_Final2Q08_Op_Stats_Final
2Q08_Op_Stats_Final
 

More from finance34

charter communications 1Qslides_FINAL
charter communications 1Qslides_FINALcharter communications 1Qslides_FINAL
charter communications 1Qslides_FINALfinance34
 
charter communications 1Qslides_FINAL
charter communications 1Qslides_FINALcharter communications 1Qslides_FINAL
charter communications 1Qslides_FINALfinance34
 
charter communications 2Q07_Slides
charter communications 2Q07_Slidescharter communications 2Q07_Slides
charter communications 2Q07_Slidesfinance34
 
charter communications 2Q07_Slides
charter communications 2Q07_Slidescharter communications 2Q07_Slides
charter communications 2Q07_Slidesfinance34
 
charter communications 4Q2007_Earnings_Presentation_vFINAL
charter communications 4Q2007_Earnings_Presentation_vFINALcharter communications 4Q2007_Earnings_Presentation_vFINAL
charter communications 4Q2007_Earnings_Presentation_vFINALfinance34
 
charter communications 4Q2007_Earnings_Presentation_vFINAL
charter communications 4Q2007_Earnings_Presentation_vFINALcharter communications 4Q2007_Earnings_Presentation_vFINAL
charter communications 4Q2007_Earnings_Presentation_vFINALfinance34
 
charter communications 1Q_2008_Earnings_Presentation
charter communications 1Q_2008_Earnings_Presentationcharter communications 1Q_2008_Earnings_Presentation
charter communications 1Q_2008_Earnings_Presentationfinance34
 
charter communications 1Q_2008_Earnings_Presentation
charter communications 1Q_2008_Earnings_Presentationcharter communications 1Q_2008_Earnings_Presentation
charter communications 1Q_2008_Earnings_Presentationfinance34
 
charter communications 2Q_2008_Earnings_Presentation_FINAL
charter communications 2Q_2008_Earnings_Presentation_FINALcharter communications 2Q_2008_Earnings_Presentation_FINAL
charter communications 2Q_2008_Earnings_Presentation_FINALfinance34
 
charter communications 2Q_2008_Earnings_Presentation_FINAL
charter communications 2Q_2008_Earnings_Presentation_FINALcharter communications 2Q_2008_Earnings_Presentation_FINAL
charter communications 2Q_2008_Earnings_Presentation_FINALfinance34
 
charter communications 3Q_2008_Earnings_Presentation_vFINAL
charter communications 3Q_2008_Earnings_Presentation_vFINALcharter communications 3Q_2008_Earnings_Presentation_vFINAL
charter communications 3Q_2008_Earnings_Presentation_vFINALfinance34
 
charter communications 3Q_2008_Earnings_Presentation_vFINAL
charter communications 3Q_2008_Earnings_Presentation_vFINALcharter communications 3Q_2008_Earnings_Presentation_vFINAL
charter communications 3Q_2008_Earnings_Presentation_vFINALfinance34
 
charter communications proxy00
charter communications proxy00charter communications proxy00
charter communications proxy00finance34
 
charter communications proxy00
charter communications proxy00charter communications proxy00
charter communications proxy00finance34
 
CHRT_000502__154_120
CHRT_000502__154_120CHRT_000502__154_120
CHRT_000502__154_120finance34
 
CHRT_000502__154_120
CHRT_000502__154_120CHRT_000502__154_120
CHRT_000502__154_120finance34
 
charter communications ar_00
charter communications ar_00charter communications ar_00
charter communications ar_00finance34
 
charter communications ar_00
charter communications ar_00charter communications ar_00
charter communications ar_00finance34
 

More from finance34 (20)

charter communications 1Qslides_FINAL
charter communications 1Qslides_FINALcharter communications 1Qslides_FINAL
charter communications 1Qslides_FINAL
 
charter communications 1Qslides_FINAL
charter communications 1Qslides_FINALcharter communications 1Qslides_FINAL
charter communications 1Qslides_FINAL
 
charter communications 2Q07_Slides
charter communications 2Q07_Slidescharter communications 2Q07_Slides
charter communications 2Q07_Slides
 
charter communications 2Q07_Slides
charter communications 2Q07_Slidescharter communications 2Q07_Slides
charter communications 2Q07_Slides
 
charter communications 4Q2007_Earnings_Presentation_vFINAL
charter communications 4Q2007_Earnings_Presentation_vFINALcharter communications 4Q2007_Earnings_Presentation_vFINAL
charter communications 4Q2007_Earnings_Presentation_vFINAL
 
charter communications 4Q2007_Earnings_Presentation_vFINAL
charter communications 4Q2007_Earnings_Presentation_vFINALcharter communications 4Q2007_Earnings_Presentation_vFINAL
charter communications 4Q2007_Earnings_Presentation_vFINAL
 
charter communications 1Q_2008_Earnings_Presentation
charter communications 1Q_2008_Earnings_Presentationcharter communications 1Q_2008_Earnings_Presentation
charter communications 1Q_2008_Earnings_Presentation
 
charter communications 1Q_2008_Earnings_Presentation
charter communications 1Q_2008_Earnings_Presentationcharter communications 1Q_2008_Earnings_Presentation
charter communications 1Q_2008_Earnings_Presentation
 
charter communications 2Q_2008_Earnings_Presentation_FINAL
charter communications 2Q_2008_Earnings_Presentation_FINALcharter communications 2Q_2008_Earnings_Presentation_FINAL
charter communications 2Q_2008_Earnings_Presentation_FINAL
 
charter communications 2Q_2008_Earnings_Presentation_FINAL
charter communications 2Q_2008_Earnings_Presentation_FINALcharter communications 2Q_2008_Earnings_Presentation_FINAL
charter communications 2Q_2008_Earnings_Presentation_FINAL
 
charter communications 3Q_2008_Earnings_Presentation_vFINAL
charter communications 3Q_2008_Earnings_Presentation_vFINALcharter communications 3Q_2008_Earnings_Presentation_vFINAL
charter communications 3Q_2008_Earnings_Presentation_vFINAL
 
charter communications 3Q_2008_Earnings_Presentation_vFINAL
charter communications 3Q_2008_Earnings_Presentation_vFINALcharter communications 3Q_2008_Earnings_Presentation_vFINAL
charter communications 3Q_2008_Earnings_Presentation_vFINAL
 
charter communications proxy00
charter communications proxy00charter communications proxy00
charter communications proxy00
 
charter communications proxy00
charter communications proxy00charter communications proxy00
charter communications proxy00
 
CHRT_000502__154_120
CHRT_000502__154_120CHRT_000502__154_120
CHRT_000502__154_120
 
CHRT_000502__154_120
CHRT_000502__154_120CHRT_000502__154_120
CHRT_000502__154_120
 
chtr_010502
chtr_010502chtr_010502
chtr_010502
 
chtr_010502
chtr_010502chtr_010502
chtr_010502
 
charter communications ar_00
charter communications ar_00charter communications ar_00
charter communications ar_00
 
charter communications ar_00
charter communications ar_00charter communications ar_00
charter communications ar_00
 

Recently uploaded

Guard Your Investments- Corporate Defaults Alarm.pdf
Guard Your Investments- Corporate Defaults Alarm.pdfGuard Your Investments- Corporate Defaults Alarm.pdf
Guard Your Investments- Corporate Defaults Alarm.pdfJasper Colin
 
10 QuickBooks Tips 2024 - Globus Finanza.pdf
10 QuickBooks Tips 2024 - Globus Finanza.pdf10 QuickBooks Tips 2024 - Globus Finanza.pdf
10 QuickBooks Tips 2024 - Globus Finanza.pdfglobusfinanza
 
Banking: Commercial and Central Banking.pptx
Banking: Commercial and Central Banking.pptxBanking: Commercial and Central Banking.pptx
Banking: Commercial and Central Banking.pptxANTHONYAKINYOSOYE1
 
Financial analysis on Risk and Return.ppt
Financial analysis on Risk and Return.pptFinancial analysis on Risk and Return.ppt
Financial analysis on Risk and Return.ppttadegebreyesus
 
Uae-NO1 Kala Jadu specialist Expert in Pakistan kala ilam specialist Expert i...
Uae-NO1 Kala Jadu specialist Expert in Pakistan kala ilam specialist Expert i...Uae-NO1 Kala Jadu specialist Expert in Pakistan kala ilam specialist Expert i...
Uae-NO1 Kala Jadu specialist Expert in Pakistan kala ilam specialist Expert i...Amil baba
 
AnyConv.com__FSS Advance Retail & Distribution - 15.06.17.ppt
AnyConv.com__FSS Advance Retail & Distribution - 15.06.17.pptAnyConv.com__FSS Advance Retail & Distribution - 15.06.17.ppt
AnyConv.com__FSS Advance Retail & Distribution - 15.06.17.pptPriyankaSharma89719
 
PMFBY , Pradhan Mantri Fasal bima yojna
PMFBY , Pradhan Mantri  Fasal bima yojnaPMFBY , Pradhan Mantri  Fasal bima yojna
PMFBY , Pradhan Mantri Fasal bima yojnaDharmendra Kumar
 
Money Forward Integrated Report “Forward Map” 2024
Money Forward Integrated Report “Forward Map” 2024Money Forward Integrated Report “Forward Map” 2024
Money Forward Integrated Report “Forward Map” 2024Money Forward
 
Liquidity Decisions in Financial management
Liquidity Decisions in Financial managementLiquidity Decisions in Financial management
Liquidity Decisions in Financial managementshrutisingh143670
 
Unit 4.1 financial markets operations .pdf
Unit 4.1 financial markets operations .pdfUnit 4.1 financial markets operations .pdf
Unit 4.1 financial markets operations .pdfSatyamSinghParihar2
 
Unveiling Poonawalla Fincorp’s Phenomenal Performance Under Abhay Bhutada’s L...
Unveiling Poonawalla Fincorp’s Phenomenal Performance Under Abhay Bhutada’s L...Unveiling Poonawalla Fincorp’s Phenomenal Performance Under Abhay Bhutada’s L...
Unveiling Poonawalla Fincorp’s Phenomenal Performance Under Abhay Bhutada’s L...beulahfernandes8
 
2024-04-09 - Pension Playpen roundtable - slides.pptx
2024-04-09 - Pension Playpen roundtable - slides.pptx2024-04-09 - Pension Playpen roundtable - slides.pptx
2024-04-09 - Pension Playpen roundtable - slides.pptxHenry Tapper
 
Uae-NO1 Black Magic Specialist In Lahore Black magic In Pakistan Kala Ilam Ex...
Uae-NO1 Black Magic Specialist In Lahore Black magic In Pakistan Kala Ilam Ex...Uae-NO1 Black Magic Specialist In Lahore Black magic In Pakistan Kala Ilam Ex...
Uae-NO1 Black Magic Specialist In Lahore Black magic In Pakistan Kala Ilam Ex...Amil baba
 
Introduction to Health Economics Dr. R. Kurinji Malar.pptx
Introduction to Health Economics Dr. R. Kurinji Malar.pptxIntroduction to Health Economics Dr. R. Kurinji Malar.pptx
Introduction to Health Economics Dr. R. Kurinji Malar.pptxDrRkurinjiMalarkurin
 
2024 Q1 Crypto Industry Report | CoinGecko
2024 Q1 Crypto Industry Report | CoinGecko2024 Q1 Crypto Industry Report | CoinGecko
2024 Q1 Crypto Industry Report | CoinGeckoCoinGecko
 
The AES Investment Code - the go-to counsel for the most well-informed, wise...
The AES Investment Code -  the go-to counsel for the most well-informed, wise...The AES Investment Code -  the go-to counsel for the most well-informed, wise...
The AES Investment Code - the go-to counsel for the most well-informed, wise...AES International
 
Financial Preparation for Millennia.pptx
Financial Preparation for Millennia.pptxFinancial Preparation for Millennia.pptx
Financial Preparation for Millennia.pptxsimon978302
 
NO1 Certified Black Magic Specialist Expert In Bahawalpur, Sargodha, Sialkot,...
NO1 Certified Black Magic Specialist Expert In Bahawalpur, Sargodha, Sialkot,...NO1 Certified Black Magic Specialist Expert In Bahawalpur, Sargodha, Sialkot,...
NO1 Certified Black Magic Specialist Expert In Bahawalpur, Sargodha, Sialkot,...Amil baba
 
NO1 Certified Amil Baba In Lahore Kala Jadu In Lahore Best Amil In Lahore Ami...
NO1 Certified Amil Baba In Lahore Kala Jadu In Lahore Best Amil In Lahore Ami...NO1 Certified Amil Baba In Lahore Kala Jadu In Lahore Best Amil In Lahore Ami...
NO1 Certified Amil Baba In Lahore Kala Jadu In Lahore Best Amil In Lahore Ami...Amil baba
 
The Inspirational Story of Julio Herrera Velutini - Global Finance Leader
The Inspirational Story of Julio Herrera Velutini - Global Finance LeaderThe Inspirational Story of Julio Herrera Velutini - Global Finance Leader
The Inspirational Story of Julio Herrera Velutini - Global Finance LeaderArianna Varetto
 

Recently uploaded (20)

Guard Your Investments- Corporate Defaults Alarm.pdf
Guard Your Investments- Corporate Defaults Alarm.pdfGuard Your Investments- Corporate Defaults Alarm.pdf
Guard Your Investments- Corporate Defaults Alarm.pdf
 
10 QuickBooks Tips 2024 - Globus Finanza.pdf
10 QuickBooks Tips 2024 - Globus Finanza.pdf10 QuickBooks Tips 2024 - Globus Finanza.pdf
10 QuickBooks Tips 2024 - Globus Finanza.pdf
 
Banking: Commercial and Central Banking.pptx
Banking: Commercial and Central Banking.pptxBanking: Commercial and Central Banking.pptx
Banking: Commercial and Central Banking.pptx
 
Financial analysis on Risk and Return.ppt
Financial analysis on Risk and Return.pptFinancial analysis on Risk and Return.ppt
Financial analysis on Risk and Return.ppt
 
Uae-NO1 Kala Jadu specialist Expert in Pakistan kala ilam specialist Expert i...
Uae-NO1 Kala Jadu specialist Expert in Pakistan kala ilam specialist Expert i...Uae-NO1 Kala Jadu specialist Expert in Pakistan kala ilam specialist Expert i...
Uae-NO1 Kala Jadu specialist Expert in Pakistan kala ilam specialist Expert i...
 
AnyConv.com__FSS Advance Retail & Distribution - 15.06.17.ppt
AnyConv.com__FSS Advance Retail & Distribution - 15.06.17.pptAnyConv.com__FSS Advance Retail & Distribution - 15.06.17.ppt
AnyConv.com__FSS Advance Retail & Distribution - 15.06.17.ppt
 
PMFBY , Pradhan Mantri Fasal bima yojna
PMFBY , Pradhan Mantri  Fasal bima yojnaPMFBY , Pradhan Mantri  Fasal bima yojna
PMFBY , Pradhan Mantri Fasal bima yojna
 
Money Forward Integrated Report “Forward Map” 2024
Money Forward Integrated Report “Forward Map” 2024Money Forward Integrated Report “Forward Map” 2024
Money Forward Integrated Report “Forward Map” 2024
 
Liquidity Decisions in Financial management
Liquidity Decisions in Financial managementLiquidity Decisions in Financial management
Liquidity Decisions in Financial management
 
Unit 4.1 financial markets operations .pdf
Unit 4.1 financial markets operations .pdfUnit 4.1 financial markets operations .pdf
Unit 4.1 financial markets operations .pdf
 
Unveiling Poonawalla Fincorp’s Phenomenal Performance Under Abhay Bhutada’s L...
Unveiling Poonawalla Fincorp’s Phenomenal Performance Under Abhay Bhutada’s L...Unveiling Poonawalla Fincorp’s Phenomenal Performance Under Abhay Bhutada’s L...
Unveiling Poonawalla Fincorp’s Phenomenal Performance Under Abhay Bhutada’s L...
 
2024-04-09 - Pension Playpen roundtable - slides.pptx
2024-04-09 - Pension Playpen roundtable - slides.pptx2024-04-09 - Pension Playpen roundtable - slides.pptx
2024-04-09 - Pension Playpen roundtable - slides.pptx
 
Uae-NO1 Black Magic Specialist In Lahore Black magic In Pakistan Kala Ilam Ex...
Uae-NO1 Black Magic Specialist In Lahore Black magic In Pakistan Kala Ilam Ex...Uae-NO1 Black Magic Specialist In Lahore Black magic In Pakistan Kala Ilam Ex...
Uae-NO1 Black Magic Specialist In Lahore Black magic In Pakistan Kala Ilam Ex...
 
Introduction to Health Economics Dr. R. Kurinji Malar.pptx
Introduction to Health Economics Dr. R. Kurinji Malar.pptxIntroduction to Health Economics Dr. R. Kurinji Malar.pptx
Introduction to Health Economics Dr. R. Kurinji Malar.pptx
 
2024 Q1 Crypto Industry Report | CoinGecko
2024 Q1 Crypto Industry Report | CoinGecko2024 Q1 Crypto Industry Report | CoinGecko
2024 Q1 Crypto Industry Report | CoinGecko
 
The AES Investment Code - the go-to counsel for the most well-informed, wise...
The AES Investment Code -  the go-to counsel for the most well-informed, wise...The AES Investment Code -  the go-to counsel for the most well-informed, wise...
The AES Investment Code - the go-to counsel for the most well-informed, wise...
 
Financial Preparation for Millennia.pptx
Financial Preparation for Millennia.pptxFinancial Preparation for Millennia.pptx
Financial Preparation for Millennia.pptx
 
NO1 Certified Black Magic Specialist Expert In Bahawalpur, Sargodha, Sialkot,...
NO1 Certified Black Magic Specialist Expert In Bahawalpur, Sargodha, Sialkot,...NO1 Certified Black Magic Specialist Expert In Bahawalpur, Sargodha, Sialkot,...
NO1 Certified Black Magic Specialist Expert In Bahawalpur, Sargodha, Sialkot,...
 
NO1 Certified Amil Baba In Lahore Kala Jadu In Lahore Best Amil In Lahore Ami...
NO1 Certified Amil Baba In Lahore Kala Jadu In Lahore Best Amil In Lahore Ami...NO1 Certified Amil Baba In Lahore Kala Jadu In Lahore Best Amil In Lahore Ami...
NO1 Certified Amil Baba In Lahore Kala Jadu In Lahore Best Amil In Lahore Ami...
 
The Inspirational Story of Julio Herrera Velutini - Global Finance Leader
The Inspirational Story of Julio Herrera Velutini - Global Finance LeaderThe Inspirational Story of Julio Herrera Velutini - Global Finance Leader
The Inspirational Story of Julio Herrera Velutini - Global Finance Leader
 

AMD-Q408Financials

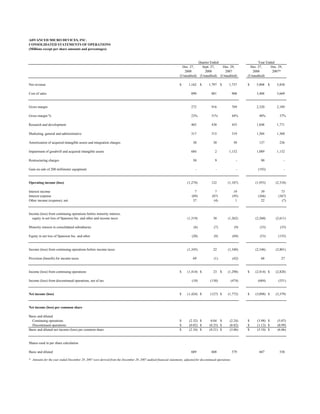
  • 1. ADVANCED MICRO DEVICES, INC. CONSOLIDATED STATEMENTS OF OPERATIONS (Millions except per share amounts and percentages) Quarter Ended Year Ended Dec. 27, Sept. 27, Dec. 29, Dec. 27, Dec. 29, 2008 2008 2007 2008 2007* (Unaudited) (Unaudited) (Unaudited) (Unaudited) Net revenue $ 1,162 $ 1,797 $ 1,737 $ 5,808 $ 5,858 Cost of sales 890 881 968 3,488 3,669 Gross margin 272 916 769 2,320 2,189 Gross margin % 23% 51% 44% 40% 37% Research and development 465 438 455 1,848 1,771 Marketing, general and administrative 317 315 319 1,304 1,360 Amortization of acquired intangible assets and integration charges 30 30 50 137 236 Impairment of goodwill and acquired intangible assets 684 2 1,132 1,089 1,132 Restructuring charges 50 9 - 90 - Gain on sale of 200 millimeter equipment - - - (193) - Operating income (loss) (1,274) 122 (1,187) (1,955) (2,310) Interest income 7 7 19 39 73 Interest expense (89) (87) (95) (366) (367) Other income (expense), net 37 (4) 1 22 (7) Income (loss) from continuing operations before minority interest, equity in net loss of Spansion Inc. and other and income taxes (1,319) 38 (1,262) (2,260) (2,611) Minority interest in consolidated subsidiaries (6) (7) (9) (33) (35) Equity in net loss of Spansion Inc. and other (20) (9) (69) (53) (155) Income (loss) from continuing operations before income taxes (1,345) 22 (1,340) (2,346) (2,801) Provision (benefit) for income taxes 69 (1) (42) 68 27 Income (loss) from continuing operations $ (1,414) $ 23 $ (1,298) $ (2,414) $ (2,828) Income (loss) from discontinued operations, net of tax (10) (150) (474) (684) (551) Net income (loss) $ (1,424) $ (127) $ (1,772) $ (3,098) $ (3,379) Net income (loss) per common share Basic and diluted Continuing operations $ (2.32) $ 0.04 $ (2.24) $ (3.98) $ (5.07) Discontinued operations $ (0.02) $ (0.25) $ (0.82) $ (1.12) $ (0.99) Basic and diluted net income (loss) per common share $ (2.34) $ (0.21) $ (3.06) $ (5.10) $ (6.06) Shares used in per share calculation Basic and diluted 609 608 579 607 558 * Amounts for the year ended December 29, 2007 were derived from the December 29, 2007 audited financial statements, adjusted for discontinued operations.
  • 2. ADVANCED MICRO DEVICES, INC. CONSOLIDATED BALANCE SHEETS (Millions) Dec. 27, Dec. 29, 2008 2007* (Unaudited) Assets Current assets: Cash, cash equivalents and marketable securities $ 1,096 $ 1,889 Accounts receivable, net 320 640 Inventories 656 810 Prepaid expenses and other current assets 279 401 Deferred income taxes 28 64 Assets of discontinued operations - 759 Total current assets 2,379 4,563 Property, plant and equipment, net 4,296 4,716 Goodwill 323 1,286 Acquisition related intangible assets, net 168 465 Other assets 509 520 Total Assets $ 7,675 $ 11,550 Liabilities and Stockholders' Equity (Deficit) Current liabilities: Accounts payable $ 631 $ 1,009 Accrued compensation and benefits 162 186 Accrued liabilities 785 821 Deferred income on shipments to distributors 50 101 Current portion of long-term debt and capital lease obligations 286 238 Other short-term obligations 86 - Other current liabilities 226 270 Total current liabilities 2,226 2,625 Deferred income taxes 91 6 Long-term debt and capital lease obligations, less current portion 4,702 5,031 Other long-term liabilities 569 633 Minority interest in consolidated subsidiaries 169 265 Stockholders' equity (deficit): Capital stock: Common stock, par value 6 6 Capital in excess of par value 6,002 5,921 Retained earnings (deficit) (6,198) (3,100) Accumulated other comprehensive income 108 163 Total stockholders' equity (deficit) (82) 2,990 Total Liabilities and Stockholders' Equity (Deficit) $ 7,675 $ 11,550 * Amounts for the year ended December 29, 2007 were derived from the December 29, 2007 audited financial statements, adjusted for discontinued operations.
  • 3. ADVANCED MICRO DEVICES, INC. SELECTED CORPORATE DATA (1) (Unaudited) (Millions except headcount and percentages) Quarter Ended Year Ended Dec. 27, Sept. 27, Dec. 29, Dec. 27, Dec. 29, Segment Information from Continuing Operations 2008 2008 2007 2008 2007 Computing Solutions (2) Net revenue $ 873 $ 1,391 $ 1,402 $ 4,559 $ 4,702 Operating income (loss) $ (431) $ 143 $ 10 $ (461) $ (712) Graphics (3) Net revenue 270 385 295 1,165 992 Operating income (loss) (10) 47 15 12 (39) All Other (4) Net revenue 19 21 40 84 164 Operating income (loss) (833) (68) (1,212) (1,506) (1,559) Total from Continuing Operations Net revenue $ 1,162 $ 1,797 $ 1,737 $ 5,808 $ 5,858 Operating income (loss) $ (1,274) $ 122 $ (1,187) $ (1,955) $ (2,310) Revenue Reconciliation Revenue from continuing operations $ 1,162 $ 1,797 $ 1,737 $ 5,808 $ 5,858 Revenue from discontinued operations 8 23 33 73 155 Total revenue $ 1,170 $ 1,820 $ 1,770 $ 5,881 $ 6,013 Components of Discontinued Operations Operating income (loss) $ (10) $ (15) $ 2 $ (74) $ (75) Impairment of goodwill and acquired intangible assets - (135) (476) (609) (476) Restructuring charges - - - (1) - Total loss from discontinued operations $ (10) $ (150) $ (474) $ (684) $ (551) Other Data Depreciation & amortization (excluding amortization of acquired intangible assets) $ 271 $ 266 $ 272 $ 1,068 $ 1,030 Capital additions $ 112 $ 83 $ 264 $ 621 $ 1,683 Adjusted EBITDA (5) $ (271) $ 406 $ 206 $ 313 $ (64) Headcount 14,652 15,460 16,420 14,652 16,420 (1) Comparative amounts adjusted for discontinued operations except for headcount data. (2) Computing Solutions segment includes microprocessors, chipsets and embedded processors. For the year ended December 27, 2008 , the operating loss includes a $193M gain on the sale of 200 mm equipment. For the quarter ended Sept. 27, 2008 and year ended December 27, 2008, net revenue includes $191M in technology license revenue. (3) Graphics segment includes graphics, video and multimedia products developed for use in desktop and notebook computers, including home media PCs, professional workstations and servers. Starting in the quarter ended June 28, 2008 this segment also includes royalties received in connection with the sale of game console systems that incorporate the Company’s graphics technology. Prior periods have been recast to conform to current period presentation. (4) All Other category includes employee stock-based compensation expense and certain operating expenses and credits that are not allocated to the operating segments. Also included in this category are charges for the impairment of goodwill and acquired intangible assets, amortization of acquired intangible assets and integration, restructuring, severance; The Foundry Company formation costs; and the cost of fair value adjustment of acquired inventory. Details of these significant items are shown below. Starting in the quarter ended December 27, 2008, the All Other category includes the results of our Handheld business. Prior periods have been recast to conform to current period presentation. Significant items in All Other Employee stock-based compensation expense: Quarter Ended Year Ended Quarter Ended Year Ended Q408 Q308 Q407 FY08 FY07 Q408 Q308 Q407 FY08 FY07 Impairment of goodwill and acquired intangible assets Cost of sales $ 684 $ 2 $ 1,132 $ 1,089 $ 1,132 $ 2$ 2$ 5 $ 10 $ 11 Amortization of acquired intangible assets and integration charges 30 30 50 137 236 Research and development 10 10 11 44 50 Restructuring charges 50 9 - 90 - Marketing, general and administrative 8 7 10 23 48 The Foundry Company formation costs $ 20 $ 19 $ 26 $ 77 $ 109 23 - - 23 - Cost of fair value adjustment of acquired inventory - - - - 25 Severance charges - - - - 18 $ 787 $ 41 $ 1,182 $ 1,339 $ 1,411 (5) Reconciliation of income (loss) from continuing operations to Adjusted EBITDA* Quarter Ended Year Ended Q408 Q308 Q407 FY08 FY07 Income (loss) from continuing operations $ (1,414) $ 23 $ (1,298) $ (2,414) $ (2,828) Impairment of goodwill and acquired intangible assets 684 2 1,132 1,089 1,132 Depreciation and amortization 271 266 272 1,068 1,030 Amortization of acquired intangible assets 30 29 47 136 208 Interest expense 89 87 95 366 367 Provision (benefit) for income taxes 69 (1) (42) 68 27 Adjusted EBITDA $ (271) $ 406 $ 206 $ 313 $ (64) * The Company defines Adjusted EBITDA as income (loss) from continuing operations adjusted for impairment of goodwill and acquired intangible assets, depreciation and amortization, amortization of acquired intangible assets, interest expense and taxes. The Company calculates and communicates Adjusted EBITDA because management believes it is of interest to investors and lenders in relation to its overall capital structure and its ability to borrow additional funds. The Company’s calculation of Adjusted EBITDA may or may not be consistent with the calculation of this measure by other companies in the same industry. Investors should not view Adjusted EBITDA as an alternative to the U.S. GAAP operating measure of net income (loss) or U.S. GAAP liquidity measures of cash flows from operating, investing and financing activities. In addition, Adjusted EBITDA does not take into account changes in certain assets and liabilities as well as interest and income taxes that can affect cash flows.