SlideShare una empresa de Scribd logo
1 de 10
Descargar para leer sin conexión
UNISYS CORPORATION
                     CONSOLIDATED STATEMENTS OF INCOME
                     (Millions, except per share data)

                                     Three Months            Six Months
                                    Ended June 30          Ended June 30
                                  ------------------     ------------------
                                    2004      2003         2004      2003
                                  -------- --------      -------- --------
Revenue
  Services                        $1,158.8 $1,163.4      $2,323.8 $2,270.4
  Technology                         229.3    261.6         527.2    553.5
                                  -------- --------      -------- --------
                                   1,388.1  1,425.0       2,851.0  2,823.9
Costs and expenses
  Cost of revenue:
    Services                         930.2      906.8     1,855.9    1,789.3
    Technology                        90.8      126.1       236.5      255.4
                                  --------   --------    --------   --------
                                   1,021.0    1,032.9     2,092.4    2,044.7
  Selling, general and
    administrative                   272.9      242.4       534.1      486.1
  Research and development            71.3       63.7       142.8      130.5
                                  --------   --------    --------   --------
                                   1,365.2    1,339.0     2,769.3    2,661.3
                                  --------   --------    --------   --------
Operating income                      22.9       86.0        81.7      162.6

Interest expense                      18.2      18.4        35.2       34.1
Other income
  (expense), net                      24.0       10.6        24.6        7.2
                                  --------   --------    --------   --------
Income before income taxes            28.7       78.2        71.1      135.7
Provision for income taxes             9.3       25.7        22.8       44.7
                                  --------   --------    --------   --------
Net income                           $19.4      $52.5       $48.3      $91.0
                                  ========   ========    ========   ========
Earnings per share
Basic                               $ .06      $ .16       $ .14      $ .28
                                  ========   ========    ========   ========
Diluted                             $ .06      $ .16       $ .14      $ .28
                                  ========   ========    ========   ========
Shares used in the per share
  computations (thousands):
  Basic                            334,411    328,783     333,567    327,996
                                  ========   ========    ========   ========
  Diluted                          338,767    331,149     338,407    329,987
                                  ========   ========    ========   ========
UNISYS CORPORATION
                        SEGMENT RESULTS
                           (Millions)

                                   Elimi-
                         Total     nations     Services    Technology
                        --------   --------    --------    ----------
Three Months Ended
June 30, 2004
------------------
Customer revenue       $1,388.1                $1,158.8       $229.3
Intersegment                         ($57.3)        4.5         52.8
                        --------    --------    --------     --------
Total revenue          $1,388.1      ($57.3)   $1,163.3       $282.1
                        ========    ========    ========     ========

Gross profit percent      26.4%                   18.5%        53.3%
                        ========                ========     ========
Operating profit
  percent                  1.6%                    0.7%         5.4%
                        ========                ========     ========
Three Months Ended
June 30, 2003
------------------
Customer revenue       $1,425.0                $1,163.4       $261.6
Intersegment                         ($89.2)        6.3         82.9
                        --------    --------    --------     --------
Total revenue          $1,425.0      ($89.2)   $1,169.7       $344.5
                        ========    ========    ========     ========

Gross profit percent      27.5%                   20.0%        46.6%
                        ========                ========     ========
Operating profit
  percent                  6.0%                    5.5%         7.8%
                        ========                ========     ========

Six Months Ended
June 30, 2004
------------------
Customer revenue       $2,851.0                $2,323.8       $527.2
Intersegment                        ($103.0)        9.3         93.7
                        --------    --------    --------     --------
Total revenue          $2,851.0     ($103.0)   $2,333.1       $620.9
                        ========    ========    ========     ========

Gross profit percent      26.6%                   18.8%        50.6%
                        ========                ========     ========
Operating profit
  percent                  2.9%                    1.6%         7.1%
                        ========                ========     ========
Six Months Ended
June 30, 2003
------------------
Customer revenue       $2,823.9                $2,270.4       $553.5
Intersegment                        ($159.2)       11.9        147.3
                        --------    --------    --------     --------
Total revenue          $2,823.9     ($159.2)   $2,282.3       $700.8
                        ========    ========    ========     ========

Gross profit percent      27.6%                   19.4%        48.3%
                        ========                ========     ========
Operating profit
  percent                  5.8%                    4.3%         9.5%
                        ========                ========     ========
UNISYS CORPORATION
                     CONSOLIDATED BALANCE SHEETS
                              (Millions)
                                             June 30,       December 31,
                                               2004             2003
                                            ----------       ----------
Assets
Current assets
  Cash and cash equivalents                        $643.4       $635.9
  Accounts and notes receivable, net                885.2      1,027.8
  Inventories
     Parts and finished equipment                112.7           121.7
     Work in process and materials               120.0           116.9
  Deferred income taxes                          272.4           270.0
  Other current assets                           106.4            85.7
                                            ----------      ----------
 Total                                         2,140.1         2,258.0
                                            ----------      ----------
Properties                                     1,347.4         1,352.7
  Less accumulated depreciation
    and amortization                             924.8           928.5
                                            ----------      ----------
 Properties, net                                 422.6           424.2
                                            ----------      ----------
Outsourcing assets, net                          529.9           477.5
Marketable software, net                         329.8           332.2
Investments at equity                            183.3           153.3
Prepaid pension cost                              49.6            55.5
Deferred income taxes                          1,385.7         1,384.6
Goodwill                                         186.6           177.5
Other long-term assets                           189.3           211.8
                                            ----------      ----------
 Total                                        $5,416.9        $5,474.6
                                            ==========      ==========
Liabilities and stockholders' equity
Current liabilities
  Notes payable                                  $10.4           $17.7
  Current maturities of long-term debt           150.7             2.2
  Accounts payable                               429.8           513.8
  Other accrued liabilities                    1,240.0         1,305.7
  Income taxes payable                           192.2           214.1
                                            ----------      ----------
 Total                                         2,023.1         2,053.5
                                            ----------      ----------
Long-term debt                                   901.8         1,048.3
Accrued pension liabilities                      460.1           433.6
Other long-term liabilities                      539.1           544.0
Stockholders' equity
  Common stock                                     3.4             3.3
  Accumulated deficit                           (366.4)         (414.8)
  Other capital                                3,856.9         3,818.6
  Accumulated other comprehensive loss        (2,001.1)       (2,011.9)
                                            ----------      ----------
 Stockholders' equity                          1,492.8         1,395.2
                                            ----------      ----------
 Total                                        $5,416.9        $5,474.6
                                            ==========      ==========
UNISYS CORPORATION
                  CONSOLIDATED STATEMENTS OF CASH FLOWS
                                (Millions)
                                                      Six Months Ended
                                                           June 30
                                                     -----------------
                                                      2004         2003
                                                      ----         ----
Cash flows from operating activities
Net income                                             $48.3        $91.0
Add (deduct) items to reconcile
  net income to net cash provided
  by operating activities:
Depreciation and amortization
  of properties and outsourcing assets                 123.1        105.4
Amortization of marketable software                     62.9         59.9
(Increase) in deferred income
  taxes, net                                            (2.4)        (1.5)
Decrease (increase) in receivables, net                185.3         (6.6)
Decrease in inventories                                  6.4         19.5
(Decrease) in accounts payable and
  other accrued liabilities                          (172.2)       (177.5)
(Decrease) increase in income
  taxes payable                                        (21.9)        17.5
Increase (decrease) in other liabilities                 3.5        (14.8)
(Increase) in other assets                             (27.8)       (39.1)
Other                                                    8.8         (5.6)
                                                     -------       -------
Net cash provided by operating activities              214.0         48.2
                                                     -------       -------
Cash flows from investing activities
  Proceeds from investments                         2,878.8      2,387.5
  Purchases of investments                         (2,879.0)    (2,421.7)
  Investment in marketable software                    (60.5)       (76.9)
  Capital additions of properties
    and outsourcing assets                           (143.5)       (112.0)
  Purchases of businesses                              (12.6)        (2.0)
                                                     -------       -------
Net cash used for investing activities               (216.8)       (225.1)
                                                     -------       -------
Cash flows from financing activities
  Net reduction in short-term borrowings               (10.6)       (59.6)
  Proceeds from employee stock plans                    24.0         13.9
  Payments of long-term debt                            (1.7)        (3.0)
  Proceeds from issuance of long-term debt                          293.3
                                                     -------       -------
Net cash provided by financing activities               11.7        244.6
                                                     -------       -------
Effect of exchange rate changes on cash
  and cash equivalents                                  (1.4)        12.3
                                                     -------       -------
Increase in cash and cash equivalents                    7.5         80.0
Cash and cash equivalents, beginning of
  period                                               635.9        301.8
                                                     -------       -------
Cash and cash equivalents, end of period             $643.4        $381.8
                                                     =======       =======
Reconciliation of GAAP to Non-GAAP
Financial Information

The preceding release presents information with and
without pension expense or income. Unisys believes
that this information will enhance an overall
understanding of its financial performance due to the
significant change in pension expense or income from
period to period and the non-operational nature of
pension expense or income. The presentation of
non-GAAP information is not meant to be considered in
isolation or as a substitute for results prepared in
accordance with accounting principles generally
accepted in the United States.
UNISYS CORPORATION
              RECONCILIATION OF GAAP TO NON-GAAP
               CONSOLIDATED STATEMENTS OF INCOME
               (Millions, except per share data)

                                       Three Months Ended
                                          June 30, 2004
                                 ----------------------------
                                   US GAAP     Less     Without
                                      as     Pension    Pension
                                  Reported Expense      Expense
                                  -------- -------- --------
Revenue                          $1,388.1             $1,388.1

Costs and expenses
  Cost of revenue                 1,021.0     ($17.8)    1,003.2
  Selling, general and
    administrative                  272.9        (4.8)   268.1
  Research and development            71.3       (2.2)    69.1
                                  --------   -------- --------
                                  1,365.2       (24.8) 1,340.4
                                  --------   -------- --------
Operating income                      22.9       24.8     47.7

Interest expense                     18.2                   18.2
Other income
  (expense), net                      24.0                   24.0
                                  --------   --------    --------
Income before income taxes           28.7       24.8        53.5
Provision for income taxes             9.3        7.9        17.2
                                  --------   --------    --------
Net income                          $19.4      $16.9       $36.3
                                  ========   ========    ========
Diluted earnings per share         $ .06      $ .05       $ .11
                                  ========   ========    ========

                                       Three Months Ended
                                          June 30, 2003
                                 ----------------------------
                                   US GAAP     Less     Without
                                      as     Pension    Pension
                                  Reported    Income     Income
                                  -------- -------- --------
Revenue                          $1,425.0             $1,425.0

Costs and expenses
  Cost of revenue                 1,032.9       $1.5     1,034.4
  Selling, general and
    administrative                  242.4         2.4    244.8
  Research and development            63.7        4.0     67.7
                                  --------   -------- --------
                                  1,339.0         7.9  1,346.9
                                  --------   -------- --------
Operating income                      86.0       (7.9)    78.1

Interest expense                     18.4                   18.4
Other income
  (expense), net                      10.6                   10.6
                                  --------   --------    --------
Income before income taxes           78.2       (7.9)       70.3
Provision for income taxes            25.7       (2.6)       23.1
                                  --------   --------    --------
Net income                          $52.5      ($5.3)      $47.2
                                  ========   ========    ========
Diluted earnings per share         $ .16     ($ .02)      $ .14
                                  ========   ========    ========
UNISYS CORPORATION
              RECONCILIATION OF GAAP TO NON-GAAP
               CONSOLIDATED STATEMENTS OF INCOME
               (Millions, except per share data)

                                         Six Months Ended
                                           June 30, 2004
                                 ----------------------------
                                   US GAAP      Less     Without
                                      as      Pension    Pension
                                  Reported Expense       Expense
                                  -------- -------- --------
Revenue                          $2,851.0              $2,851.0

Costs and expenses
  Cost of revenue                 2,092.4     ($33.3)    2,059.1
  Selling, general and
    administrative                  534.1        (9.7)   524.4
  Research and development          142.8        (4.0)   138.8
                                  --------   -------- --------
                                  2,769.3       (47.0) 2,722.3
                                  --------   -------- --------
Operating income                      81.7       47.0    128.7

Interest expense                     35.2                   35.2
Other income
  (expense), net                      24.6                   24.6
                                  --------   --------    --------
Income before income taxes           71.1       47.0       118.1
Provision for income taxes            22.8       15.0        37.8
                                  --------   --------    --------
Net income                          $48.3      $32.0       $80.3
                                  ========   ========    ========
Diluted earnings per share         $ .14      $ .10       $ .24
                                  ========   ========    ========

                                         Six Months Ended
                                           June 30, 2003
                                 ----------------------------
                                   US GAAP      Less     Without
                                      as      Pension    Pension
                                  Reported     Income     Income
                                  -------- -------- --------
Revenue                          $2,823.9              $2,823.9

Costs and expenses
  Cost of revenue                 2,044.7       $2.7     2,047.4
  Selling, general and
    administrative                  486.1         4.4    490.5
  Research and development          130.5         7.2    137.7
                                  --------   -------- --------
                                  2,661.3        14.3  2,675.6
                                  --------   -------- --------
Operating income                    162.6       (14.3)   148.3

Interest expense                     34.1                   34.1
Other income
  (expense), net                       7.2                    7.2
                                  --------   --------    --------
Income before income taxes          135.7      (14.3)      121.4
Provision for income taxes            44.7       (4.7)       40.0
                                  --------   --------    --------
Net income                          $91.0      ($9.6)      $81.4
                                  ========   ========    ========
Diluted earnings per share         $ .28     ($ .03)      $ .25
                                  ========   ========    ========
UNISYS CORPORATION
            RECONCILIATION OF GAAP TO NON-GAAP
               SEGMENT RESULTS OF OPERATIONS
                         (Millions)

                                   Three Months Ended
                                      June 30, 2004
                              ----------------------------
                                           Less     Without
                                  As     Pension    Pension
                               Reported Expense     Expense
                              -------- -------- --------
Services Segment
   Total revenue             $1,163.3             $1,163.3
   Gross profit                 214.9     ($17.4)    232.3
     % of revenue                18.5%                20.0%
   Operating income               8.2      (21.1)     29.3
     % of revenue                 0.7%                 2.5%

Technology Segment
   Total revenue                 282.1                 282.1
   Gross profit                  150.4      (0.4)      150.8
     % of revenue                 53.3%                 53.5%
   Operating income               15.1      (3.7)       18.8
     % of revenue                  5.4%                  6.7%

Total Company
   Total revenue              1,388.1                1,388.1
   Gross profit                 367.1      (17.8)      384.9
     % of revenue                26.4%                  27.7%
   Operating income              22.9      (24.8)       47.7
     % of revenue                 1.6%                   3.4%
                                   Three Months Ended
                                      June 30, 2003
                              ----------------------------
                                           Less     Without
                                  As     Pension    Pension
                               Reported   Income     Income
                              -------- -------- --------
Services Segment
   Total revenue             $1,169.7               $1,169.7
   Gross profit                 234.5       $0.7       233.8
     % of revenue                20.0%                  20.0%
   Operating income              64.1        3.2        60.9
     % of revenue                 5.5%                   5.2%

Technology Segment
   Total revenue                 344.5                 344.5
   Gross profit                  160.5       0.8       159.7
     % of revenue                 46.6%                 46.4%
   Operating income               26.8       4.7        22.1
     % of revenue                  7.8%                  6.4%

Total Company
   Total revenue              1,425.0                1,425.0
   Gross profit                 392.1        1.5       390.6
     % of revenue                27.5%                  27.4%
   Operating income              86.0        7.9        78.1
     % of revenue                 6.0%                   5.5%
UNISYS CORPORATION
            RECONCILIATION OF GAAP TO NON-GAAP
               SEGMENT RESULTS OF OPERATIONS
                         (Millions)

                                     Six Months Ended
                                       June 30, 2004
                              ----------------------------
                                            Less     Without
                                  As      Pension    Pension
                               Reported Expense      Expense
                              -------- -------- --------
Services Segment
   Total revenue             $2,333.1             $2,333.1
   Gross profit                 437.8     ($32.6)    470.4
     % of revenue                18.8%                20.2%
   Operating income              37.4      (40.4)     77.8
     % of revenue                 1.6%                 3.3%

Technology Segment
   Total revenue                 620.9                 620.9
   Gross profit                  314.2      (0.7)      314.9
     % of revenue                 50.6%                 50.7%
   Operating income               44.3      (6.6)       50.9
     % of revenue                  7.1%                  8.2%

Total Company
   Total revenue              2,851.0                2,851.0
   Gross profit                 758.6      (33.3)      791.9
     % of revenue                26.6%                  27.8%
   Operating income              81.7      (47.0)      128.7
     % of revenue                 2.9%                   4.5%
                                     Six Months Ended
                                       June 30, 2003
                              ----------------------------
                                            Less     Without
                                  As      Pension    Pension
                               Reported    Income     Income
                              -------- -------- --------
Services Segment
   Total revenue             $2,282.3               $2,282.3
   Gross profit                 442.9       $0.7       442.2
     % of revenue                19.4%                  19.4%
   Operating income              98.5        5.1        93.4
     % of revenue                 4.3%                   4.1%

Technology Segment
   Total revenue                 700.8                 700.8
   Gross profit                  338.6       2.0       336.6
     % of revenue                 48.3%                 48.0%
   Operating income               66.4       9.2        57.2
     % of revenue                  9.5%                  8.2%

Total Company
   Total revenue              2,823.9                2,823.9
   Gross profit                 779.2        2.7       776.5
     % of revenue                27.6%                  27.5%
   Operating income             162.6       14.3       148.3
     % of revenue                 5.8%                   5.3%
UNISYS CORPORATION
               RECONCILATION OF GAAP TO NON-GAAP
     FORWARD-LOOKING ESTIMATED DILUTED EARNINGS PER SHARE


                                           Three
                                           Months      Year
                                           Ending     Ending
                                          9/30/2004 12/31/2004
                                         ---------- ----------

Diluted earnings per share-
   on a GAAP basis                            .03-.07     .49-.53

Add back estimated pension expense,
   net of tax                                   .05           .19
                                          ---------     ---------
Diluted earnings per share-
   on a NON-GAAP basis
   (excluding pension expense)              .08-.12       .68-.72
                                          =========     =========

NOTE: See section in press release entitled
quot;Forward-Looking Statementsquot;.

Más contenido relacionado

La actualidad más candente

unisys 4Q07_SPR
unisys 4Q07_SPRunisys 4Q07_SPR
unisys 4Q07_SPRfinance36
 
unisys 4Q08_SPR
unisys 4Q08_SPRunisys 4Q08_SPR
unisys 4Q08_SPRfinance36
 
unisys 4Q05_SPR
unisys 4Q05_SPRunisys 4Q05_SPR
unisys 4Q05_SPRfinance36
 
unisys 4Q06_SPR
unisys 4Q06_SPRunisys 4Q06_SPR
unisys 4Q06_SPRfinance36
 
unisys 3Q05_SPR
unisys 3Q05_SPRunisys 3Q05_SPR
unisys 3Q05_SPRfinance36
 
unisys 1Q07_SPR
unisys 1Q07_SPRunisys 1Q07_SPR
unisys 1Q07_SPRfinance36
 
unisys 1Q04_SPR
unisys 1Q04_SPRunisys 1Q04_SPR
unisys 1Q04_SPRfinance36
 
unisys 1Q06_SPR
unisys 1Q06_SPRunisys 1Q06_SPR
unisys 1Q06_SPRfinance36
 
unisys 1Q08_SPR
unisys 1Q08_SPRunisys 1Q08_SPR
unisys 1Q08_SPRfinance36
 
unisys 1Q05_SPR
unisys 1Q05_SPRunisys 1Q05_SPR
unisys 1Q05_SPRfinance36
 
unisys 2001_2Q_10Q
unisys 2001_2Q_10Qunisys 2001_2Q_10Q
unisys 2001_2Q_10Qfinance36
 
unisys 2001_1Q_10Q
unisys 2001_1Q_10Qunisys 2001_1Q_10Q
unisys 2001_1Q_10Qfinance36
 
unisys 2002_3Q_10Q
unisys 2002_3Q_10Qunisys 2002_3Q_10Q
unisys 2002_3Q_10Qfinance36
 
unisys 2001_3Q_10Q
unisys 2001_3Q_10Qunisys 2001_3Q_10Q
unisys 2001_3Q_10Qfinance36
 
unisys 2002_2Q_10Q
unisys 2002_2Q_10Qunisys 2002_2Q_10Q
unisys 2002_2Q_10Qfinance36
 
advance auto parts 2003_ar
advance auto parts 2003_aradvance auto parts 2003_ar
advance auto parts 2003_arfinance48
 
unisys 2002_1Q_10Q
unisys 2002_1Q_10Qunisys 2002_1Q_10Q
unisys 2002_1Q_10Qfinance36
 
unisys 2005_2Q_10Q
unisys 2005_2Q_10Qunisys 2005_2Q_10Q
unisys 2005_2Q_10Qfinance36
 

La actualidad más candente (18)

unisys 4Q07_SPR
unisys 4Q07_SPRunisys 4Q07_SPR
unisys 4Q07_SPR
 
unisys 4Q08_SPR
unisys 4Q08_SPRunisys 4Q08_SPR
unisys 4Q08_SPR
 
unisys 4Q05_SPR
unisys 4Q05_SPRunisys 4Q05_SPR
unisys 4Q05_SPR
 
unisys 4Q06_SPR
unisys 4Q06_SPRunisys 4Q06_SPR
unisys 4Q06_SPR
 
unisys 3Q05_SPR
unisys 3Q05_SPRunisys 3Q05_SPR
unisys 3Q05_SPR
 
unisys 1Q07_SPR
unisys 1Q07_SPRunisys 1Q07_SPR
unisys 1Q07_SPR
 
unisys 1Q04_SPR
unisys 1Q04_SPRunisys 1Q04_SPR
unisys 1Q04_SPR
 
unisys 1Q06_SPR
unisys 1Q06_SPRunisys 1Q06_SPR
unisys 1Q06_SPR
 
unisys 1Q08_SPR
unisys 1Q08_SPRunisys 1Q08_SPR
unisys 1Q08_SPR
 
unisys 1Q05_SPR
unisys 1Q05_SPRunisys 1Q05_SPR
unisys 1Q05_SPR
 
unisys 2001_2Q_10Q
unisys 2001_2Q_10Qunisys 2001_2Q_10Q
unisys 2001_2Q_10Q
 
unisys 2001_1Q_10Q
unisys 2001_1Q_10Qunisys 2001_1Q_10Q
unisys 2001_1Q_10Q
 
unisys 2002_3Q_10Q
unisys 2002_3Q_10Qunisys 2002_3Q_10Q
unisys 2002_3Q_10Q
 
unisys 2001_3Q_10Q
unisys 2001_3Q_10Qunisys 2001_3Q_10Q
unisys 2001_3Q_10Q
 
unisys 2002_2Q_10Q
unisys 2002_2Q_10Qunisys 2002_2Q_10Q
unisys 2002_2Q_10Q
 
advance auto parts 2003_ar
advance auto parts 2003_aradvance auto parts 2003_ar
advance auto parts 2003_ar
 
unisys 2002_1Q_10Q
unisys 2002_1Q_10Qunisys 2002_1Q_10Q
unisys 2002_1Q_10Q
 
unisys 2005_2Q_10Q
unisys 2005_2Q_10Qunisys 2005_2Q_10Q
unisys 2005_2Q_10Q
 

Destacado

Digitalisaation vaikutus teollisuuden osaamistarpeisiin, Digi&Robo -koulutusv...
Digitalisaation vaikutus teollisuuden osaamistarpeisiin, Digi&Robo -koulutusv...Digitalisaation vaikutus teollisuuden osaamistarpeisiin, Digi&Robo -koulutusv...
Digitalisaation vaikutus teollisuuden osaamistarpeisiin, Digi&Robo -koulutusv...Timo Rainio
 
Campania pentru o alimentaţie sănătoasă
Campania pentru o alimentaţie sănătoasăCampania pentru o alimentaţie sănătoasă
Campania pentru o alimentaţie sănătoasăMihaela Anton
 

Destacado (7)

Always arthur
Always arthurAlways arthur
Always arthur
 
ElTrio 08 Web
ElTrio 08 WebElTrio 08 Web
ElTrio 08 Web
 
Digitalisaation vaikutus teollisuuden osaamistarpeisiin, Digi&Robo -koulutusv...
Digitalisaation vaikutus teollisuuden osaamistarpeisiin, Digi&Robo -koulutusv...Digitalisaation vaikutus teollisuuden osaamistarpeisiin, Digi&Robo -koulutusv...
Digitalisaation vaikutus teollisuuden osaamistarpeisiin, Digi&Robo -koulutusv...
 
Amy
AmyAmy
Amy
 
Alex
AlexAlex
Alex
 
CURSURI GRATUITE DE FORMARE PROFESIONALĂ
CURSURI GRATUITE DE FORMARE PROFESIONALĂCURSURI GRATUITE DE FORMARE PROFESIONALĂ
CURSURI GRATUITE DE FORMARE PROFESIONALĂ
 
Campania pentru o alimentaţie sănătoasă
Campania pentru o alimentaţie sănătoasăCampania pentru o alimentaţie sănătoasă
Campania pentru o alimentaţie sănătoasă
 

Similar a Unisys reports Q2 2004 revenue of $1.4B

qwest communications Q_3Q07_Historical_v2
qwest communications Q_3Q07_Historical_v2qwest communications Q_3Q07_Historical_v2
qwest communications Q_3Q07_Historical_v2finance19
 
qwest communications Q_4Q07_profile
qwest communications Q_4Q07_profileqwest communications Q_4Q07_profile
qwest communications Q_4Q07_profilefinance19
 
qwest communications Historical Quarterly Results1Q 06_2Q08
qwest communications Historical Quarterly Results1Q 06_2Q08qwest communications Historical Quarterly Results1Q 06_2Q08
qwest communications Historical Quarterly Results1Q 06_2Q08finance19
 
unisys 2Q04_10Q
unisys 2Q04_10Qunisys 2Q04_10Q
unisys 2Q04_10Qfinance36
 
qwest communications Historical Quarterly Results1Q 06_3Q08
qwest communications Historical Quarterly Results1Q 06_3Q08qwest communications Historical Quarterly Results1Q 06_3Q08
qwest communications Historical Quarterly Results1Q 06_3Q08finance19
 
qwest communications Q_2Q07_histres
qwest communications Q_2Q07_histresqwest communications Q_2Q07_histres
qwest communications Q_2Q07_histresfinance19
 
Mc Donald Financial Analysis Project
Mc Donald Financial Analysis Project Mc Donald Financial Analysis Project
Mc Donald Financial Analysis Project Mai Nguyen
 
Q1 2009 Earning Report of Weatherford International
Q1 2009 Earning Report of Weatherford InternationalQ1 2009 Earning Report of Weatherford International
Q1 2009 Earning Report of Weatherford Internationalearningreport earningreport
 
Q1 2009 Earning Report of Weatherford International
Q1 2009 Earning Report of Weatherford InternationalQ1 2009 Earning Report of Weatherford International
Q1 2009 Earning Report of Weatherford Internationalearningreport earningreport
 
qwest communications Q_1q08_profile_v2
qwest communications Q_1q08_profile_v2qwest communications Q_1q08_profile_v2
qwest communications Q_1q08_profile_v2finance19
 
Epsilon Energy Ltd. Announces 2012 Second Quarter Results
Epsilon Energy Ltd. Announces 2012 Second Quarter ResultsEpsilon Energy Ltd. Announces 2012 Second Quarter Results
Epsilon Energy Ltd. Announces 2012 Second Quarter ResultsRad Arnold
 
unisys 2005_3Q_10Q
unisys 2005_3Q_10Qunisys 2005_3Q_10Q
unisys 2005_3Q_10Qfinance36
 

Similar a Unisys reports Q2 2004 revenue of $1.4B (14)

qwest communications Q_3Q07_Historical_v2
qwest communications Q_3Q07_Historical_v2qwest communications Q_3Q07_Historical_v2
qwest communications Q_3Q07_Historical_v2
 
qwest communications Q_4Q07_profile
qwest communications Q_4Q07_profileqwest communications Q_4Q07_profile
qwest communications Q_4Q07_profile
 
qwest communications Historical Quarterly Results1Q 06_2Q08
qwest communications Historical Quarterly Results1Q 06_2Q08qwest communications Historical Quarterly Results1Q 06_2Q08
qwest communications Historical Quarterly Results1Q 06_2Q08
 
unisys 2Q04_10Q
unisys 2Q04_10Qunisys 2Q04_10Q
unisys 2Q04_10Q
 
Q1 2009 Earning Report of Stockeryale Inc.
Q1 2009 Earning Report of Stockeryale Inc.Q1 2009 Earning Report of Stockeryale Inc.
Q1 2009 Earning Report of Stockeryale Inc.
 
qwest communications Historical Quarterly Results1Q 06_3Q08
qwest communications Historical Quarterly Results1Q 06_3Q08qwest communications Historical Quarterly Results1Q 06_3Q08
qwest communications Historical Quarterly Results1Q 06_3Q08
 
qwest communications Q_2Q07_histres
qwest communications Q_2Q07_histresqwest communications Q_2Q07_histres
qwest communications Q_2Q07_histres
 
Mc Donald Financial Analysis Project
Mc Donald Financial Analysis Project Mc Donald Financial Analysis Project
Mc Donald Financial Analysis Project
 
Q1 2009 Earning Report of Weatherford International
Q1 2009 Earning Report of Weatherford InternationalQ1 2009 Earning Report of Weatherford International
Q1 2009 Earning Report of Weatherford International
 
Q1 2009 Earning Report of Weatherford International
Q1 2009 Earning Report of Weatherford InternationalQ1 2009 Earning Report of Weatherford International
Q1 2009 Earning Report of Weatherford International
 
qwest communications Q_1q08_profile_v2
qwest communications Q_1q08_profile_v2qwest communications Q_1q08_profile_v2
qwest communications Q_1q08_profile_v2
 
Epsilon Energy Ltd. Announces 2012 Second Quarter Results
Epsilon Energy Ltd. Announces 2012 Second Quarter ResultsEpsilon Energy Ltd. Announces 2012 Second Quarter Results
Epsilon Energy Ltd. Announces 2012 Second Quarter Results
 
Q1 2009 Earning Report of Sussex Bancorp
Q1 2009 Earning Report of Sussex BancorpQ1 2009 Earning Report of Sussex Bancorp
Q1 2009 Earning Report of Sussex Bancorp
 
unisys 2005_3Q_10Q
unisys 2005_3Q_10Qunisys 2005_3Q_10Q
unisys 2005_3Q_10Q
 

Más de finance36

unisys 2001_10K
unisys 2001_10Kunisys 2001_10K
unisys 2001_10Kfinance36
 
unisys 2002_10K
unisys 2002_10Kunisys 2002_10K
unisys 2002_10Kfinance36
 
unisys 2003_1Q_10Q
unisys 2003_1Q_10Qunisys 2003_1Q_10Q
unisys 2003_1Q_10Qfinance36
 
unisys 2003_2Q_10Q
unisys 2003_2Q_10Qunisys 2003_2Q_10Q
unisys 2003_2Q_10Qfinance36
 
unisys 2003_3Q_10Q
unisys 2003_3Q_10Qunisys 2003_3Q_10Q
unisys 2003_3Q_10Qfinance36
 
unisys 2003_4Q_10K
unisys 2003_4Q_10Kunisys 2003_4Q_10K
unisys 2003_4Q_10Kfinance36
 
unisys 1Q04_10Q
unisys 1Q04_10Qunisys 1Q04_10Q
unisys 1Q04_10Qfinance36
 
unisys 3Q04_10Q
unisys 3Q04_10Qunisys 3Q04_10Q
unisys 3Q04_10Qfinance36
 
unisys 2004_4Q_10K
unisys 2004_4Q_10Kunisys 2004_4Q_10K
unisys 2004_4Q_10Kfinance36
 
unisys 2005_1Q_10Q
unisys 2005_1Q_10Qunisys 2005_1Q_10Q
unisys 2005_1Q_10Qfinance36
 
unisys 2Q04_SPR
unisys 2Q04_SPRunisys 2Q04_SPR
unisys 2Q04_SPRfinance36
 
unisys 2Q04_SPR
unisys 2Q04_SPRunisys 2Q04_SPR
unisys 2Q04_SPRfinance36
 
unisys 2005_4Q_10K
unisys 2005_4Q_10Kunisys 2005_4Q_10K
unisys 2005_4Q_10Kfinance36
 
unisys 2006_1Q_10Q
unisys 2006_1Q_10Qunisys 2006_1Q_10Q
unisys 2006_1Q_10Qfinance36
 

Más de finance36 (14)

unisys 2001_10K
unisys 2001_10Kunisys 2001_10K
unisys 2001_10K
 
unisys 2002_10K
unisys 2002_10Kunisys 2002_10K
unisys 2002_10K
 
unisys 2003_1Q_10Q
unisys 2003_1Q_10Qunisys 2003_1Q_10Q
unisys 2003_1Q_10Q
 
unisys 2003_2Q_10Q
unisys 2003_2Q_10Qunisys 2003_2Q_10Q
unisys 2003_2Q_10Q
 
unisys 2003_3Q_10Q
unisys 2003_3Q_10Qunisys 2003_3Q_10Q
unisys 2003_3Q_10Q
 
unisys 2003_4Q_10K
unisys 2003_4Q_10Kunisys 2003_4Q_10K
unisys 2003_4Q_10K
 
unisys 1Q04_10Q
unisys 1Q04_10Qunisys 1Q04_10Q
unisys 1Q04_10Q
 
unisys 3Q04_10Q
unisys 3Q04_10Qunisys 3Q04_10Q
unisys 3Q04_10Q
 
unisys 2004_4Q_10K
unisys 2004_4Q_10Kunisys 2004_4Q_10K
unisys 2004_4Q_10K
 
unisys 2005_1Q_10Q
unisys 2005_1Q_10Qunisys 2005_1Q_10Q
unisys 2005_1Q_10Q
 
unisys 2Q04_SPR
unisys 2Q04_SPRunisys 2Q04_SPR
unisys 2Q04_SPR
 
unisys 2Q04_SPR
unisys 2Q04_SPRunisys 2Q04_SPR
unisys 2Q04_SPR
 
unisys 2005_4Q_10K
unisys 2005_4Q_10Kunisys 2005_4Q_10K
unisys 2005_4Q_10K
 
unisys 2006_1Q_10Q
unisys 2006_1Q_10Qunisys 2006_1Q_10Q
unisys 2006_1Q_10Q
 

Último

magnetic-pensions-a-new-blueprint-for-the-dc-landscape.pdf
magnetic-pensions-a-new-blueprint-for-the-dc-landscape.pdfmagnetic-pensions-a-new-blueprint-for-the-dc-landscape.pdf
magnetic-pensions-a-new-blueprint-for-the-dc-landscape.pdfHenry Tapper
 
(中央兰开夏大学毕业证学位证成绩单-案例)
(中央兰开夏大学毕业证学位证成绩单-案例)(中央兰开夏大学毕业证学位证成绩单-案例)
(中央兰开夏大学毕业证学位证成绩单-案例)twfkn8xj
 
Unveiling Business Expansion Trends in 2024
Unveiling Business Expansion Trends in 2024Unveiling Business Expansion Trends in 2024
Unveiling Business Expansion Trends in 2024Champak Jhagmag
 
Economic Risk Factor Update: April 2024 [SlideShare]
Economic Risk Factor Update: April 2024 [SlideShare]Economic Risk Factor Update: April 2024 [SlideShare]
Economic Risk Factor Update: April 2024 [SlideShare]Commonwealth
 
Financial analysis on Risk and Return.ppt
Financial analysis on Risk and Return.pptFinancial analysis on Risk and Return.ppt
Financial analysis on Risk and Return.ppttadegebreyesus
 
原版1:1复刻温哥华岛大学毕业证Vancouver毕业证留信学历认证
原版1:1复刻温哥华岛大学毕业证Vancouver毕业证留信学历认证原版1:1复刻温哥华岛大学毕业证Vancouver毕业证留信学历认证
原版1:1复刻温哥华岛大学毕业证Vancouver毕业证留信学历认证rjrjkk
 
SBP-Market-Operations and market managment
SBP-Market-Operations and market managmentSBP-Market-Operations and market managment
SBP-Market-Operations and market managmentfactical
 
NO1 Certified kala jadu karne wale ka contact number kala jadu karne wale bab...
NO1 Certified kala jadu karne wale ka contact number kala jadu karne wale bab...NO1 Certified kala jadu karne wale ka contact number kala jadu karne wale bab...
NO1 Certified kala jadu karne wale ka contact number kala jadu karne wale bab...Amil baba
 
Vp Girls near me Delhi Call Now or WhatsApp
Vp Girls near me Delhi Call Now or WhatsAppVp Girls near me Delhi Call Now or WhatsApp
Vp Girls near me Delhi Call Now or WhatsAppmiss dipika
 
cost of capital questions financial management
cost of capital questions financial managementcost of capital questions financial management
cost of capital questions financial managementtanmayarora23
 
Call Girls Near Delhi Pride Hotel, New Delhi|9873777170
Call Girls Near Delhi Pride Hotel, New Delhi|9873777170Call Girls Near Delhi Pride Hotel, New Delhi|9873777170
Call Girls Near Delhi Pride Hotel, New Delhi|9873777170Sonam Pathan
 
Call Girls Near Golden Tulip Essential Hotel, New Delhi 9873777170
Call Girls Near Golden Tulip Essential Hotel, New Delhi 9873777170Call Girls Near Golden Tulip Essential Hotel, New Delhi 9873777170
Call Girls Near Golden Tulip Essential Hotel, New Delhi 9873777170Sonam Pathan
 
Uae-NO1 Kala Jadu specialist Expert in Pakistan kala ilam specialist Expert i...
Uae-NO1 Kala Jadu specialist Expert in Pakistan kala ilam specialist Expert i...Uae-NO1 Kala Jadu specialist Expert in Pakistan kala ilam specialist Expert i...
Uae-NO1 Kala Jadu specialist Expert in Pakistan kala ilam specialist Expert i...Amil baba
 
AnyConv.com__FSS Advance Retail & Distribution - 15.06.17.ppt
AnyConv.com__FSS Advance Retail & Distribution - 15.06.17.pptAnyConv.com__FSS Advance Retail & Distribution - 15.06.17.ppt
AnyConv.com__FSS Advance Retail & Distribution - 15.06.17.pptPriyankaSharma89719
 
NO1 WorldWide Genuine vashikaran specialist Vashikaran baba near Lahore Vashi...
NO1 WorldWide Genuine vashikaran specialist Vashikaran baba near Lahore Vashi...NO1 WorldWide Genuine vashikaran specialist Vashikaran baba near Lahore Vashi...
NO1 WorldWide Genuine vashikaran specialist Vashikaran baba near Lahore Vashi...Amil baba
 
The Triple Threat | Article on Global Resession | Harsh Kumar
The Triple Threat | Article on Global Resession | Harsh KumarThe Triple Threat | Article on Global Resession | Harsh Kumar
The Triple Threat | Article on Global Resession | Harsh KumarHarsh Kumar
 
House of Commons ; CDC schemes overview document
House of Commons ; CDC schemes overview documentHouse of Commons ; CDC schemes overview document
House of Commons ; CDC schemes overview documentHenry Tapper
 
Uae-NO1 Black Magic Specialist In Lahore Black magic In Pakistan Kala Ilam Ex...
Uae-NO1 Black Magic Specialist In Lahore Black magic In Pakistan Kala Ilam Ex...Uae-NO1 Black Magic Specialist In Lahore Black magic In Pakistan Kala Ilam Ex...
Uae-NO1 Black Magic Specialist In Lahore Black magic In Pakistan Kala Ilam Ex...Amil baba
 
Bladex 1Q24 Earning Results Presentation
Bladex 1Q24 Earning Results PresentationBladex 1Q24 Earning Results Presentation
Bladex 1Q24 Earning Results PresentationBladex
 
Tenets of Physiocracy History of Economic
Tenets of Physiocracy History of EconomicTenets of Physiocracy History of Economic
Tenets of Physiocracy History of Economiccinemoviesu
 

Último (20)

magnetic-pensions-a-new-blueprint-for-the-dc-landscape.pdf
magnetic-pensions-a-new-blueprint-for-the-dc-landscape.pdfmagnetic-pensions-a-new-blueprint-for-the-dc-landscape.pdf
magnetic-pensions-a-new-blueprint-for-the-dc-landscape.pdf
 
(中央兰开夏大学毕业证学位证成绩单-案例)
(中央兰开夏大学毕业证学位证成绩单-案例)(中央兰开夏大学毕业证学位证成绩单-案例)
(中央兰开夏大学毕业证学位证成绩单-案例)
 
Unveiling Business Expansion Trends in 2024
Unveiling Business Expansion Trends in 2024Unveiling Business Expansion Trends in 2024
Unveiling Business Expansion Trends in 2024
 
Economic Risk Factor Update: April 2024 [SlideShare]
Economic Risk Factor Update: April 2024 [SlideShare]Economic Risk Factor Update: April 2024 [SlideShare]
Economic Risk Factor Update: April 2024 [SlideShare]
 
Financial analysis on Risk and Return.ppt
Financial analysis on Risk and Return.pptFinancial analysis on Risk and Return.ppt
Financial analysis on Risk and Return.ppt
 
原版1:1复刻温哥华岛大学毕业证Vancouver毕业证留信学历认证
原版1:1复刻温哥华岛大学毕业证Vancouver毕业证留信学历认证原版1:1复刻温哥华岛大学毕业证Vancouver毕业证留信学历认证
原版1:1复刻温哥华岛大学毕业证Vancouver毕业证留信学历认证
 
SBP-Market-Operations and market managment
SBP-Market-Operations and market managmentSBP-Market-Operations and market managment
SBP-Market-Operations and market managment
 
NO1 Certified kala jadu karne wale ka contact number kala jadu karne wale bab...
NO1 Certified kala jadu karne wale ka contact number kala jadu karne wale bab...NO1 Certified kala jadu karne wale ka contact number kala jadu karne wale bab...
NO1 Certified kala jadu karne wale ka contact number kala jadu karne wale bab...
 
Vp Girls near me Delhi Call Now or WhatsApp
Vp Girls near me Delhi Call Now or WhatsAppVp Girls near me Delhi Call Now or WhatsApp
Vp Girls near me Delhi Call Now or WhatsApp
 
cost of capital questions financial management
cost of capital questions financial managementcost of capital questions financial management
cost of capital questions financial management
 
Call Girls Near Delhi Pride Hotel, New Delhi|9873777170
Call Girls Near Delhi Pride Hotel, New Delhi|9873777170Call Girls Near Delhi Pride Hotel, New Delhi|9873777170
Call Girls Near Delhi Pride Hotel, New Delhi|9873777170
 
Call Girls Near Golden Tulip Essential Hotel, New Delhi 9873777170
Call Girls Near Golden Tulip Essential Hotel, New Delhi 9873777170Call Girls Near Golden Tulip Essential Hotel, New Delhi 9873777170
Call Girls Near Golden Tulip Essential Hotel, New Delhi 9873777170
 
Uae-NO1 Kala Jadu specialist Expert in Pakistan kala ilam specialist Expert i...
Uae-NO1 Kala Jadu specialist Expert in Pakistan kala ilam specialist Expert i...Uae-NO1 Kala Jadu specialist Expert in Pakistan kala ilam specialist Expert i...
Uae-NO1 Kala Jadu specialist Expert in Pakistan kala ilam specialist Expert i...
 
AnyConv.com__FSS Advance Retail & Distribution - 15.06.17.ppt
AnyConv.com__FSS Advance Retail & Distribution - 15.06.17.pptAnyConv.com__FSS Advance Retail & Distribution - 15.06.17.ppt
AnyConv.com__FSS Advance Retail & Distribution - 15.06.17.ppt
 
NO1 WorldWide Genuine vashikaran specialist Vashikaran baba near Lahore Vashi...
NO1 WorldWide Genuine vashikaran specialist Vashikaran baba near Lahore Vashi...NO1 WorldWide Genuine vashikaran specialist Vashikaran baba near Lahore Vashi...
NO1 WorldWide Genuine vashikaran specialist Vashikaran baba near Lahore Vashi...
 
The Triple Threat | Article on Global Resession | Harsh Kumar
The Triple Threat | Article on Global Resession | Harsh KumarThe Triple Threat | Article on Global Resession | Harsh Kumar
The Triple Threat | Article on Global Resession | Harsh Kumar
 
House of Commons ; CDC schemes overview document
House of Commons ; CDC schemes overview documentHouse of Commons ; CDC schemes overview document
House of Commons ; CDC schemes overview document
 
Uae-NO1 Black Magic Specialist In Lahore Black magic In Pakistan Kala Ilam Ex...
Uae-NO1 Black Magic Specialist In Lahore Black magic In Pakistan Kala Ilam Ex...Uae-NO1 Black Magic Specialist In Lahore Black magic In Pakistan Kala Ilam Ex...
Uae-NO1 Black Magic Specialist In Lahore Black magic In Pakistan Kala Ilam Ex...
 
Bladex 1Q24 Earning Results Presentation
Bladex 1Q24 Earning Results PresentationBladex 1Q24 Earning Results Presentation
Bladex 1Q24 Earning Results Presentation
 
Tenets of Physiocracy History of Economic
Tenets of Physiocracy History of EconomicTenets of Physiocracy History of Economic
Tenets of Physiocracy History of Economic
 

Unisys reports Q2 2004 revenue of $1.4B

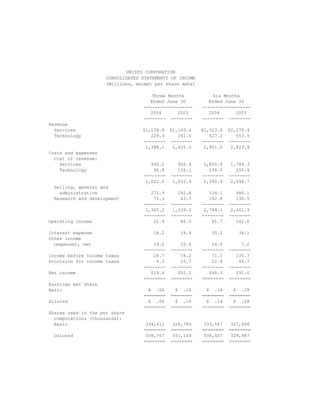
  • 1. UNISYS CORPORATION CONSOLIDATED STATEMENTS OF INCOME (Millions, except per share data) Three Months Six Months Ended June 30 Ended June 30 ------------------ ------------------ 2004 2003 2004 2003 -------- -------- -------- -------- Revenue Services $1,158.8 $1,163.4 $2,323.8 $2,270.4 Technology 229.3 261.6 527.2 553.5 -------- -------- -------- -------- 1,388.1 1,425.0 2,851.0 2,823.9 Costs and expenses Cost of revenue: Services 930.2 906.8 1,855.9 1,789.3 Technology 90.8 126.1 236.5 255.4 -------- -------- -------- -------- 1,021.0 1,032.9 2,092.4 2,044.7 Selling, general and administrative 272.9 242.4 534.1 486.1 Research and development 71.3 63.7 142.8 130.5 -------- -------- -------- -------- 1,365.2 1,339.0 2,769.3 2,661.3 -------- -------- -------- -------- Operating income 22.9 86.0 81.7 162.6 Interest expense 18.2 18.4 35.2 34.1 Other income (expense), net 24.0 10.6 24.6 7.2 -------- -------- -------- -------- Income before income taxes 28.7 78.2 71.1 135.7 Provision for income taxes 9.3 25.7 22.8 44.7 -------- -------- -------- -------- Net income $19.4 $52.5 $48.3 $91.0 ======== ======== ======== ======== Earnings per share Basic $ .06 $ .16 $ .14 $ .28 ======== ======== ======== ======== Diluted $ .06 $ .16 $ .14 $ .28 ======== ======== ======== ======== Shares used in the per share computations (thousands): Basic 334,411 328,783 333,567 327,996 ======== ======== ======== ======== Diluted 338,767 331,149 338,407 329,987 ======== ======== ======== ========
  • 2. UNISYS CORPORATION SEGMENT RESULTS (Millions) Elimi- Total nations Services Technology -------- -------- -------- ---------- Three Months Ended June 30, 2004 ------------------ Customer revenue $1,388.1 $1,158.8 $229.3 Intersegment ($57.3) 4.5 52.8 -------- -------- -------- -------- Total revenue $1,388.1 ($57.3) $1,163.3 $282.1 ======== ======== ======== ======== Gross profit percent 26.4% 18.5% 53.3% ======== ======== ======== Operating profit percent 1.6% 0.7% 5.4% ======== ======== ======== Three Months Ended June 30, 2003 ------------------ Customer revenue $1,425.0 $1,163.4 $261.6 Intersegment ($89.2) 6.3 82.9 -------- -------- -------- -------- Total revenue $1,425.0 ($89.2) $1,169.7 $344.5 ======== ======== ======== ======== Gross profit percent 27.5% 20.0% 46.6% ======== ======== ======== Operating profit percent 6.0% 5.5% 7.8% ======== ======== ======== Six Months Ended June 30, 2004 ------------------ Customer revenue $2,851.0 $2,323.8 $527.2 Intersegment ($103.0) 9.3 93.7 -------- -------- -------- -------- Total revenue $2,851.0 ($103.0) $2,333.1 $620.9 ======== ======== ======== ======== Gross profit percent 26.6% 18.8% 50.6% ======== ======== ======== Operating profit percent 2.9% 1.6% 7.1% ======== ======== ======== Six Months Ended June 30, 2003 ------------------ Customer revenue $2,823.9 $2,270.4 $553.5 Intersegment ($159.2) 11.9 147.3 -------- -------- -------- -------- Total revenue $2,823.9 ($159.2) $2,282.3 $700.8 ======== ======== ======== ======== Gross profit percent 27.6% 19.4% 48.3% ======== ======== ======== Operating profit percent 5.8% 4.3% 9.5% ======== ======== ========
  • 3. UNISYS CORPORATION CONSOLIDATED BALANCE SHEETS (Millions) June 30, December 31, 2004 2003 ---------- ---------- Assets Current assets Cash and cash equivalents $643.4 $635.9 Accounts and notes receivable, net 885.2 1,027.8 Inventories Parts and finished equipment 112.7 121.7 Work in process and materials 120.0 116.9 Deferred income taxes 272.4 270.0 Other current assets 106.4 85.7 ---------- ---------- Total 2,140.1 2,258.0 ---------- ---------- Properties 1,347.4 1,352.7 Less accumulated depreciation and amortization 924.8 928.5 ---------- ---------- Properties, net 422.6 424.2 ---------- ---------- Outsourcing assets, net 529.9 477.5 Marketable software, net 329.8 332.2 Investments at equity 183.3 153.3 Prepaid pension cost 49.6 55.5 Deferred income taxes 1,385.7 1,384.6 Goodwill 186.6 177.5 Other long-term assets 189.3 211.8 ---------- ---------- Total $5,416.9 $5,474.6 ========== ========== Liabilities and stockholders' equity Current liabilities Notes payable $10.4 $17.7 Current maturities of long-term debt 150.7 2.2 Accounts payable 429.8 513.8 Other accrued liabilities 1,240.0 1,305.7 Income taxes payable 192.2 214.1 ---------- ---------- Total 2,023.1 2,053.5 ---------- ---------- Long-term debt 901.8 1,048.3 Accrued pension liabilities 460.1 433.6 Other long-term liabilities 539.1 544.0 Stockholders' equity Common stock 3.4 3.3 Accumulated deficit (366.4) (414.8) Other capital 3,856.9 3,818.6 Accumulated other comprehensive loss (2,001.1) (2,011.9) ---------- ---------- Stockholders' equity 1,492.8 1,395.2 ---------- ---------- Total $5,416.9 $5,474.6 ========== ==========
  • 4. UNISYS CORPORATION CONSOLIDATED STATEMENTS OF CASH FLOWS (Millions) Six Months Ended June 30 ----------------- 2004 2003 ---- ---- Cash flows from operating activities Net income $48.3 $91.0 Add (deduct) items to reconcile net income to net cash provided by operating activities: Depreciation and amortization of properties and outsourcing assets 123.1 105.4 Amortization of marketable software 62.9 59.9 (Increase) in deferred income taxes, net (2.4) (1.5) Decrease (increase) in receivables, net 185.3 (6.6) Decrease in inventories 6.4 19.5 (Decrease) in accounts payable and other accrued liabilities (172.2) (177.5) (Decrease) increase in income taxes payable (21.9) 17.5 Increase (decrease) in other liabilities 3.5 (14.8) (Increase) in other assets (27.8) (39.1) Other 8.8 (5.6) ------- ------- Net cash provided by operating activities 214.0 48.2 ------- ------- Cash flows from investing activities Proceeds from investments 2,878.8 2,387.5 Purchases of investments (2,879.0) (2,421.7) Investment in marketable software (60.5) (76.9) Capital additions of properties and outsourcing assets (143.5) (112.0) Purchases of businesses (12.6) (2.0) ------- ------- Net cash used for investing activities (216.8) (225.1) ------- ------- Cash flows from financing activities Net reduction in short-term borrowings (10.6) (59.6) Proceeds from employee stock plans 24.0 13.9 Payments of long-term debt (1.7) (3.0) Proceeds from issuance of long-term debt 293.3 ------- ------- Net cash provided by financing activities 11.7 244.6 ------- ------- Effect of exchange rate changes on cash and cash equivalents (1.4) 12.3 ------- ------- Increase in cash and cash equivalents 7.5 80.0 Cash and cash equivalents, beginning of period 635.9 301.8 ------- ------- Cash and cash equivalents, end of period $643.4 $381.8 ======= =======
  • 5. Reconciliation of GAAP to Non-GAAP Financial Information The preceding release presents information with and without pension expense or income. Unisys believes that this information will enhance an overall understanding of its financial performance due to the significant change in pension expense or income from period to period and the non-operational nature of pension expense or income. The presentation of non-GAAP information is not meant to be considered in isolation or as a substitute for results prepared in accordance with accounting principles generally accepted in the United States.
  • 6. UNISYS CORPORATION RECONCILIATION OF GAAP TO NON-GAAP CONSOLIDATED STATEMENTS OF INCOME (Millions, except per share data) Three Months Ended June 30, 2004 ---------------------------- US GAAP Less Without as Pension Pension Reported Expense Expense -------- -------- -------- Revenue $1,388.1 $1,388.1 Costs and expenses Cost of revenue 1,021.0 ($17.8) 1,003.2 Selling, general and administrative 272.9 (4.8) 268.1 Research and development 71.3 (2.2) 69.1 -------- -------- -------- 1,365.2 (24.8) 1,340.4 -------- -------- -------- Operating income 22.9 24.8 47.7 Interest expense 18.2 18.2 Other income (expense), net 24.0 24.0 -------- -------- -------- Income before income taxes 28.7 24.8 53.5 Provision for income taxes 9.3 7.9 17.2 -------- -------- -------- Net income $19.4 $16.9 $36.3 ======== ======== ======== Diluted earnings per share $ .06 $ .05 $ .11 ======== ======== ======== Three Months Ended June 30, 2003 ---------------------------- US GAAP Less Without as Pension Pension Reported Income Income -------- -------- -------- Revenue $1,425.0 $1,425.0 Costs and expenses Cost of revenue 1,032.9 $1.5 1,034.4 Selling, general and administrative 242.4 2.4 244.8 Research and development 63.7 4.0 67.7 -------- -------- -------- 1,339.0 7.9 1,346.9 -------- -------- -------- Operating income 86.0 (7.9) 78.1 Interest expense 18.4 18.4 Other income (expense), net 10.6 10.6 -------- -------- -------- Income before income taxes 78.2 (7.9) 70.3 Provision for income taxes 25.7 (2.6) 23.1 -------- -------- -------- Net income $52.5 ($5.3) $47.2 ======== ======== ======== Diluted earnings per share $ .16 ($ .02) $ .14 ======== ======== ========
  • 7. UNISYS CORPORATION RECONCILIATION OF GAAP TO NON-GAAP CONSOLIDATED STATEMENTS OF INCOME (Millions, except per share data) Six Months Ended June 30, 2004 ---------------------------- US GAAP Less Without as Pension Pension Reported Expense Expense -------- -------- -------- Revenue $2,851.0 $2,851.0 Costs and expenses Cost of revenue 2,092.4 ($33.3) 2,059.1 Selling, general and administrative 534.1 (9.7) 524.4 Research and development 142.8 (4.0) 138.8 -------- -------- -------- 2,769.3 (47.0) 2,722.3 -------- -------- -------- Operating income 81.7 47.0 128.7 Interest expense 35.2 35.2 Other income (expense), net 24.6 24.6 -------- -------- -------- Income before income taxes 71.1 47.0 118.1 Provision for income taxes 22.8 15.0 37.8 -------- -------- -------- Net income $48.3 $32.0 $80.3 ======== ======== ======== Diluted earnings per share $ .14 $ .10 $ .24 ======== ======== ======== Six Months Ended June 30, 2003 ---------------------------- US GAAP Less Without as Pension Pension Reported Income Income -------- -------- -------- Revenue $2,823.9 $2,823.9 Costs and expenses Cost of revenue 2,044.7 $2.7 2,047.4 Selling, general and administrative 486.1 4.4 490.5 Research and development 130.5 7.2 137.7 -------- -------- -------- 2,661.3 14.3 2,675.6 -------- -------- -------- Operating income 162.6 (14.3) 148.3 Interest expense 34.1 34.1 Other income (expense), net 7.2 7.2 -------- -------- -------- Income before income taxes 135.7 (14.3) 121.4 Provision for income taxes 44.7 (4.7) 40.0 -------- -------- -------- Net income $91.0 ($9.6) $81.4 ======== ======== ======== Diluted earnings per share $ .28 ($ .03) $ .25 ======== ======== ========
  • 8. UNISYS CORPORATION RECONCILIATION OF GAAP TO NON-GAAP SEGMENT RESULTS OF OPERATIONS (Millions) Three Months Ended June 30, 2004 ---------------------------- Less Without As Pension Pension Reported Expense Expense -------- -------- -------- Services Segment Total revenue $1,163.3 $1,163.3 Gross profit 214.9 ($17.4) 232.3 % of revenue 18.5% 20.0% Operating income 8.2 (21.1) 29.3 % of revenue 0.7% 2.5% Technology Segment Total revenue 282.1 282.1 Gross profit 150.4 (0.4) 150.8 % of revenue 53.3% 53.5% Operating income 15.1 (3.7) 18.8 % of revenue 5.4% 6.7% Total Company Total revenue 1,388.1 1,388.1 Gross profit 367.1 (17.8) 384.9 % of revenue 26.4% 27.7% Operating income 22.9 (24.8) 47.7 % of revenue 1.6% 3.4% Three Months Ended June 30, 2003 ---------------------------- Less Without As Pension Pension Reported Income Income -------- -------- -------- Services Segment Total revenue $1,169.7 $1,169.7 Gross profit 234.5 $0.7 233.8 % of revenue 20.0% 20.0% Operating income 64.1 3.2 60.9 % of revenue 5.5% 5.2% Technology Segment Total revenue 344.5 344.5 Gross profit 160.5 0.8 159.7 % of revenue 46.6% 46.4% Operating income 26.8 4.7 22.1 % of revenue 7.8% 6.4% Total Company Total revenue 1,425.0 1,425.0 Gross profit 392.1 1.5 390.6 % of revenue 27.5% 27.4% Operating income 86.0 7.9 78.1 % of revenue 6.0% 5.5%
  • 9. UNISYS CORPORATION RECONCILIATION OF GAAP TO NON-GAAP SEGMENT RESULTS OF OPERATIONS (Millions) Six Months Ended June 30, 2004 ---------------------------- Less Without As Pension Pension Reported Expense Expense -------- -------- -------- Services Segment Total revenue $2,333.1 $2,333.1 Gross profit 437.8 ($32.6) 470.4 % of revenue 18.8% 20.2% Operating income 37.4 (40.4) 77.8 % of revenue 1.6% 3.3% Technology Segment Total revenue 620.9 620.9 Gross profit 314.2 (0.7) 314.9 % of revenue 50.6% 50.7% Operating income 44.3 (6.6) 50.9 % of revenue 7.1% 8.2% Total Company Total revenue 2,851.0 2,851.0 Gross profit 758.6 (33.3) 791.9 % of revenue 26.6% 27.8% Operating income 81.7 (47.0) 128.7 % of revenue 2.9% 4.5% Six Months Ended June 30, 2003 ---------------------------- Less Without As Pension Pension Reported Income Income -------- -------- -------- Services Segment Total revenue $2,282.3 $2,282.3 Gross profit 442.9 $0.7 442.2 % of revenue 19.4% 19.4% Operating income 98.5 5.1 93.4 % of revenue 4.3% 4.1% Technology Segment Total revenue 700.8 700.8 Gross profit 338.6 2.0 336.6 % of revenue 48.3% 48.0% Operating income 66.4 9.2 57.2 % of revenue 9.5% 8.2% Total Company Total revenue 2,823.9 2,823.9 Gross profit 779.2 2.7 776.5 % of revenue 27.6% 27.5% Operating income 162.6 14.3 148.3 % of revenue 5.8% 5.3%
  • 10. UNISYS CORPORATION RECONCILATION OF GAAP TO NON-GAAP FORWARD-LOOKING ESTIMATED DILUTED EARNINGS PER SHARE Three Months Year Ending Ending 9/30/2004 12/31/2004 ---------- ---------- Diluted earnings per share- on a GAAP basis .03-.07 .49-.53 Add back estimated pension expense, net of tax .05 .19 --------- --------- Diluted earnings per share- on a NON-GAAP basis (excluding pension expense) .08-.12 .68-.72 ========= ========= NOTE: See section in press release entitled quot;Forward-Looking Statementsquot;.