SlideShare una empresa de Scribd logo
1 de 10
Descargar para leer sin conexión
UNISYS CORPORATION
                     CONSOLIDATED STATEMENTS OF INCOME
                     (Millions, except per share data)

                                    Three Months             Nine Months
                                 Ended September 30      Ended September 30
                                 ------------------      ------------------
                                   2004      2003          2004      2003
                                 -------- --------       -------- --------
Revenue
  Services                       $1,147.1 $1,124.3       $3,470.9 $3,394.7
  Technology                        298.6    325.4          825.8    878.9
                                 -------- --------       -------- --------
                                  1,445.7  1,449.7        4,296.7  4,273.6
Costs and expenses
  Cost of revenue:
    Services                        965.7       886.1     2,821.6    2,675.4
    Technology                      139.0       138.5       375.5      393.9
                                 --------    --------    --------   --------
                                  1,104.7     1,024.6     3,197.1    3,069.3
  Selling, general and
    administrative                  303.7    251.0          837.8      737.1
  Research and development           75.3     68.2          218.1      198.7
                                 -------- --------       --------   --------
                                  1,483.7  1,343.8        4,253.0    4,005.1
                                 -------- --------       --------   --------
Operating income (loss)             (38.0)   105.9           43.7      268.5

Interest expense                     16.2       17.2        51.4       51.3
Other income
  (expense), net                     (3.0)    (4.7)          21.6        2.5
                                 -------- --------       --------   --------
Income (loss) before
  income taxes                      (57.2)      84.0        13.9      219.7
Provision (benefit) for
  income taxes                      (82.4)    27.8          (59.6)    72.5
                                 -------- --------       -------- --------
Net income                          $25.2    $56.2          $73.5   $147.2
                                 ======== ========       ======== ========
Earnings per share
Basic                              $ .08       $ .17       $ .22      $ .45
                                 ========    ========    ========   ========
Diluted                            $ .07       $ .17       $ .22      $ .44
                                 ========    ========    ========   ========
Shares used in the per share
  computations (thousands):
  Basic                           335,576     330,033     334,236    328,675
                                 ========    ========    ========   ========
  Diluted                         337,362     333,979     338,059    331,317
                                 ========    ========    ========   ========
UNISYS CORPORATION
                             SEGMENT RESULTS
                                (Millions)

                                         Elimi-
                              Total      nations      Services* Technology*
                             --------    --------     --------   ----------
Three Months Ended
September 30, 2004
------------------
Customer revenue             $1,445.7                 $1,147.1      $298.6
Intersegment                              ($63.6)          5.2        58.4
                              --------   --------      --------    --------
Total revenue                $1,445.7     ($63.6)     $1,152.3      $357.0
                              ========   ========      ========    ========

Gross profit percent            23.6%                   16.2%        51.0%
                              ========                ========     ========
Operating profit
  (loss) percent                (2.6%)                  (0.2%)       13.9%
                              ========                ========     ========
Three Months Ended
September 30, 2003
------------------
Customer revenue             $1,449.7                 $1,124.3      $325.4
Intersegment                              ($66.4)          7.3        59.1
                              --------   --------      --------    --------
Total revenue                $1,449.7     ($66.4)     $1,131.6      $384.5
                              ========   ========      ========    ========

Gross profit percent            29.3%                   19.8%        53.1%
                              ========                ========     ========
Operating profit
  percent                        7.3%                    3.9%        16.5%
                              ========                ========     ========

Nine Months Ended
September 30, 2004
------------------
Customer revenue             $4,296.7                 $3,470.9      $825.8
Intersegment                             ($166.6)         14.5       152.1
                              --------   --------      --------    --------
Total revenue                $4,296.7    ($166.6)     $3,485.4      $977.9
                              ========   ========      ========    ========

Gross profit percent            25.6%                   17.9%        50.7%
                              ========                ========     ========
Operating profit
  percent                        1.0%                    1.0%         9.6%
                              ========                ========     ========
Nine Months Ended
September 30, 2003
------------------
Customer revenue             $4,273.6                 $3,394.7      $878.9
Intersegment                             ($225.6)         19.2       206.4
                              --------   --------      --------    --------
Total revenue                $4,273.6    ($225.6)     $3,413.9    $1,085.3
                              ========   ========      ========    ========

Gross profit percent           28.2%                    19.5%        50.0%
                             ========                 ========     ========
Operating profit
  percent                       6.3%                     4.2%        12.0%
                             ========                 ========     ========

* 2004 results exclude charges for cost reductions
and related actions as announced on October 6, 2004
UNISYS CORPORATION
                     CONSOLIDATED BALANCE SHEETS
                              (Millions)
                                           September 30, December 31,
                                                2004         2003
                                            ----------    ----------
Assets
Current assets
  Cash and cash equivalents                        $573.7      $635.9
  Accounts and notes receivable, net                962.0     1,027.8
  Inventories
     Parts and finished equipment                102.2           121.7
     Work in process and materials               117.7           116.9
  Deferred income taxes                          295.0           270.0
  Other current assets                           104.9            85.7
                                            ----------      ----------
 Total                                         2,155.5         2,258.0
                                            ----------      ----------
Properties                                     1,364.9         1,352.7
  Less accumulated depreciation
    and amortization                             952.5           928.5
                                            ----------      ----------
 Properties, net                                 412.4           424.2
                                            ----------      ----------
Outsourcing assets, net                          510.9           477.5
Marketable software, net                         341.3           332.2
Investments at equity                            166.4           153.3
Prepaid pension cost                              49.2            55.5
Deferred income taxes                          1,385.7         1,384.6
Goodwill                                         185.3           177.5
Other long-term assets                           203.5           211.8
                                            ----------      ----------
 Total                                        $5,410.2        $5,474.6
                                            ==========      ==========
Liabilities and stockholders' equity
Current liabilities
  Notes payable                                  $20.0           $17.7
  Current maturities of long-term debt           150.8             2.2
  Accounts payable                               392.6           513.8
  Other accrued liabilities                    1,233.5         1,305.7
  Income taxes payable                           153.5           214.1
                                            ----------      ----------
 Total                                         1,950.4         2,053.5
                                            ----------      ----------
Long-term debt                                   899.5         1,048.3
Accrued pension liabilities                      471.6           433.6
Other long-term liabilities                      551.1           544.0
Stockholders' equity
  Common stock                                     3.4             3.3
  Accumulated deficit                           (341.3)         (414.8)
  Other capital                                3,869.4         3,818.6
  Accumulated other comprehensive loss        (1,993.9)       (2,011.9)
                                            ----------      ----------
 Stockholders' equity                          1,537.6         1,395.2
                                            ----------      ----------
 Total                                        $5,410.2        $5,474.6
                                            ==========      ==========
UNISYS CORPORATION
                 CONSOLIDATED STATEMENTS OF CASH FLOWS
                                (Millions)
                                                     Nine Months Ended
                                                        September 30
                                                    -------------------
                                                      2004        2003
                                                    -------      -------
Cash flows from operating activities
Net income                                             $73.5      $147.2
Add (deduct) items to reconcile
  net income to net cash provided
  by operating activities:
Depreciation and amortization
  of properties and outsourcing assets                 181.7       154.9
Amortization of marketable software                     96.6        92.2
(Increase) in deferred income
  taxes, net                                           (25.3)       (2.5)
Decrease (increase) in receivables, net                 97.2       (32.3)
Decrease in inventories                                 19.1        43.0
(Decrease) in accounts payable and
  other accrued liabilities                          (207.5)      (192.8)
(Decrease) increase in income
  taxes payable                                        (52.6)       19.8
Increase (decrease) in other liabilities                19.8       (44.0)
(Increase) in other assets                             (34.0)      (29.9)
Other                                                   44.7         6.5
                                                     -------      -------
Net cash provided by operating activities              213.2       162.1
                                                     -------      -------
Cash flows from investing activities
  Proceeds from investments                         4,423.4      3,626.1
  Purchases of investments                         (4,427.4)    (3,663.2)
  Investment in marketable software                    (88.8)     (109.4)
  Capital additions of properties
    and outsourcing assets                           (192.4)      (177.9)
  Purchases of businesses                              (18.6)       (2.0)
                                                     -------      -------
Net cash used for investing activities               (303.8)      (326.4)
                                                     -------      -------
Cash flows from financing activities
  Net reduction in short-term borrowings                (1.0)      (57.0)
  Proceeds from employee stock plans                    30.9        21.0
  Payments of long-term debt                            (2.3)       (3.8)
  Proceeds from issuance of long-term debt                         293.3
                                                     -------      -------
Net cash provided by financing activities               27.6       253.5
                                                     -------      -------
Effect of exchange rate changes on cash
  and cash equivalents                                    .8        11.7
                                                     -------      -------
Increase (decrease) in cash and
  cash equivalents                                     (62.2)      100.9
Cash and cash equivalents, beginning of
  period                                               635.9       301.8
                                                     -------      -------
Cash and cash equivalents, end of period             $573.7       $402.7
                                                     =======      =======
Reconciliation of GAAP to Non-GAAP
Financial Information

The preceding release presents information with and
without pension expense or income. Unisys believes
that this information will enhance an overall
understanding of its financial performance due to the
significant change in pension expense or income from
period to period and the non-operational nature of
pension expense or income. The presentation of
non-GAAP information is not meant to be considered in
isolation or as a substitute for results prepared in
accordance with accounting principles generally
accepted in the United States.
UNISYS CORPORATION
               RECONCILIATION OF GAAP TO NON-GAAP
               CONSOLIDATED STATEMENTS OF INCOME
               (Millions, except per share data)

                                        Three Months Ended
                                        September 30, 2004
                                  ----------------------------
                                   US GAAP     Less     Without
                                      as      Pension   Pension
                                   Reported   Expense   Expense
                                  -------- -------- --------
Revenue                           $1,445.7             $1,445.7

Costs and expenses
  Cost of revenue                  1,104.7     ($17.1)    1,087.6
  Selling, general and
    administrative                   303.7     (4.4)   299.3
  Research and development            75.3     (2.0)    73.3
                                  -------- -------- --------
                                   1,483.7    (23.5) 1,460.2
                                  -------- -------- --------
Operating income (loss)              (38.0)    23.5    (14.5)

Interest expense                      16.2                   16.2
Other income
  (expense), net                      (3.0)                   (3.0)
                                  -------- --------       --------
Income (loss) before
  income taxes                       (57.2)      23.5       (33.7)
Provision (benefit) for
  income taxes                       (82.4)     7.6          (74.8)
                                  -------- --------       --------
Net income                           $25.2    $15.9          $41.1
                                  ======== ========       ========
Diluted earnings per share          $ .07    $ .05          $ .12
                                  ======== ========       ========

                                        Three Months Ended
                                        September 30, 2003
                                  ----------------------------
                                   US GAAP     Less     Without
                                      as      Pension   Pension
                                   Reported   Income     Income
                                  -------- -------- --------
Revenue                           $1,449.7             $1,449.7

Costs and expenses
  Cost of revenue                  1,024.6       $1.7     1,026.3
  Selling, general and
    administrative                   251.0         3.2    254.2
  Research and development            68.2         3.6     71.8
                                  --------    -------- --------
                                   1,343.8         8.5  1,352.3
                                  --------    -------- --------
Operating income                     105.9        (8.5)    97.4

Interest expense                      17.2                   17.2
Other income
  (expense), net                      (4.7)                   (4.7)
                                  --------    --------    --------
Income before income taxes            84.0        (8.5)       75.5
Provision for income taxes            27.8        (2.8)       25.0
                                  --------    --------    --------
Net income                           $56.2       ($5.7)      $50.5
                                  ========    ========    ========
Diluted earnings per share          $ .17      ($ .02)      $ .15
                                  ========    ========    ========
UNISYS CORPORATION
               RECONCILIATION OF GAAP TO NON-GAAP
               CONSOLIDATED STATEMENTS OF INCOME
               (Millions, except per share data)

                                         Nine Months Ended
                                        September 30, 2004
                                  ----------------------------
                                   US GAAP      Less     Without
                                      as      Pension    Pension
                                   Reported   Expense    Expense
                                  -------- -------- --------
Revenue                           $4,296.7             $4,296.7

Costs and expenses
  Cost of revenue                  3,197.1    ($50.4)    3,146.7
  Selling, general and
    administrative                   837.8      (14.1)   823.7
  Research and development           218.1       (6.0)   212.1
                                  --------   -------- --------
                                   4,253.0      (70.5) 4,182.5
                                  --------   -------- --------
Operating income                      43.7       70.5    114.2

Interest expense                      51.4                  51.4
Other income
  (expense), net                      21.6                   21.6
                                  --------   --------    --------
Income before income taxes            13.9       70.5        84.4
Provision (benefit) for
  income taxes                       (59.6)    22.6         (37.0)
                                  -------- --------      --------
Net income                           $73.5    $47.9        $121.4
                                  ======== ========      ========
Diluted earnings per share          $ .22    $ .14         $ .36
                                  ======== ========      ========

                                         Nine Months Ended
                                        September 30, 2003
                                  ----------------------------
                                   US GAAP      Less     Without
                                      as      Pension    Pension
                                   Reported    Income    Income
                                  -------- -------- --------
Revenue                           $4,273.6             $4,273.6

Costs and expenses
  Cost of revenue                  3,069.3      $4.4     3,073.7
  Selling, general and
    administrative                   737.1        7.6    744.7
  Research and development           198.7       10.8    209.5
                                  --------   -------- --------
                                   4,005.1       22.8  4,027.9
                                  --------   -------- --------
Operating income                     268.5      (22.8)   245.7

Interest expense                      51.3                  51.3
Other income
  (expense), net                       2.5                    2.5
                                  --------   --------    --------
Income before income taxes           219.7      (22.8)      196.9
Provision for income taxes            72.5       (7.5)       65.0
                                  --------   --------    --------
Net income                          $147.2     ($15.3)     $131.9
                                  ========   ========    ========
Diluted earnings per share          $ .44     ($ .04)      $ .40
                                  ========   ========    ========
UNISYS CORPORATION
            RECONCILIATION OF GAAP TO NON-GAAP
               SEGMENT RESULTS OF OPERATIONS
                        (Millions)

                                   Three Months Ended
                                   September 30, 2004
                              ----------------------------
                                          Less     Without
                                  As     Pension   Pension
                               Reported Expense    Expense
                              -------- -------- --------
Services Segment *
   Total revenue              $1,152.3           $1,152.3
   Gross profit                  186.2    ($16.7)   202.9
     % of revenue                 16.2%              17.6%
   Operating income (loss)        (2.2)   (20.6)     18.4
     % of revenue                 -0.2%               1.6%

Technology Segment *
   Total revenue                 357.0                357.0
   Gross profit                  182.0     (0.4)      182.4
     % of revenue                 51.0%                51.1%
   Operating income               49.7     (2.9)       52.6
     % of revenue                 13.9%                14.7%

Total Company
   Total revenue               1,445.7              1,445.7
   Gross profit                  341.0    (17.1)      358.1
     % of revenue                 23.6%                24.8%
   Operating income (loss)       (38.0)   (23.5)      (14.5)
     % of revenue                 -2.6%                -1.0%
                                   Three Months Ended
                                   September 30, 2003
                              ----------------------------
                                          Less     Without
                                  As     Pension   Pension
                               Reported  Income     Income
                              -------- -------- --------
Services Segment
   Total revenue              $1,131.6              $1,131.6
   Gross profit                  224.0     $1.0        223.0
     % of revenue                 19.8%                 19.7%
   Operating income               43.8      3.9         39.9
     % of revenue                  3.9%                  3.5%

Technology Segment
   Total revenue                 384.5                384.5
   Gross profit                  204.0      0.7       203.3
     % of revenue                 53.1%                52.9%
   Operating income               63.4      4.6        58.8
     % of revenue                 16.5%                15.3%

Total Company
   Total revenue               1,449.7              1,449.7
   Gross profit                  425.1      1.7       423.4
     % of revenue                 29.3%                29.2%
   Operating income              105.9      8.5        97.4
     % of revenue                  7.3%                 6.7%
* 2004 results exclude charges for cost reductions
and related actions as announced on October 6, 2004
UNISYS CORPORATION
            RECONCILIATION OF GAAP TO NON-GAAP
               SEGMENT RESULTS OF OPERATIONS
                        (Millions)

                                    Nine Months Ended
                                   September 30, 2004
                              ----------------------------
                                           Less    Without
                                  As     Pension   Pension
                               Reported Expense    Expense
                              -------- -------- --------
Services Segment *
   Total revenue              $3,485.4           $3,485.4
   Gross profit                  624.0    ($49.3)   673.3
     % of revenue                 17.9%              19.3%
   Operating income               35.2    (61.0)     96.2
     % of revenue                  1.0%               2.8%

Technology Segment *
   Total revenue                 977.9                977.9
   Gross profit                  496.2     (1.1)      497.3
     % of revenue                 50.7%                50.9%
   Operating income               94.0     (9.5)      103.5
     % of revenue                  9.6%                10.6%

Total Company
   Total revenue               4,296.7              4,296.7
   Gross profit                1,099.6    (50.4)    1,150.0
     % of revenue                 25.6%                26.8%
   Operating income               43.7    (70.5)      114.2
     % of revenue                  1.0%                 2.7%
                                    Nine Months Ended
                                   September 30, 2003
                              ----------------------------
                                           Less    Without
                                  As     Pension   Pension
                               Reported   Income    Income
                              -------- -------- --------
Services Segment
   Total revenue              $3,413.9              $3,413.9
   Gross profit                  666.9     $1.7        665.2
     % of revenue                 19.5%                 19.5%
   Operating income              142.3      9.0        133.3
     % of revenue                  4.2%                  3.9%

Technology Segment
   Total revenue               1,085.3              1,085.3
   Gross profit                  542.6      2.7       539.9
     % of revenue                 50.0%                49.7%
   Operating income              129.8     13.8       116.0
     % of revenue                 12.0%                10.7%

Total Company
   Total revenue               4,273.6              4,273.6
   Gross profit                1,204.3      4.4     1,199.9
     % of revenue                 28.2%                28.1%
   Operating income              268.5     22.8       245.7
     % of revenue                  6.3%                 5.7%
* 2004 results exclude charges for cost reductions
and related actions as announced on October 6, 2004
UNISYS CORPORATION
              RECONCILATION OF GAAP TO NON-GAAP
     FORWARD-LOOKING ESTIMATED DILUTED EARNINGS PER SHARE


                                          Three
                                          Months      Year
                                          Ending     Ending
                                        12/31/2004 12/31/2004
                                        ---------- ----------

Diluted earnings per share-
   on a GAAP basis                            .27-.31    .49-.53

Add back estimated pension expense,
   net of tax                                   .05           .19
                                          ---------     ---------
Diluted earnings per share-
   on a NON-GAAP basis
   (excluding pension expense)              .32-.36       .68-.72
                                          =========     =========

NOTE: See section in press release entitled
quot;Forward-Looking Statementsquot;.

Más contenido relacionado

La actualidad más candente

unisys 2006_3Q_10Q
unisys 2006_3Q_10Qunisys 2006_3Q_10Q
unisys 2006_3Q_10Qfinance36
 
Big_Lots_AR2002FSO
Big_Lots_AR2002FSOBig_Lots_AR2002FSO
Big_Lots_AR2002FSOfinance50
 
unisys 2007_3Q_10Q
unisys 2007_3Q_10Qunisys 2007_3Q_10Q
unisys 2007_3Q_10Qfinance36
 
unisys 2005_1Q_10Q
unisys 2005_1Q_10Qunisys 2005_1Q_10Q
unisys 2005_1Q_10Qfinance36
 
Big_Lots_AR2003FSO
Big_Lots_AR2003FSOBig_Lots_AR2003FSO
Big_Lots_AR2003FSOfinance50
 
Duke-Energy 04 Stat_Supplement
Duke-Energy 04 Stat_SupplementDuke-Energy 04 Stat_Supplement
Duke-Energy 04 Stat_Supplementfinance21
 
Big_Lots_AR2001FSO
Big_Lots_AR2001FSOBig_Lots_AR2001FSO
Big_Lots_AR2001FSOfinance50
 
delta air line 2008 2nd
delta air line 2008 2nddelta air line 2008 2nd
delta air line 2008 2ndfinance13
 
unisys 2007_1Q_10Q
unisys 2007_1Q_10Qunisys 2007_1Q_10Q
unisys 2007_1Q_10Qfinance36
 
unisys 2007_2Q_10Q
unisys 2007_2Q_10Qunisys 2007_2Q_10Q
unisys 2007_2Q_10Qfinance36
 
conoco phillips 2008Fourth Quarter
conoco phillips 2008Fourth Quarterconoco phillips 2008Fourth Quarter
conoco phillips 2008Fourth Quarterfinance1
 
qwest communications 1231 06
qwest communications 1231 06qwest communications 1231 06
qwest communications 1231 06finance19
 
tribune earnings_q3_03_tables
tribune  earnings_q3_03_tablestribune  earnings_q3_03_tables
tribune earnings_q3_03_tablesfinance47
 
northan trust corp.2005FinancialBook
northan trust corp.2005FinancialBooknorthan trust corp.2005FinancialBook
northan trust corp.2005FinancialBookfinance38
 
tech data Fiscal Year 2006 Q1-3 Not Restated for Discontinued Operations
tech data Fiscal Year 2006 Q1-3 Not Restated for Discontinued Operationstech data Fiscal Year 2006 Q1-3 Not Restated for Discontinued Operations
tech data Fiscal Year 2006 Q1-3 Not Restated for Discontinued Operationsfinance11
 

La actualidad más candente (17)

unisys 2006_3Q_10Q
unisys 2006_3Q_10Qunisys 2006_3Q_10Q
unisys 2006_3Q_10Q
 
Big_Lots_AR2002FSO
Big_Lots_AR2002FSOBig_Lots_AR2002FSO
Big_Lots_AR2002FSO
 
unisys 2007_3Q_10Q
unisys 2007_3Q_10Qunisys 2007_3Q_10Q
unisys 2007_3Q_10Q
 
unisys 2005_1Q_10Q
unisys 2005_1Q_10Qunisys 2005_1Q_10Q
unisys 2005_1Q_10Q
 
Big_Lots_AR2003FSO
Big_Lots_AR2003FSOBig_Lots_AR2003FSO
Big_Lots_AR2003FSO
 
Duke-Energy 04 Stat_Supplement
Duke-Energy 04 Stat_SupplementDuke-Energy 04 Stat_Supplement
Duke-Energy 04 Stat_Supplement
 
dte_030814
dte_030814dte_030814
dte_030814
 
Big_Lots_AR2001FSO
Big_Lots_AR2001FSOBig_Lots_AR2001FSO
Big_Lots_AR2001FSO
 
delta air line 2008 2nd
delta air line 2008 2nddelta air line 2008 2nd
delta air line 2008 2nd
 
unisys 2007_1Q_10Q
unisys 2007_1Q_10Qunisys 2007_1Q_10Q
unisys 2007_1Q_10Q
 
unisys 2007_2Q_10Q
unisys 2007_2Q_10Qunisys 2007_2Q_10Q
unisys 2007_2Q_10Q
 
conoco phillips 2008Fourth Quarter
conoco phillips 2008Fourth Quarterconoco phillips 2008Fourth Quarter
conoco phillips 2008Fourth Quarter
 
qwest communications 1231 06
qwest communications 1231 06qwest communications 1231 06
qwest communications 1231 06
 
tribune earnings_q3_03_tables
tribune  earnings_q3_03_tablestribune  earnings_q3_03_tables
tribune earnings_q3_03_tables
 
northan trust corp.2005FinancialBook
northan trust corp.2005FinancialBooknorthan trust corp.2005FinancialBook
northan trust corp.2005FinancialBook
 
itw_051028
itw_051028itw_051028
itw_051028
 
tech data Fiscal Year 2006 Q1-3 Not Restated for Discontinued Operations
tech data Fiscal Year 2006 Q1-3 Not Restated for Discontinued Operationstech data Fiscal Year 2006 Q1-3 Not Restated for Discontinued Operations
tech data Fiscal Year 2006 Q1-3 Not Restated for Discontinued Operations
 

Destacado

unisys 2001_2Q_10Q
unisys 2001_2Q_10Qunisys 2001_2Q_10Q
unisys 2001_2Q_10Qfinance36
 
shaw group employee_compensation
shaw group  employee_compensationshaw group  employee_compensation
shaw group employee_compensationfinance36
 
micron technollogy 2004_10K
micron technollogy 2004_10Kmicron technollogy 2004_10K
micron technollogy 2004_10Kfinance36
 
shaw group 94AC2BEF-AE9A-4207-BADB-56E9EA310D39_BarclaysFebruary2009
shaw group 94AC2BEF-AE9A-4207-BADB-56E9EA310D39_BarclaysFebruary2009shaw group 94AC2BEF-AE9A-4207-BADB-56E9EA310D39_BarclaysFebruary2009
shaw group 94AC2BEF-AE9A-4207-BADB-56E9EA310D39_BarclaysFebruary2009finance36
 
micron technollogy 8-K_041006_results
micron technollogy 8-K_041006_resultsmicron technollogy 8-K_041006_results
micron technollogy 8-K_041006_resultsfinance36
 
micron technollogy 2007_8_K_other_events
micron technollogy 2007_8_K_other_eventsmicron technollogy 2007_8_K_other_events
micron technollogy 2007_8_K_other_eventsfinance36
 

Destacado (6)

unisys 2001_2Q_10Q
unisys 2001_2Q_10Qunisys 2001_2Q_10Q
unisys 2001_2Q_10Q
 
shaw group employee_compensation
shaw group  employee_compensationshaw group  employee_compensation
shaw group employee_compensation
 
micron technollogy 2004_10K
micron technollogy 2004_10Kmicron technollogy 2004_10K
micron technollogy 2004_10K
 
shaw group 94AC2BEF-AE9A-4207-BADB-56E9EA310D39_BarclaysFebruary2009
shaw group 94AC2BEF-AE9A-4207-BADB-56E9EA310D39_BarclaysFebruary2009shaw group 94AC2BEF-AE9A-4207-BADB-56E9EA310D39_BarclaysFebruary2009
shaw group 94AC2BEF-AE9A-4207-BADB-56E9EA310D39_BarclaysFebruary2009
 
micron technollogy 8-K_041006_results
micron technollogy 8-K_041006_resultsmicron technollogy 8-K_041006_results
micron technollogy 8-K_041006_results
 
micron technollogy 2007_8_K_other_events
micron technollogy 2007_8_K_other_eventsmicron technollogy 2007_8_K_other_events
micron technollogy 2007_8_K_other_events
 

Similar a unisys 3Q04_SPR

unisys 2Q04_SPR
unisys 2Q04_SPRunisys 2Q04_SPR
unisys 2Q04_SPRfinance36
 
unisys 2Q04_SPR
unisys 2Q04_SPRunisys 2Q04_SPR
unisys 2Q04_SPRfinance36
 
unisys 2Q05_SPR
unisys 2Q05_SPRunisys 2Q05_SPR
unisys 2Q05_SPRfinance36
 
unisys 4Q04_SPR
unisys 4Q04_SPRunisys 4Q04_SPR
unisys 4Q04_SPRfinance36
 
unisys 2Q07_SPR
unisys 2Q07_SPRunisys 2Q07_SPR
unisys 2Q07_SPRfinance36
 
unisys 4Q06_SPR
unisys 4Q06_SPRunisys 4Q06_SPR
unisys 4Q06_SPRfinance36
 
unisys 2Q08_SPR
unisys 2Q08_SPRunisys 2Q08_SPR
unisys 2Q08_SPRfinance36
 
unisys 4Q05_SPR
unisys 4Q05_SPRunisys 4Q05_SPR
unisys 4Q05_SPRfinance36
 
unisys 1Q04_SPR
unisys 1Q04_SPRunisys 1Q04_SPR
unisys 1Q04_SPRfinance36
 
unisys 1Q07_SPR
unisys 1Q07_SPRunisys 1Q07_SPR
unisys 1Q07_SPRfinance36
 
unisys 1Q06_SPR
unisys 1Q06_SPRunisys 1Q06_SPR
unisys 1Q06_SPRfinance36
 
unisys 1Q05_SPR
unisys 1Q05_SPRunisys 1Q05_SPR
unisys 1Q05_SPRfinance36
 
unisys 1Q08_SPR
unisys 1Q08_SPRunisys 1Q08_SPR
unisys 1Q08_SPRfinance36
 
unisys 2001_3Q_10Q
unisys 2001_3Q_10Qunisys 2001_3Q_10Q
unisys 2001_3Q_10Qfinance36
 
unisys 2001_1Q_10Q
unisys 2001_1Q_10Qunisys 2001_1Q_10Q
unisys 2001_1Q_10Qfinance36
 
unisys 2002_3Q_10Q
unisys 2002_3Q_10Qunisys 2002_3Q_10Q
unisys 2002_3Q_10Qfinance36
 
qwest communications Q_3Q07_Historical_v2
qwest communications Q_3Q07_Historical_v2qwest communications Q_3Q07_Historical_v2
qwest communications Q_3Q07_Historical_v2finance19
 
Q1 2009 Earning Report of Weatherford International
Q1 2009 Earning Report of Weatherford InternationalQ1 2009 Earning Report of Weatherford International
Q1 2009 Earning Report of Weatherford Internationalearningreport earningreport
 
Q1 2009 Earning Report of Weatherford International
Q1 2009 Earning Report of Weatherford InternationalQ1 2009 Earning Report of Weatherford International
Q1 2009 Earning Report of Weatherford Internationalearningreport earningreport
 
qwest communications Q_4Q07_profile
qwest communications Q_4Q07_profileqwest communications Q_4Q07_profile
qwest communications Q_4Q07_profilefinance19
 

Similar a unisys 3Q04_SPR (20)

unisys 2Q04_SPR
unisys 2Q04_SPRunisys 2Q04_SPR
unisys 2Q04_SPR
 
unisys 2Q04_SPR
unisys 2Q04_SPRunisys 2Q04_SPR
unisys 2Q04_SPR
 
unisys 2Q05_SPR
unisys 2Q05_SPRunisys 2Q05_SPR
unisys 2Q05_SPR
 
unisys 4Q04_SPR
unisys 4Q04_SPRunisys 4Q04_SPR
unisys 4Q04_SPR
 
unisys 2Q07_SPR
unisys 2Q07_SPRunisys 2Q07_SPR
unisys 2Q07_SPR
 
unisys 4Q06_SPR
unisys 4Q06_SPRunisys 4Q06_SPR
unisys 4Q06_SPR
 
unisys 2Q08_SPR
unisys 2Q08_SPRunisys 2Q08_SPR
unisys 2Q08_SPR
 
unisys 4Q05_SPR
unisys 4Q05_SPRunisys 4Q05_SPR
unisys 4Q05_SPR
 
unisys 1Q04_SPR
unisys 1Q04_SPRunisys 1Q04_SPR
unisys 1Q04_SPR
 
unisys 1Q07_SPR
unisys 1Q07_SPRunisys 1Q07_SPR
unisys 1Q07_SPR
 
unisys 1Q06_SPR
unisys 1Q06_SPRunisys 1Q06_SPR
unisys 1Q06_SPR
 
unisys 1Q05_SPR
unisys 1Q05_SPRunisys 1Q05_SPR
unisys 1Q05_SPR
 
unisys 1Q08_SPR
unisys 1Q08_SPRunisys 1Q08_SPR
unisys 1Q08_SPR
 
unisys 2001_3Q_10Q
unisys 2001_3Q_10Qunisys 2001_3Q_10Q
unisys 2001_3Q_10Q
 
unisys 2001_1Q_10Q
unisys 2001_1Q_10Qunisys 2001_1Q_10Q
unisys 2001_1Q_10Q
 
unisys 2002_3Q_10Q
unisys 2002_3Q_10Qunisys 2002_3Q_10Q
unisys 2002_3Q_10Q
 
qwest communications Q_3Q07_Historical_v2
qwest communications Q_3Q07_Historical_v2qwest communications Q_3Q07_Historical_v2
qwest communications Q_3Q07_Historical_v2
 
Q1 2009 Earning Report of Weatherford International
Q1 2009 Earning Report of Weatherford InternationalQ1 2009 Earning Report of Weatherford International
Q1 2009 Earning Report of Weatherford International
 
Q1 2009 Earning Report of Weatherford International
Q1 2009 Earning Report of Weatherford InternationalQ1 2009 Earning Report of Weatherford International
Q1 2009 Earning Report of Weatherford International
 
qwest communications Q_4Q07_profile
qwest communications Q_4Q07_profileqwest communications Q_4Q07_profile
qwest communications Q_4Q07_profile
 

Más de finance36

unisys 2001_10K
unisys 2001_10Kunisys 2001_10K
unisys 2001_10Kfinance36
 
unisys 2002_1Q_10Q
unisys 2002_1Q_10Qunisys 2002_1Q_10Q
unisys 2002_1Q_10Qfinance36
 
unisys 2002_2Q_10Q
unisys 2002_2Q_10Qunisys 2002_2Q_10Q
unisys 2002_2Q_10Qfinance36
 
unisys 2002_10K
unisys 2002_10Kunisys 2002_10K
unisys 2002_10Kfinance36
 
unisys 2003_1Q_10Q
unisys 2003_1Q_10Qunisys 2003_1Q_10Q
unisys 2003_1Q_10Qfinance36
 
unisys 2003_2Q_10Q
unisys 2003_2Q_10Qunisys 2003_2Q_10Q
unisys 2003_2Q_10Qfinance36
 
unisys 2003_3Q_10Q
unisys 2003_3Q_10Qunisys 2003_3Q_10Q
unisys 2003_3Q_10Qfinance36
 
unisys 2003_4Q_10K
unisys 2003_4Q_10Kunisys 2003_4Q_10K
unisys 2003_4Q_10Kfinance36
 
unisys 1Q04_10Q
unisys 1Q04_10Qunisys 1Q04_10Q
unisys 1Q04_10Qfinance36
 
unisys 2Q04_10Q
unisys 2Q04_10Qunisys 2Q04_10Q
unisys 2Q04_10Qfinance36
 
unisys 3Q04_10Q
unisys 3Q04_10Qunisys 3Q04_10Q
unisys 3Q04_10Qfinance36
 
unisys 2004_4Q_10K
unisys 2004_4Q_10Kunisys 2004_4Q_10K
unisys 2004_4Q_10Kfinance36
 
unisys 2005_2Q_10Q
unisys 2005_2Q_10Qunisys 2005_2Q_10Q
unisys 2005_2Q_10Qfinance36
 
unisys 2005_3Q_10Q
unisys 2005_3Q_10Qunisys 2005_3Q_10Q
unisys 2005_3Q_10Qfinance36
 
unisys 2005_4Q_10K
unisys 2005_4Q_10Kunisys 2005_4Q_10K
unisys 2005_4Q_10Kfinance36
 
unisys 2006_1Q_10Q
unisys 2006_1Q_10Qunisys 2006_1Q_10Q
unisys 2006_1Q_10Qfinance36
 

Más de finance36 (16)

unisys 2001_10K
unisys 2001_10Kunisys 2001_10K
unisys 2001_10K
 
unisys 2002_1Q_10Q
unisys 2002_1Q_10Qunisys 2002_1Q_10Q
unisys 2002_1Q_10Q
 
unisys 2002_2Q_10Q
unisys 2002_2Q_10Qunisys 2002_2Q_10Q
unisys 2002_2Q_10Q
 
unisys 2002_10K
unisys 2002_10Kunisys 2002_10K
unisys 2002_10K
 
unisys 2003_1Q_10Q
unisys 2003_1Q_10Qunisys 2003_1Q_10Q
unisys 2003_1Q_10Q
 
unisys 2003_2Q_10Q
unisys 2003_2Q_10Qunisys 2003_2Q_10Q
unisys 2003_2Q_10Q
 
unisys 2003_3Q_10Q
unisys 2003_3Q_10Qunisys 2003_3Q_10Q
unisys 2003_3Q_10Q
 
unisys 2003_4Q_10K
unisys 2003_4Q_10Kunisys 2003_4Q_10K
unisys 2003_4Q_10K
 
unisys 1Q04_10Q
unisys 1Q04_10Qunisys 1Q04_10Q
unisys 1Q04_10Q
 
unisys 2Q04_10Q
unisys 2Q04_10Qunisys 2Q04_10Q
unisys 2Q04_10Q
 
unisys 3Q04_10Q
unisys 3Q04_10Qunisys 3Q04_10Q
unisys 3Q04_10Q
 
unisys 2004_4Q_10K
unisys 2004_4Q_10Kunisys 2004_4Q_10K
unisys 2004_4Q_10K
 
unisys 2005_2Q_10Q
unisys 2005_2Q_10Qunisys 2005_2Q_10Q
unisys 2005_2Q_10Q
 
unisys 2005_3Q_10Q
unisys 2005_3Q_10Qunisys 2005_3Q_10Q
unisys 2005_3Q_10Q
 
unisys 2005_4Q_10K
unisys 2005_4Q_10Kunisys 2005_4Q_10K
unisys 2005_4Q_10K
 
unisys 2006_1Q_10Q
unisys 2006_1Q_10Qunisys 2006_1Q_10Q
unisys 2006_1Q_10Q
 

Último

原版1:1复刻堪萨斯大学毕业证KU毕业证留信学历认证
原版1:1复刻堪萨斯大学毕业证KU毕业证留信学历认证原版1:1复刻堪萨斯大学毕业证KU毕业证留信学历认证
原版1:1复刻堪萨斯大学毕业证KU毕业证留信学历认证jdkhjh
 
NCDC and NAFED presentation by Paras .pptx
NCDC and NAFED presentation by Paras .pptxNCDC and NAFED presentation by Paras .pptx
NCDC and NAFED presentation by Paras .pptxnaikparas90
 
(办理原版一样)QUT毕业证昆士兰科技大学毕业证学位证留信学历认证成绩单补办
(办理原版一样)QUT毕业证昆士兰科技大学毕业证学位证留信学历认证成绩单补办(办理原版一样)QUT毕业证昆士兰科技大学毕业证学位证留信学历认证成绩单补办
(办理原版一样)QUT毕业证昆士兰科技大学毕业证学位证留信学历认证成绩单补办fqiuho152
 
House of Commons ; CDC schemes overview document
House of Commons ; CDC schemes overview documentHouse of Commons ; CDC schemes overview document
House of Commons ; CDC schemes overview documentHenry Tapper
 
原版1:1复刻温哥华岛大学毕业证Vancouver毕业证留信学历认证
原版1:1复刻温哥华岛大学毕业证Vancouver毕业证留信学历认证原版1:1复刻温哥华岛大学毕业证Vancouver毕业证留信学历认证
原版1:1复刻温哥华岛大学毕业证Vancouver毕业证留信学历认证rjrjkk
 
(中央兰开夏大学毕业证学位证成绩单-案例)
(中央兰开夏大学毕业证学位证成绩单-案例)(中央兰开夏大学毕业证学位证成绩单-案例)
(中央兰开夏大学毕业证学位证成绩单-案例)twfkn8xj
 
The AES Investment Code - the go-to counsel for the most well-informed, wise...
The AES Investment Code -  the go-to counsel for the most well-informed, wise...The AES Investment Code -  the go-to counsel for the most well-informed, wise...
The AES Investment Code - the go-to counsel for the most well-informed, wise...AES International
 
Market Morning Updates for 16th April 2024
Market Morning Updates for 16th April 2024Market Morning Updates for 16th April 2024
Market Morning Updates for 16th April 2024Devarsh Vakil
 
cost of capital questions financial management
cost of capital questions financial managementcost of capital questions financial management
cost of capital questions financial managementtanmayarora23
 
SBP-Market-Operations and market managment
SBP-Market-Operations and market managmentSBP-Market-Operations and market managment
SBP-Market-Operations and market managmentfactical
 
2024 Q1 Crypto Industry Report | CoinGecko
2024 Q1 Crypto Industry Report | CoinGecko2024 Q1 Crypto Industry Report | CoinGecko
2024 Q1 Crypto Industry Report | CoinGeckoCoinGecko
 
Stock Market Brief Deck FOR 4/17 video.pdf
Stock Market Brief Deck FOR 4/17 video.pdfStock Market Brief Deck FOR 4/17 video.pdf
Stock Market Brief Deck FOR 4/17 video.pdfMichael Silva
 
『澳洲文凭』买科廷大学毕业证书成绩单办理澳洲Curtin文凭学位证书
『澳洲文凭』买科廷大学毕业证书成绩单办理澳洲Curtin文凭学位证书『澳洲文凭』买科廷大学毕业证书成绩单办理澳洲Curtin文凭学位证书
『澳洲文凭』买科廷大学毕业证书成绩单办理澳洲Curtin文凭学位证书rnrncn29
 
government_intervention_in_business_ownership[1].pdf
government_intervention_in_business_ownership[1].pdfgovernment_intervention_in_business_ownership[1].pdf
government_intervention_in_business_ownership[1].pdfshaunmashale756
 
Economic Risk Factor Update: April 2024 [SlideShare]
Economic Risk Factor Update: April 2024 [SlideShare]Economic Risk Factor Update: April 2024 [SlideShare]
Economic Risk Factor Update: April 2024 [SlideShare]Commonwealth
 
magnetic-pensions-a-new-blueprint-for-the-dc-landscape.pdf
magnetic-pensions-a-new-blueprint-for-the-dc-landscape.pdfmagnetic-pensions-a-new-blueprint-for-the-dc-landscape.pdf
magnetic-pensions-a-new-blueprint-for-the-dc-landscape.pdfHenry Tapper
 
Tenets of Physiocracy History of Economic
Tenets of Physiocracy History of EconomicTenets of Physiocracy History of Economic
Tenets of Physiocracy History of Economiccinemoviesu
 
Managing Finances in a Small Business (yes).pdf
Managing Finances  in a Small Business (yes).pdfManaging Finances  in a Small Business (yes).pdf
Managing Finances in a Small Business (yes).pdfmar yame
 
The Core Functions of the Bangko Sentral ng Pilipinas
The Core Functions of the Bangko Sentral ng PilipinasThe Core Functions of the Bangko Sentral ng Pilipinas
The Core Functions of the Bangko Sentral ng PilipinasCherylouCamus
 

Último (20)

原版1:1复刻堪萨斯大学毕业证KU毕业证留信学历认证
原版1:1复刻堪萨斯大学毕业证KU毕业证留信学历认证原版1:1复刻堪萨斯大学毕业证KU毕业证留信学历认证
原版1:1复刻堪萨斯大学毕业证KU毕业证留信学历认证
 
NCDC and NAFED presentation by Paras .pptx
NCDC and NAFED presentation by Paras .pptxNCDC and NAFED presentation by Paras .pptx
NCDC and NAFED presentation by Paras .pptx
 
(办理原版一样)QUT毕业证昆士兰科技大学毕业证学位证留信学历认证成绩单补办
(办理原版一样)QUT毕业证昆士兰科技大学毕业证学位证留信学历认证成绩单补办(办理原版一样)QUT毕业证昆士兰科技大学毕业证学位证留信学历认证成绩单补办
(办理原版一样)QUT毕业证昆士兰科技大学毕业证学位证留信学历认证成绩单补办
 
House of Commons ; CDC schemes overview document
House of Commons ; CDC schemes overview documentHouse of Commons ; CDC schemes overview document
House of Commons ; CDC schemes overview document
 
原版1:1复刻温哥华岛大学毕业证Vancouver毕业证留信学历认证
原版1:1复刻温哥华岛大学毕业证Vancouver毕业证留信学历认证原版1:1复刻温哥华岛大学毕业证Vancouver毕业证留信学历认证
原版1:1复刻温哥华岛大学毕业证Vancouver毕业证留信学历认证
 
(中央兰开夏大学毕业证学位证成绩单-案例)
(中央兰开夏大学毕业证学位证成绩单-案例)(中央兰开夏大学毕业证学位证成绩单-案例)
(中央兰开夏大学毕业证学位证成绩单-案例)
 
The AES Investment Code - the go-to counsel for the most well-informed, wise...
The AES Investment Code -  the go-to counsel for the most well-informed, wise...The AES Investment Code -  the go-to counsel for the most well-informed, wise...
The AES Investment Code - the go-to counsel for the most well-informed, wise...
 
Market Morning Updates for 16th April 2024
Market Morning Updates for 16th April 2024Market Morning Updates for 16th April 2024
Market Morning Updates for 16th April 2024
 
cost of capital questions financial management
cost of capital questions financial managementcost of capital questions financial management
cost of capital questions financial management
 
SBP-Market-Operations and market managment
SBP-Market-Operations and market managmentSBP-Market-Operations and market managment
SBP-Market-Operations and market managment
 
Q1 2024 Newsletter | Financial Synergies Wealth Advisors
Q1 2024 Newsletter | Financial Synergies Wealth AdvisorsQ1 2024 Newsletter | Financial Synergies Wealth Advisors
Q1 2024 Newsletter | Financial Synergies Wealth Advisors
 
2024 Q1 Crypto Industry Report | CoinGecko
2024 Q1 Crypto Industry Report | CoinGecko2024 Q1 Crypto Industry Report | CoinGecko
2024 Q1 Crypto Industry Report | CoinGecko
 
Stock Market Brief Deck FOR 4/17 video.pdf
Stock Market Brief Deck FOR 4/17 video.pdfStock Market Brief Deck FOR 4/17 video.pdf
Stock Market Brief Deck FOR 4/17 video.pdf
 
『澳洲文凭』买科廷大学毕业证书成绩单办理澳洲Curtin文凭学位证书
『澳洲文凭』买科廷大学毕业证书成绩单办理澳洲Curtin文凭学位证书『澳洲文凭』买科廷大学毕业证书成绩单办理澳洲Curtin文凭学位证书
『澳洲文凭』买科廷大学毕业证书成绩单办理澳洲Curtin文凭学位证书
 
government_intervention_in_business_ownership[1].pdf
government_intervention_in_business_ownership[1].pdfgovernment_intervention_in_business_ownership[1].pdf
government_intervention_in_business_ownership[1].pdf
 
Economic Risk Factor Update: April 2024 [SlideShare]
Economic Risk Factor Update: April 2024 [SlideShare]Economic Risk Factor Update: April 2024 [SlideShare]
Economic Risk Factor Update: April 2024 [SlideShare]
 
magnetic-pensions-a-new-blueprint-for-the-dc-landscape.pdf
magnetic-pensions-a-new-blueprint-for-the-dc-landscape.pdfmagnetic-pensions-a-new-blueprint-for-the-dc-landscape.pdf
magnetic-pensions-a-new-blueprint-for-the-dc-landscape.pdf
 
Tenets of Physiocracy History of Economic
Tenets of Physiocracy History of EconomicTenets of Physiocracy History of Economic
Tenets of Physiocracy History of Economic
 
Managing Finances in a Small Business (yes).pdf
Managing Finances  in a Small Business (yes).pdfManaging Finances  in a Small Business (yes).pdf
Managing Finances in a Small Business (yes).pdf
 
The Core Functions of the Bangko Sentral ng Pilipinas
The Core Functions of the Bangko Sentral ng PilipinasThe Core Functions of the Bangko Sentral ng Pilipinas
The Core Functions of the Bangko Sentral ng Pilipinas
 

unisys 3Q04_SPR

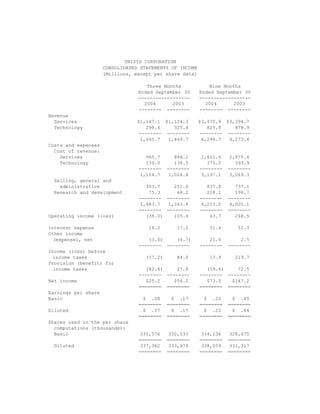
  • 1. UNISYS CORPORATION CONSOLIDATED STATEMENTS OF INCOME (Millions, except per share data) Three Months Nine Months Ended September 30 Ended September 30 ------------------ ------------------ 2004 2003 2004 2003 -------- -------- -------- -------- Revenue Services $1,147.1 $1,124.3 $3,470.9 $3,394.7 Technology 298.6 325.4 825.8 878.9 -------- -------- -------- -------- 1,445.7 1,449.7 4,296.7 4,273.6 Costs and expenses Cost of revenue: Services 965.7 886.1 2,821.6 2,675.4 Technology 139.0 138.5 375.5 393.9 -------- -------- -------- -------- 1,104.7 1,024.6 3,197.1 3,069.3 Selling, general and administrative 303.7 251.0 837.8 737.1 Research and development 75.3 68.2 218.1 198.7 -------- -------- -------- -------- 1,483.7 1,343.8 4,253.0 4,005.1 -------- -------- -------- -------- Operating income (loss) (38.0) 105.9 43.7 268.5 Interest expense 16.2 17.2 51.4 51.3 Other income (expense), net (3.0) (4.7) 21.6 2.5 -------- -------- -------- -------- Income (loss) before income taxes (57.2) 84.0 13.9 219.7 Provision (benefit) for income taxes (82.4) 27.8 (59.6) 72.5 -------- -------- -------- -------- Net income $25.2 $56.2 $73.5 $147.2 ======== ======== ======== ======== Earnings per share Basic $ .08 $ .17 $ .22 $ .45 ======== ======== ======== ======== Diluted $ .07 $ .17 $ .22 $ .44 ======== ======== ======== ======== Shares used in the per share computations (thousands): Basic 335,576 330,033 334,236 328,675 ======== ======== ======== ======== Diluted 337,362 333,979 338,059 331,317 ======== ======== ======== ========
  • 2. UNISYS CORPORATION SEGMENT RESULTS (Millions) Elimi- Total nations Services* Technology* -------- -------- -------- ---------- Three Months Ended September 30, 2004 ------------------ Customer revenue $1,445.7 $1,147.1 $298.6 Intersegment ($63.6) 5.2 58.4 -------- -------- -------- -------- Total revenue $1,445.7 ($63.6) $1,152.3 $357.0 ======== ======== ======== ======== Gross profit percent 23.6% 16.2% 51.0% ======== ======== ======== Operating profit (loss) percent (2.6%) (0.2%) 13.9% ======== ======== ======== Three Months Ended September 30, 2003 ------------------ Customer revenue $1,449.7 $1,124.3 $325.4 Intersegment ($66.4) 7.3 59.1 -------- -------- -------- -------- Total revenue $1,449.7 ($66.4) $1,131.6 $384.5 ======== ======== ======== ======== Gross profit percent 29.3% 19.8% 53.1% ======== ======== ======== Operating profit percent 7.3% 3.9% 16.5% ======== ======== ======== Nine Months Ended September 30, 2004 ------------------ Customer revenue $4,296.7 $3,470.9 $825.8 Intersegment ($166.6) 14.5 152.1 -------- -------- -------- -------- Total revenue $4,296.7 ($166.6) $3,485.4 $977.9 ======== ======== ======== ======== Gross profit percent 25.6% 17.9% 50.7% ======== ======== ======== Operating profit percent 1.0% 1.0% 9.6% ======== ======== ======== Nine Months Ended September 30, 2003 ------------------ Customer revenue $4,273.6 $3,394.7 $878.9 Intersegment ($225.6) 19.2 206.4 -------- -------- -------- -------- Total revenue $4,273.6 ($225.6) $3,413.9 $1,085.3 ======== ======== ======== ======== Gross profit percent 28.2% 19.5% 50.0% ======== ======== ======== Operating profit percent 6.3% 4.2% 12.0% ======== ======== ======== * 2004 results exclude charges for cost reductions and related actions as announced on October 6, 2004
  • 3. UNISYS CORPORATION CONSOLIDATED BALANCE SHEETS (Millions) September 30, December 31, 2004 2003 ---------- ---------- Assets Current assets Cash and cash equivalents $573.7 $635.9 Accounts and notes receivable, net 962.0 1,027.8 Inventories Parts and finished equipment 102.2 121.7 Work in process and materials 117.7 116.9 Deferred income taxes 295.0 270.0 Other current assets 104.9 85.7 ---------- ---------- Total 2,155.5 2,258.0 ---------- ---------- Properties 1,364.9 1,352.7 Less accumulated depreciation and amortization 952.5 928.5 ---------- ---------- Properties, net 412.4 424.2 ---------- ---------- Outsourcing assets, net 510.9 477.5 Marketable software, net 341.3 332.2 Investments at equity 166.4 153.3 Prepaid pension cost 49.2 55.5 Deferred income taxes 1,385.7 1,384.6 Goodwill 185.3 177.5 Other long-term assets 203.5 211.8 ---------- ---------- Total $5,410.2 $5,474.6 ========== ========== Liabilities and stockholders' equity Current liabilities Notes payable $20.0 $17.7 Current maturities of long-term debt 150.8 2.2 Accounts payable 392.6 513.8 Other accrued liabilities 1,233.5 1,305.7 Income taxes payable 153.5 214.1 ---------- ---------- Total 1,950.4 2,053.5 ---------- ---------- Long-term debt 899.5 1,048.3 Accrued pension liabilities 471.6 433.6 Other long-term liabilities 551.1 544.0 Stockholders' equity Common stock 3.4 3.3 Accumulated deficit (341.3) (414.8) Other capital 3,869.4 3,818.6 Accumulated other comprehensive loss (1,993.9) (2,011.9) ---------- ---------- Stockholders' equity 1,537.6 1,395.2 ---------- ---------- Total $5,410.2 $5,474.6 ========== ==========
  • 4. UNISYS CORPORATION CONSOLIDATED STATEMENTS OF CASH FLOWS (Millions) Nine Months Ended September 30 ------------------- 2004 2003 ------- ------- Cash flows from operating activities Net income $73.5 $147.2 Add (deduct) items to reconcile net income to net cash provided by operating activities: Depreciation and amortization of properties and outsourcing assets 181.7 154.9 Amortization of marketable software 96.6 92.2 (Increase) in deferred income taxes, net (25.3) (2.5) Decrease (increase) in receivables, net 97.2 (32.3) Decrease in inventories 19.1 43.0 (Decrease) in accounts payable and other accrued liabilities (207.5) (192.8) (Decrease) increase in income taxes payable (52.6) 19.8 Increase (decrease) in other liabilities 19.8 (44.0) (Increase) in other assets (34.0) (29.9) Other 44.7 6.5 ------- ------- Net cash provided by operating activities 213.2 162.1 ------- ------- Cash flows from investing activities Proceeds from investments 4,423.4 3,626.1 Purchases of investments (4,427.4) (3,663.2) Investment in marketable software (88.8) (109.4) Capital additions of properties and outsourcing assets (192.4) (177.9) Purchases of businesses (18.6) (2.0) ------- ------- Net cash used for investing activities (303.8) (326.4) ------- ------- Cash flows from financing activities Net reduction in short-term borrowings (1.0) (57.0) Proceeds from employee stock plans 30.9 21.0 Payments of long-term debt (2.3) (3.8) Proceeds from issuance of long-term debt 293.3 ------- ------- Net cash provided by financing activities 27.6 253.5 ------- ------- Effect of exchange rate changes on cash and cash equivalents .8 11.7 ------- ------- Increase (decrease) in cash and cash equivalents (62.2) 100.9 Cash and cash equivalents, beginning of period 635.9 301.8 ------- ------- Cash and cash equivalents, end of period $573.7 $402.7 ======= =======
  • 5. Reconciliation of GAAP to Non-GAAP Financial Information The preceding release presents information with and without pension expense or income. Unisys believes that this information will enhance an overall understanding of its financial performance due to the significant change in pension expense or income from period to period and the non-operational nature of pension expense or income. The presentation of non-GAAP information is not meant to be considered in isolation or as a substitute for results prepared in accordance with accounting principles generally accepted in the United States.
  • 6. UNISYS CORPORATION RECONCILIATION OF GAAP TO NON-GAAP CONSOLIDATED STATEMENTS OF INCOME (Millions, except per share data) Three Months Ended September 30, 2004 ---------------------------- US GAAP Less Without as Pension Pension Reported Expense Expense -------- -------- -------- Revenue $1,445.7 $1,445.7 Costs and expenses Cost of revenue 1,104.7 ($17.1) 1,087.6 Selling, general and administrative 303.7 (4.4) 299.3 Research and development 75.3 (2.0) 73.3 -------- -------- -------- 1,483.7 (23.5) 1,460.2 -------- -------- -------- Operating income (loss) (38.0) 23.5 (14.5) Interest expense 16.2 16.2 Other income (expense), net (3.0) (3.0) -------- -------- -------- Income (loss) before income taxes (57.2) 23.5 (33.7) Provision (benefit) for income taxes (82.4) 7.6 (74.8) -------- -------- -------- Net income $25.2 $15.9 $41.1 ======== ======== ======== Diluted earnings per share $ .07 $ .05 $ .12 ======== ======== ======== Three Months Ended September 30, 2003 ---------------------------- US GAAP Less Without as Pension Pension Reported Income Income -------- -------- -------- Revenue $1,449.7 $1,449.7 Costs and expenses Cost of revenue 1,024.6 $1.7 1,026.3 Selling, general and administrative 251.0 3.2 254.2 Research and development 68.2 3.6 71.8 -------- -------- -------- 1,343.8 8.5 1,352.3 -------- -------- -------- Operating income 105.9 (8.5) 97.4 Interest expense 17.2 17.2 Other income (expense), net (4.7) (4.7) -------- -------- -------- Income before income taxes 84.0 (8.5) 75.5 Provision for income taxes 27.8 (2.8) 25.0 -------- -------- -------- Net income $56.2 ($5.7) $50.5 ======== ======== ======== Diluted earnings per share $ .17 ($ .02) $ .15 ======== ======== ========
  • 7. UNISYS CORPORATION RECONCILIATION OF GAAP TO NON-GAAP CONSOLIDATED STATEMENTS OF INCOME (Millions, except per share data) Nine Months Ended September 30, 2004 ---------------------------- US GAAP Less Without as Pension Pension Reported Expense Expense -------- -------- -------- Revenue $4,296.7 $4,296.7 Costs and expenses Cost of revenue 3,197.1 ($50.4) 3,146.7 Selling, general and administrative 837.8 (14.1) 823.7 Research and development 218.1 (6.0) 212.1 -------- -------- -------- 4,253.0 (70.5) 4,182.5 -------- -------- -------- Operating income 43.7 70.5 114.2 Interest expense 51.4 51.4 Other income (expense), net 21.6 21.6 -------- -------- -------- Income before income taxes 13.9 70.5 84.4 Provision (benefit) for income taxes (59.6) 22.6 (37.0) -------- -------- -------- Net income $73.5 $47.9 $121.4 ======== ======== ======== Diluted earnings per share $ .22 $ .14 $ .36 ======== ======== ======== Nine Months Ended September 30, 2003 ---------------------------- US GAAP Less Without as Pension Pension Reported Income Income -------- -------- -------- Revenue $4,273.6 $4,273.6 Costs and expenses Cost of revenue 3,069.3 $4.4 3,073.7 Selling, general and administrative 737.1 7.6 744.7 Research and development 198.7 10.8 209.5 -------- -------- -------- 4,005.1 22.8 4,027.9 -------- -------- -------- Operating income 268.5 (22.8) 245.7 Interest expense 51.3 51.3 Other income (expense), net 2.5 2.5 -------- -------- -------- Income before income taxes 219.7 (22.8) 196.9 Provision for income taxes 72.5 (7.5) 65.0 -------- -------- -------- Net income $147.2 ($15.3) $131.9 ======== ======== ======== Diluted earnings per share $ .44 ($ .04) $ .40 ======== ======== ========
  • 8. UNISYS CORPORATION RECONCILIATION OF GAAP TO NON-GAAP SEGMENT RESULTS OF OPERATIONS (Millions) Three Months Ended September 30, 2004 ---------------------------- Less Without As Pension Pension Reported Expense Expense -------- -------- -------- Services Segment * Total revenue $1,152.3 $1,152.3 Gross profit 186.2 ($16.7) 202.9 % of revenue 16.2% 17.6% Operating income (loss) (2.2) (20.6) 18.4 % of revenue -0.2% 1.6% Technology Segment * Total revenue 357.0 357.0 Gross profit 182.0 (0.4) 182.4 % of revenue 51.0% 51.1% Operating income 49.7 (2.9) 52.6 % of revenue 13.9% 14.7% Total Company Total revenue 1,445.7 1,445.7 Gross profit 341.0 (17.1) 358.1 % of revenue 23.6% 24.8% Operating income (loss) (38.0) (23.5) (14.5) % of revenue -2.6% -1.0% Three Months Ended September 30, 2003 ---------------------------- Less Without As Pension Pension Reported Income Income -------- -------- -------- Services Segment Total revenue $1,131.6 $1,131.6 Gross profit 224.0 $1.0 223.0 % of revenue 19.8% 19.7% Operating income 43.8 3.9 39.9 % of revenue 3.9% 3.5% Technology Segment Total revenue 384.5 384.5 Gross profit 204.0 0.7 203.3 % of revenue 53.1% 52.9% Operating income 63.4 4.6 58.8 % of revenue 16.5% 15.3% Total Company Total revenue 1,449.7 1,449.7 Gross profit 425.1 1.7 423.4 % of revenue 29.3% 29.2% Operating income 105.9 8.5 97.4 % of revenue 7.3% 6.7% * 2004 results exclude charges for cost reductions and related actions as announced on October 6, 2004
  • 9. UNISYS CORPORATION RECONCILIATION OF GAAP TO NON-GAAP SEGMENT RESULTS OF OPERATIONS (Millions) Nine Months Ended September 30, 2004 ---------------------------- Less Without As Pension Pension Reported Expense Expense -------- -------- -------- Services Segment * Total revenue $3,485.4 $3,485.4 Gross profit 624.0 ($49.3) 673.3 % of revenue 17.9% 19.3% Operating income 35.2 (61.0) 96.2 % of revenue 1.0% 2.8% Technology Segment * Total revenue 977.9 977.9 Gross profit 496.2 (1.1) 497.3 % of revenue 50.7% 50.9% Operating income 94.0 (9.5) 103.5 % of revenue 9.6% 10.6% Total Company Total revenue 4,296.7 4,296.7 Gross profit 1,099.6 (50.4) 1,150.0 % of revenue 25.6% 26.8% Operating income 43.7 (70.5) 114.2 % of revenue 1.0% 2.7% Nine Months Ended September 30, 2003 ---------------------------- Less Without As Pension Pension Reported Income Income -------- -------- -------- Services Segment Total revenue $3,413.9 $3,413.9 Gross profit 666.9 $1.7 665.2 % of revenue 19.5% 19.5% Operating income 142.3 9.0 133.3 % of revenue 4.2% 3.9% Technology Segment Total revenue 1,085.3 1,085.3 Gross profit 542.6 2.7 539.9 % of revenue 50.0% 49.7% Operating income 129.8 13.8 116.0 % of revenue 12.0% 10.7% Total Company Total revenue 4,273.6 4,273.6 Gross profit 1,204.3 4.4 1,199.9 % of revenue 28.2% 28.1% Operating income 268.5 22.8 245.7 % of revenue 6.3% 5.7% * 2004 results exclude charges for cost reductions and related actions as announced on October 6, 2004
  • 10. UNISYS CORPORATION RECONCILATION OF GAAP TO NON-GAAP FORWARD-LOOKING ESTIMATED DILUTED EARNINGS PER SHARE Three Months Year Ending Ending 12/31/2004 12/31/2004 ---------- ---------- Diluted earnings per share- on a GAAP basis .27-.31 .49-.53 Add back estimated pension expense, net of tax .05 .19 --------- --------- Diluted earnings per share- on a NON-GAAP basis (excluding pension expense) .32-.36 .68-.72 ========= ========= NOTE: See section in press release entitled quot;Forward-Looking Statementsquot;.