
Recomendados
Más contenido relacionado
La actualidad más candente
La actualidad más candente (16)
Destacado
Similar a ecolab finrepor
Similar a ecolab finrepor (20)
Más de finance37
Más de finance37 (20)
Último
Último (20)
ecolab finrepor
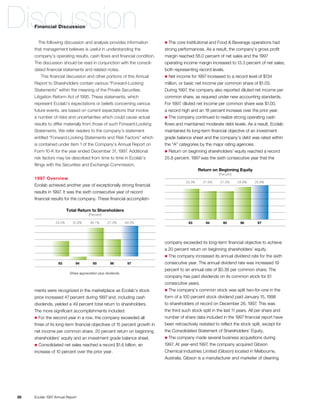
- 1. Discussion Financial Discussion n The following discussion and analysis provides information The core Institutional and Food & Beverage operations had that management believes is useful in understanding the strong performances. As a result, the company’s gross profit company’s operating results, cash flows and financial condition. margin reached 56.0 percent of net sales and the 1997 The discussion should be read in conjunction with the consoli- operating income margin increased to 13.3 percent of net sales; dated financial statements and related notes. both representing record levels. n This financial discussion and other portions of this Annual Net income for 1997 increased to a record level of $134 Report to Shareholders contain various “Forward-Looking million, or basic net income per common share of $1.03. Statements” within the meaning of the Private Securities During 1997, the company also reported diluted net income per Litigation Reform Act of 1995. These statements, which common share, as required under new accounting standards. represent Ecolab’s expectations or beliefs concerning various For 1997, diluted net income per common share was $1.00, future events, are based on current expectations that involve a record high and an 18 percent increase over the prior year. n a number of risks and uncertainties which could cause actual The company continued to realize strong operating cash results to differ materially from those of such Forward-Looking flows and maintained moderate debt levels. As a result, Ecolab Statements. We refer readers to the company’s statement maintained its long-term financial objective of an investment entitled “Forward-Looking Statements and Risk Factors” which grade balance sheet and the company’s debt was rated within is contained under Item 1 of the Company’s Annual Report on the “A” categories by the major rating agencies. n Form 10-K for the year ended December 31, 1997. Additional Return on beginning shareholders’ equity reached a record risk factors may be described from time to time in Ecolab’s 25.8 percent. 1997 was the sixth consecutive year that the filings with the Securities and Exchange Commission. Return on Beginning Equity (Percent) 1997 Overview 23.3% 21.6% 21.5% 24.8% 25.8% Ecolab achieved another year of exceptionally strong financial results in 1997. It was the sixth consecutive year of record financial results for the company. These financial accomplish- Total Return to Shareholders (Percent) 24.5% (5.3)% 46.1% 27.3% 49.0% 93 94 95 96 97 company exceeded its long-term financial objective to achieve a 20 percent return on beginning shareholders’ equity. n The company increased its annual dividend rate for the sixth consecutive year. The annual dividend rate was increased 19 93 94 95 96 97 percent to an annual rate of $0.38 per common share. The Share appreciation plus dividends. company has paid dividends on its common stock for 61 consecutive years. n The company’s common stock was split two-for-one in the ments were recognized in the marketplace as Ecolab’s stock form of a 100 percent stock dividend paid January 15, 1998 price increased 47 percent during 1997 and, including cash to shareholders of record on December 26, 1997. This was dividends, yielded a 49 percent total return to shareholders. the third such stock split in the last 11 years. All per share and The more significant accomplishments included: number of share data included in the 1997 financial report have n For the second year in a row, the company exceeded all been retroactively restated to reflect the stock split, except for three of its long-term financial objectives of 15 percent growth in the Consolidated Statement of Shareholders’ Equity. net income per common share, 20 percent return on beginning n The company made several business acquisitions during shareholders’ equity and an investment grade balance sheet. 1997. At year-end 1997, the company acquired Gibson n Consolidated net sales reached a record $1.6 billion, an Chemical Industries Limited (Gibson) located in Melbourne, increase of 10 percent over the prior year. Australia. Gibson is a manufacturer and marketer of cleaning 28 Ecolab 1997 Annual Report
- 2. Financial Discussion and sanitizing products, primarily for the Australian and New in sales for 1997. The growth in sales also reflected the benefits Zealand institutional, healthcare and industrial markets. Gibson of new product introductions, an increased sales-and-service has been included in the company’s consolidated balance force, new customers and competitive gains. A continuation of sheet at year-end 1997 and will be included in the company’s generally good conditions in the hospitality and lodging industries, consolidated results of operations beginning in 1998. Gibson particularly in the United States, also had a favorable effect on had annual sales of approximately $130 million in 1997. sales for 1997. During 1997, the company also added to its Institutional and Consolidated operating income increased 18 percent for Food & Beverage operations in the United States and to its 1997 and reached $219 million compared to consolidated operations in Canada and in the Central Africa region through operating income of $185 million in 1996. This growth included business acquisitions. the benefits of business acquisitions, which accounted for All of these acquisitions have been accounted for as approximately 20 percent of the increase. The consolidated purchases, and accordingly, the results of their operations have operating income margin was 13.3 percent in 1997, a substantial been included in the company’s financial statements from the improvement over the 1996 consolidated operating income dates of acquisition. Additional information related to these margin of 12.4 percent. Most of the company’s businesses acquisitions is included in Note 5 of the notes to consolidated contributed to these income improvements; however, strong financial statements. performances by the core U.S. Institutional and Food & Beverage businesses during 1997 were the major contributors to the Operating Results company’s overall profit improvement. The increase in the operating income margin for 1997 reflected a substantial Consolidated increase in the gross profit margin, which was partially offset by a modest increase in selling, general and administrative (thousands, except per share) 1997 1996 1995 expenses as a percentage of net sales. The gross profit margin Net sales $1,640,352 $1,490,009 $1,340,881 improved to 56.0 percent in 1997 from a gross profit margin Operating income 218,504 185,317 162,686 of 54.7 percent in 1996. The increase in gross profit margin Net income $ 133,955 $ 113,185 $ 99,189 reflected higher sales levels of the company’s more profitable Net income per common share core U.S. operations, a more stable raw material cost environ- Basic $ 1.03 $ 0.88 $ 0.75 ment and good sales volume growth, particularly in the sales of Diluted $ 1.00 $ 0.85 $ 0.73 new products. The benefits of selling price increases continued Consolidated net sales for 1997 were over $1.6 billion, to be limited due to market pressures. Selling, general and an increase of 10 percent compared to net sales of nearly administrative expenses were 42.7 percent of net sales in $1.5 billion in 1996. Both the company’s U.S. and International 1997, compared to 42.3 percent of net sales in 1996. This operations contributed to this sales growth. Business acquisi- increase reflected investments in the sales-and-service force tions in 1997 and the annualized effect of businesses acquired and the higher sales levels of the core U.S. operations, which in 1996 accounted for approximately one-fourth of the growth have relatively higher selling expenses. These increases were partially offset by continued tight cost controls, improved sales Consolidated Sales productivity levels and strong sales growth during 1997. The Business Mix (Dollars in Millions) company anticipates that the monetary problems which began United States 78% $1,341 $1,490 $1,640 in East Asia in late 1997 will slow the growth of consolidated International 22% operating income results in 1998, particularly early in the year. However, the impact is expected to be limited unless substan- tially broader areas of the Asia Pacific region are affected. Net income for 1997 reached $134 million, or $1.00 per share on a diluted basis, and increased 18 percent over last 97 95 96 97 year’s net income of $113 million, or $0.85 per share. Net income improved to 8.2 percent of net sales, compared to 29 Ecolab 1997 Annual Report
- 3. Financial Discussion United States 7.6 percent in 1996. The increase in net income reflected the benefits of strong operating income performance, lower net (thousands) 1997 1996 1995 interest expense and modestly higher equity in earnings of Net sales $1,275,828 $1,148,778 $1,030,126 the Henkel-Ecolab joint venture, which were partially offset by Operating income $ 195,630 $ 164,886 $ 147,330 increased income taxes. Percent of sales 15.3% 14.4% 14.3% 1996 compared with 1995 Sales of the company’s U.S. operations were nearly Consolidated net sales were nearly $1.5 billion in 1996 and $1.3 billion in 1997 and increased 11 percent over sales of increased 11 percent over net sales of $1.3 billion in 1995. $1.1 billion in 1996. U.S. sales reflected strong growth in the Both the company’s U.S. and International operations con- core Institutional and Food & Beverage operations and in Pest tributed to this sales improvement. Businesses acquired during Elimination sales and included benefits from business acquisi- 1996 and during late 1995 accounted for approximately one-half tions, significant new product introductions, new customers and of the growth in sales for 1996. New product introductions competitive gains, investments in the sales-and-service force continued to contribute significantly to sales growth, with and a continuation of good business trends in the hospitality additions to the sales force and competitive gains also adding and lodging industries. The benefits of selling price increases to the sales improvement. continued to be limited due to tight pricing conditions in several Consolidated operating income reached $185 million in of the markets in which the company does business. Business 1996, an increase of 14 percent over operating income of acquisitions accounted for approximately 25 percent of U.S. $163 million in 1995. This improvement included good growth in sales growth for 1997. Sales of the U.S. Institutional Division the company’s core U.S. Institutional operations and double- increased 10 percent for 1997. Institutional’s growth reflected digit growth in all of the company’s other U.S. businesses and strong sales in all of its business units, significant new customer in all major regions of International operations. The consolidated business and competitive gains, continued strong growth in its operating income margin was 12.4 percent in 1996, an improve- Ecotemp program and the successful rollout of its new Keystone ment over the operating income margin of 12.1 percent in 1995. product line sold through partnership with a distributor. The Pest The benefits of the company’s continuing cost-control efforts Elimination Division also reported a 10 percent sales growth for more than offset increased raw material costs and limited selling 1997, despite increased competitive activity. Pest Elimination price increases. continues to develop new programs to leverage its alliances Net income for 1996 was $113 million, an increase of with Ecolab’s other divisions. Sales of Kay’s U.S. operations 14 percent over net income of $99 million in 1995. The increase increased 6 percent for 1997. Kay was unfavorably affected by in net income reflected strong operating income performance a more competitive quickservice market; however, Kay added and increased equity in earnings of the Henkel-Ecolab joint another major quickservice chain customer in 1997 and had venture, partially offset by increases in net interest expense good growth in sales to the grocery market, which it entered and income taxes. Diluted net income per common share was last year. Sales of the Textile Care Division decreased 3 percent $0.85 for 1996 and increased 16 percent over 1995’s diluted for 1997. Continued plant consolidations, particularly in laundries net income per common share of $0.73. The comparison of serving the healthcare market, increased competitive activity net income per common share benefited from a smaller number and comparison against periods that benefited significantly from of average shares outstanding in 1996, principally due to the new product introductions unfavorably affected Textile Care’s purchase of approximately 7 million shares of the company’s sales growth. The company expects the U.S. Textile Care common stock in mid-1995 under the terms of a “Dutch auction” self-tender offer. United States Sales Business Mix (Dollars in Millions) $1,030 $1,149 $1,276 Institutional 55% Food & Beverage 16% Pest Elimination 8% Professional Products 8% Kay 6% Textile Care 5% 97 95 96 97 Water Care Services 2% 30 Ecolab 1997 Annual Report
- 4. Financial Discussion 1996 compared with 1995 business to continue to experience challenging market conditions over the near term. The Professional Products Sales of the company’s U.S. operations exceeded $1.1 billion in Division reported sales growth of 12 percent for 1997. This sales 1996, an increase of 12 percent over U.S. sales of $1.0 billion in improvement reflected last year’s acquisition of Huntington 1995. U.S. sales growth reflected business acquisitions and the Laboratories, good growth in sales to corporate accounts, and benefits of significant new product introductions. Business the addition of new products to its commercial mass distribu- acquisitions accounted for approximately one-half of the tion line. Sales of the company’s Water Care Services Division increase in U.S. sales. Sales of the U.S. Institutional Division were down 2 percent for 1997 and reflected the elimination of increased 4 percent for 1996. Institutional sales growth reflected competitive gains and continued strong growth in its Ecotemp low margin business, consolidation of business acquisitions made over the past three years, integration of disparate product program and the specialty products group. Pest Elimination lines, and the refining of sales efforts. The Food & Beverage sales increased 12 percent over the prior year, reflecting new Division reported a sales increase of 24 percent for 1997. Food business and a continued high retention of key customers. & Beverage sales growth included the benefits of Chemidyne, Kay’s U.S. operations reported sales growth of 11 percent for a provider of cleaning and sanitizing products and equipment 1996 due to new customer business and the growth of the to the meat, poultry and processed food markets, which was large quickservice chains, which are the core of Kay’s business. acquired in August 1997, and the annualized effect of the acquisi- The Textile Care Division reported sales growth of 9 percent for tion of Monarch in August of 1996. Excluding these business 1996, with continued success in sales of new products and acquisitions, Food & Beverage sales growth was 9 percent double-digit growth in sales to the commercial laundry market. for 1997 and included growth in sales to all of its markets with Sales of the company’s Professional Products Division nearly double-digit growth in sales to the food processing and doubled due to the February 1996 acquisition of Huntington beverage markets. Laboratories. Excluding sales of the Huntington operations, Operating income for the company’s U.S. operations Professional Products sales for 1996 increased 3 percent over reached $196 million, an increase of 19 percent over operating 1995, principally due to sales growth of its Airkem products. income of $165 million in 1996. Business acquisitions accounted Sales of the Food & Beverage Division increased 13 percent for approximately 20 percent of U.S. operating income growth for 1996 and included the operations of Monarch since its for 1997. With the exception of the Textile Care Division, all of acquisition from H.B. Fuller in August 1996. Excluding Monarch the company’s U.S. businesses reported increased operating sales, Food & Beverage sales growth was 5 percent for 1996, income, with particularly strong growth in the core Institutional and reflected new customer gains and good growth in sales and Food & Beverage operations. The U.S. operating income to the beverage and food processing markets. Sales of the margin improved to 15.3 percent of net sales from 14.4 percent company’s recently formed Water Care Services Division more in 1996. The improved operating income margin reflected the than doubled during 1996 due to the annualization of sales from benefits of strong core business sales, sales of new products, business acquisitions and sales gained by successfully leverag- stable raw material costs, sales productivity improvements and ing its alliances with Ecolab’s other divisions. tight cost controls, which were partially offset by investments in Operating income for the company’s U.S. businesses totaled the sales-and-service force. During 1997, the company added $165 million for 1996 and increased 12 percent over operating approximately 285 sales-and-service personnel, including income of $147 million in 1995. The growth in operating income Chemidyne associates. included good growth in the company’s U.S. Institutional business and double-digit increases in operating income of all of the company’s other U.S. divisions. The U.S. operating income margin was 14.4 percent, up slightly compared to the operating income margin of 14.3 percent in 1995. The improve- ment in operating income margin reflected higher sales levels, sales productivity gains and the benefits of company-wide cost-control programs. 31 Ecolab 1997 Annual Report
- 5. Financial Discussion International beverage markets and good growth in Institutional sales. Canada reported sales growth of 15 percent for 1997, which (thousands) 1997 1996 1995 included a modest negative impact from changes in currency Net sales $364,524 $341,231 $310,755 translation. Approximately 70 percent of Canada’s sales growth Operating income $ 26,962 $ 23,871 $ 19,580 was due to business acquisitions. Canada’s results also included Percent of sales 7.4% 7.0% 6.3% good growth in sales to the institutional and food and beverage markets. Overall International sales results for 1997 included the The company’s International business consists of established benefits of business acquisitions in Central Africa during 1997 major operations in Asia Pacific, Latin America and Canada. In and good growth in sales of Kay’s international operations. Sales addition, on a smaller scale, Kay serves various international in South Africa decreased during 1997, principally due to the markets and the company has start-up operations in Africa and elimination of low margin business. serves various international locations through its export business. Operating income for International’s operations totaled Net sales of the company’s International operations totaled $27 million in 1997, an increase of 13 percent over operating $365 million for 1997, which represented growth of 7 percent income of $24 million in 1996. Business acquisitions accounted over sales of $341 million in 1996. International sales growth for approximately 40 percent of the growth in International’s included benefits of business acquisitions and significant operating income for 1997. Excluding the effects of currency new product introductions. Businesses acquired in Canada translation, International operating income growth was and Africa in 1997 and the annualization of 1996 Canadian 21 percent for 1997. Reported operating income margins business acquisitions accounted for approximately 50 percent improved to 7.4 percent of net sales in 1997 compared with of International’s sales growth for 1997. Changes in currency 7.0 percent in 1996. Double-digit operating income growth translation had a negative impact on reported sales, particularly in Asia Pacific and Canada more than offset a decrease in in the Asia Pacific region. Excluding the effects of currency operating income in the Latin America region, which was translation, sales of International operations increased 11 percent principally due to investments in Brazil and Argentina. The for 1997. The Asia Pacific region, International’s largest operation, company expects the monetary problems that began in East reported sales growth of 2 percent for 1997. However, when Asia in late 1997 to impact the Asia Pacific region in 1998. measured in local currencies, Asia Pacific had sales growth of Although the company’s operations in the areas primarily 9 percent with double-digit growth in Japan, modest growth affected are limited, the company is cautious about growth for in New Zealand and flat results in Australia. Asia Pacific sales the year due to the uncertain economic conditions in the region. to institutional markets increased at double-digit rates and the Operating income margins of the company’s International region recorded good growth in sales to the food and beverage operations are substantially less than the operating income markets. The acquisition of Gibson, primarily serving the Australian margins realized for the company’s U.S. operations. The lower and New Zealand institutional, healthcare and industrial markets, International margins are due to the difference in scale of was effective at year-end 1997 and will add significantly to the International operations, where operating locations are smaller company’s operations in the Asia Pacific region in 1998. Latin in size, and to the additional costs of operating in numerous America reported U.S. dollar sales growth of 9 percent for 1997. and diverse foreign jurisdictions. Proportionately larger invest- The effects of changes in currency translation did not have a ments in sales and administrative personnel are also necessary significant impact on Latin America’s reported sales. Growth in order to facilitate growth of International operations. in the Latin America region was led by Mexico with significant double-digit growth and included good growth in Brazil. The 1996 compared with 1995 region reported double-digit growth in sales to the food and Total revenues for International operations of $341 million in 1996 increased 10 percent over revenues of $311 million in 1995. International Sales Business Mix (Dollars in Millions) International’s sales growth reflected the benefits of business acquisitions and sales of new products. Business acquisitions $311 $341 $365 Asia Pacific 43% accounted for approximately 40 percent of International’s sales Latin America 24% growth over 1995. Changes in currency translation had a Canada 20% negative impact on sales, particularly in the Asia Pacific region. Kay, Africa and Other 13% Asia Pacific reported sales growth of 4 percent for 1996. When measured in local currencies, the Asia Pacific region had sales growth of 9 percent, with double-digit growth in Japan and 97 95 96 97 New Zealand and modest growth in Australia. Reported sales 32 Ecolab 1997 Annual Report
- 6. Financial Discussion of the Latin America region increased 13 percent over the prior Ecolab’s Equity Henkel-Ecolab in Earnings year. Excluding the effects of currency translation, Latin America Business Mix (Dollars in Millions) recorded sales growth of 16 percent for 1996, which included $8 $13 $13 Institutional 36% a continuation of significant double-digit growth in Brazil and Professional Hygiene 25% good sales growth in Mexico and Puerto Rico. Sales in Canada Food (P3) Hygiene 25% increased 9 percent over sales in 1995 and reflected the benefits Textile Hygiene 14% of the Huntington and Monarch acquisitions and good growth in sales to institutional markets. Sales in South Africa more than doubled over the prior year, reflecting the annualization of sales 97 95 96 97 from businesses acquired in late 1995. Sales of Kay’s interna- tional operations increased 16 percent for 1996. 1996 compared with 1995 The company’s International operations reported operating The company’s equity in earnings of the Henkel-Ecolab joint income of $24 million in 1996, an increase of 22 percent over venture was $13 million for 1996, a 69 percent increase over operating income of $20 million in 1995. Excluding the effects of weak results of $8 million in 1995. The improvement reflected currency translation, International operating income growth was the benefits from a number of cost-control programs that were 29 percent for 1996. The reported operating income margin put into effect in 1996. Operating results at the joint venture also improved to 7.0 percent compared with the operating income reflected lower interest expense and lower overall income tax margin of 6.3 percent in the prior year. Operating income rates. Joint venture revenues increased 4 percent for 1996 when results included double-digit growth and improved operating measured in Deutsche marks. When measured in U.S. dollars, income margins in each of the major regions of Asia Pacific, joint venture sales were negatively affected by the strengthening Latin America and Canada, with a continuation of particularly U.S. dollar, and totaled $905 million, just below the $909 million strong growth in Brazil. of sales recorded for 1995. Henkel-Ecolab Joint Venture Corporate The company operates institutional and industrial cleaning and Corporate operating expense was $4 million in 1997, $3 million sanitizing businesses in Europe through its 50 percent eco- in 1996 and $4 million in 1995. Corporate operating expense nomic interest in the Henkel-Ecolab joint venture. The company includes overhead costs directly related to the joint venture. includes the operations of the Henkel-Ecolab joint venture in its financial statements using the equity method of accounting. Interest and Income Taxes The company’s equity in earnings of the joint venture, including Net interest expense decreased 12 percent to less than royalty income and after deduction of intangible amortization, $13 million in 1997, compared to net interest expense of over was $13 million in 1997, a 3 percent increase over 1996. Results $14 million in 1996. This decrease was principally due to a were negatively affected by the stronger U.S. dollar. When scheduled debt repayment on the company’s 9.68 percent measured in Deutsche marks, net income of the joint venture senior notes and to increased interest income earned on higher increased 11 percent and reflected increased sales, improved average levels of cash and cash equivalents held during 1997. gross margins and lower interest expense, partially offset by The company anticipates that its net interest expense will investments in the sales-and-service force. increase substantially for 1998 compared with 1997 levels, Joint venture sales, although not consolidated in Ecolab’s due to borrowings incurred under the Multicurrency Credit financial statements, increased 7 percent for 1997 when Agreement in late 1997 for the Gibson acquisition. measured in Deutsche marks and included the benefits of a Net interest expense for 1996 increased 25 percent over business acquisition, benefits of new product transfers from net interest expense of $12 million in 1995. This increase was Ecolab to the joint venture and good sales to the institutional due to higher debt levels during 1996, particularly during the first and food hygiene markets. When measured in U.S. dollars, half of the year, reflecting cash used during 1995 for the stock however, joint venture sales for 1997 decreased 7 percent. purchase self-tender offer and for business acquisitions during late 1995 and during 1996. 33 Ecolab 1997 Annual Report
- 7. Financial Discussion the status of such third parties’ year 2000 remediation plans. The company’s annual effective income tax rate was If the company were to determine that a supplier, vendor or 41.5 percent for 1997, a modest increase from the 1996 customer will not be able to remediate its year 2000 issue, the effective income tax rate of 41.4 percent. This increase was company would anticipate taking such steps as it reasonably due to a slightly higher overall effective rate on earnings of could to mitigate the effects. International operations. International’s effective income tax As part of its year 2000 process the company anticipates rate varies from year to year with the pre-tax income mix of the testing its systems for compliance; however, at this time only various countries in which the company operates and savings limited testing has occurred. related to the availability of one-time tax strategies. Risks and uncertainties associated with the year 2000 The company’s annual effective income tax rate of 41.4 conversion are discussed in the company’s Form 10-K for the percent in 1996 increased from 39.5 percent in 1995. The year ended December 31, 1997 under the heading “Forward- increase in the effective income tax rate for 1996 was primarily Looking Statements and Risk Factors”. due to a higher overall effective rate on earnings of International operations and to the effects of business acquisitions. Financial Position, Cash Flows and Liquidity As a result of tax losses on the disposition of a discontinued business in 1992, the company’s U.S. federal income tax Financial Position payments were reduced in 1995 and prior years by a total of The company reached its long-term financial objective of an approximately $58 million, including $3 million in 1995. However, investment grade balance sheet in 1993 and has continued to pending final acceptance of the company’s treatment of the maintain this objective for the last five years. The company’s losses, no income tax benefit has been recognized for financial debt was rated within the “A” categories by the major rating reporting purposes. Additional reductions in U.S. federal agencies during 1997. Significant changes to the company’s income tax payments are not anticipated. balance sheet during 1997 included the following: n Year 2000 Conversion The company’s balance sheet as of December 31, 1997 The “year 2000” issue is the result of computer programs reflected the assets and liabilities of Gibson and the other having date-sensitive software which may recognize a date businesses acquired during 1997. The increase in other using “00” as the year 1900 rather than the year 2000. This noncurrent assets from year-end 1996 was principally due to can result in system failure or miscalculations. The company these acquisitions. Significant levels of accounts receivable, recognizes the need to ensure that its operations will not be inventories, property, plant and equipment and other current adversely affected by year 2000 issues and is establishing liabilities were also added during 1997 as a result of these processes which it believes will be sufficient to evaluate and business acquisitions. n manage risks associated with the problem. Total debt was $308 million as of December 31, 1997 and The company has largely completed a review of year 2000 increased from total debt of $176 million at year-end 1996 and compliance for its critical operating and application systems, $161 million at year-end 1995. The increase in total debt during particularly customer-oriented systems such as sales and order 1997 included $116 million of borrowings incurred under the processing, billing and collections. As a result, the company has company’s Multicurrency Credit Agreement to finance the determined that it will be required to modify or replace signifi- purchase of the outstanding common shares of Gibson, and cant portions of its software. This process is in progress and the $22 million of debt which was included on Gibson’s balance intention is to complete it by the end of 1998. The costs are not sheet at the time of acquisition. As of December 31, 1997, the expected to be significant. ratio of total debt to capitalization was 36 percent, compared to The company is also in the process of analyzing its dispens- 25 percent at year-end 1996 and 26 percent at year-end 1995. ing and cleaning systems and its manufacturing and building Total Debt to maintenance operations for dependence on date-sensitive Capitalization software to identify and resolve any relevant issues in advance 26% 25% 36% Shareholders’ Equity 64% of the year 2000. Although a final cost estimate has not been Total Debt 36% determined, at this time the company does not believe the cost will be material. The company has begun the process of surveying key suppliers, vendors and customers to determine 97 95 96 97 34 Ecolab 1997 Annual Report
- 8. Financial Discussion provided by continuing operating activities was favorably In late 1997, the company amended and restated its $225 affected by increased earnings during 1997 and higher divi- million Multicurrency Credit Agreement in order to provide for dends received from the Henkel-Ecolab joint venture. financing of the Gibson acquisition. The amended and restated Cash provided by discontinued operations in 1995 reflects agreement increased the credit available to $275 million, a reduction in income tax payments as a result of the loss on extended the term one year to September 2002 and specifically the disposition of a discontinued business. provided for anticipated borrowings of Australian dollars. n Cash flows used for investing activities included capital Working capital was $105 million at December 31, 1997, expenditures of $122 million in 1997, $112 million in 1996 and compared with working capital of $108 million at year-end 1996 $110 million in 1995. Worldwide additions of merchandising and $48 million at year-end 1995. The levels of cash and cash equipment, primarily cleaning and sanitizing product dispensers, equivalents and short-term debt at year-end 1995 were affected accounted for approximately 70 percent of each year’s capital by the company’s stock purchase self-tender offer in mid-1995. n expenditures. The company has expanded its manufacturing The lower level of the company’s investment in the Henkel- facilities over the last two years through construction and Ecolab joint venture at year-end 1997 was principally due to the business acquisitions in order to meet sales requirements more effects of changes in currency translation and dividends which efficiently. Cash was also used in 1997 for business acquisitions, were received from the joint venture. n primarily Gibson and Chemidyne. Other noncurrent liabilities were $125 million at December 31, Cash provided by financing activities included $116 million 1997 and decreased from year-end 1996 due to an income tax of debt incurred under the Multicurrency Credit Agreement deposit made against outstanding federal income tax issues. n to acquire Gibson. Strong operating cash flows were used The company capitalizes certain costs of computer software to provide cash for shares reacquired, cash dividends and developed or obtained for internal use. The amounts capitalized a scheduled repayment on the company’s 9.68 percent are not significant and the company’s policy for the capitaliza- senior notes. tion of these costs is consistent with the guidelines included in In 1997, the company increased its annual dividend rate for the American Institute of Certified Public Accountants recent the sixth consecutive year. The company has paid dividends on Statement of Position for accounting for costs of computer its common stock for 61 consecutive years. Cash dividends software developed or obtained for internal use. declared per share of common stock, by quarter, for each of the last three years were as follows: Cash Flows For 1997, the company generated $235 million of cash from First Second Third Fourth continuing operating activities, compared with $254 million in Quarter Quarter Quarter Quarter Year 1996 and $163 million in 1995. The decrease in operating cash 1997 $0.08 $0.08 $0.08 $0.095 $0.335 1996 0.07 0.07 0.07 0.08 0.29 Cash from Continuing Operating Activities 1995 0.0625 0.0625 0.0625 0.07 0.2575 (Dollars in Millions) $151 $154 $163 $254 $235 Liquidity The company maintains a committed line of credit under the Multicurrency Credit Agreement for general corporate financing needs. The agreement includes a competitive bid feature to minimize the cost of the company’s borrowings. The company also has a $200 million shelf registration as an alternative 93 94 95 96 97 source of liquidity. The company believes its existing cash balances, cash generated by operating activities, including cash flows from 1996 reflected the reversal of favorable timing of flows from the joint venture, and available credit are adequate payments, which affected the fourth quarter of 1996 and an to fund all of its 1998 requirements for growth, possible income tax deposit made in 1997 against outstanding federal acquisitions, new program investments, scheduled debt income tax issues that had been accrued for in other noncur- repayments and dividend payments. rent liabilities. The decrease also reflected favorable cash flows during 1996 from the collection of accounts receivable related to strong fourth quarter 1995 sales. The comparison of cash 35 Ecolab 1997 Annual Report
- 9. Income Consolidated Statement of Income 1997 1996 1995 Year ended December 31 (thousands, except per share) Net Sales $1,640,352 $1,490,009 $1,340,881 Cost of Sales 722,084 674,953 603,167 Selling, General and Administrative Expenses 699,764 629,739 575,028 Operating Income 218,504 185,317 162,686 Interest Expense, Net 12,637 14,372 11,505 Income Before Income Taxes and Equity in Earnings of Joint Venture 205,867 170,945 151,181 Provision for Income Taxes 85,345 70,771 59,694 Equity in Earnings of Henkel-Ecolab Joint Venture 13,433 13,011 7,702 Net Income $ 133,955 $ 113,185 $ 99,189 Net Income Per Common Share Basic $ 1.03 $ 0.88 $ 0.75 Diluted $ 1.00 $ 0.85 $ 0.73 Weighted Average Common Shares Outstanding Basic 129,446 128,991 132,193 Diluted 133,822 132,817 134,956 See notes to consolidated financial statements. 36 Ecolab 1997 Annual Report
- 10. Balance Sheet Consolidated Balance Sheet 1997 1996 1995 December 31 (thousands, except per share) Assets Cash and cash equivalents $ 61,169 $ 69,275 $ 24,718 Accounts receivable, net 246,041 205,026 198,432 Inventories 154,831 122,248 106,117 Deferred income taxes 34,978 29,344 21,617 Other current assets 12,482 9,614 7,188 Current Assets 509,501 435,507 358,072 Property, Plant and Equipment, Net 395,562 332,314 292,937 Investment in Henkel-Ecolab Joint Venture 239,879 285,237 302,298 Other Assets 271,357 155,351 107,573 Total Assets $1,416,299 $1,208,409 $1,060,880 Liabilities and Shareholders’ Equity Short-term debt $ 48,884 $ 27,609 $ 71,647 Accounts payable 130,682 103,803 81,931 Compensation and benefits 74,317 71,533 59,766 Income taxes 13,506 26,977 18,248 Other current liabilities 137,075 97,849 78,946 Current Liabilities 404,464 327,771 310,538 Long-Term Debt 259,384 148,683 89,402 Postretirement Health Care and Pension Benefits 76,109 73,577 70,666 Other Liabilities 124,641 138,415 133,616 Shareholders’ Equity (common stock, par value $1.00 per share; shares outstanding: 1997 – 129,127; 1996 – 129,600; 1995 – 129,403) 551,701 519,963 456,658 Total Liabilities and Shareholders’ Equity $1,416,299 $1,208,409 $1,060,880 See notes to consolidated financial statements. Ecolab 1997 Annual Report 37
- 11. Cash Flows Consolidated Statement of Cash Flows 1997 1996 1995 Year ended December 31 (thousands) Operating Activities Net income $ 133,955 $ 113,185 $ 99,189 Adjustments to reconcile net income to cash provided by operating activities: Depreciation 84,415 75,185 64,651 Amortization 16,464 14,338 11,628 Deferred income taxes (2,074) (6,878) (759) Equity in earnings of joint venture (13,433) (13,011) (7,702) Joint venture royalties and dividends 25,367 15,769 5,610 Other, net 4,630 1,023 801 Changes in operating assets and liabilities: Accounts receivable (21,231) 2,809 (26,843) Inventories (14,395) (6,852) (4,136) Other assets (10,993) (5,255) (11,371) Accounts payable 20,876 16,397 4,561 Other liabilities 11,517 47,559 27,834 Cash provided by continuing operations 235,098 254,269 163,463 Cash provided by discontinued operations 3,000 Cash provided by operating activities 235,098 254,269 166,463 Investing Activities Capital expenditures (121,667) (111,518) (109,894) Property disposals 3,424 3,284 1,806 Sale of investments in securities 4,007 Businesses acquired (157,234) (54,911) (26,437) Other, net (1,240) (1,449) 6,991 Cash used for investing activities (276,717) (164,594) (123,527) Financing Activities Notes payable 9,280 (42,045) 29,355 Long-term debt borrowings 117,000 75,000 2,141 Long-term debt repayments (15,210) (35,690) (20,060) Reacquired shares (60,795) (22,790) (90,391) Cash dividends on common stock (41,456) (36,096) (33,114) Other, net 26,278 17,088 (4,561) Cash provided by (used for) financing activities 35,097 (44,533) (116,630) Effect of exchange rate changes on cash (1,584) (585) 157 Increase (Decrease) in Cash and Cash Equivalents (8,106) 44,557 (73,537) Cash and cash equivalents, beginning of year 69,275 24,718 98,255 Cash and cash equivalents, end of year $ 61,169 $ 69,275 $ 24,718 Bracketed amounts indicate a use of cash. See notes to consolidated financial statements. 38 Ecolab 1997 Annual Report
- 12. Shareholders’ Equity Consolidated Statement of Shareholders’ Equity Common Additional Retained Deferred Cumulative Treasury (thousands) Stock Paid-in Capital Earnings Compensation Translation Stock Total Balance December 31, 1994 $ 69,659 $164,858 $257,462 $(4,192) $ 6,756 $ (32,735) $461,808 Net income 99,189 99,189 Cash dividends on common stock (33,715) (33,715) Stock options 419 6,422 6,841 Stock awards 485 2,738 (4,745) 2,479 957 Reacquired shares (90,391) (90,391) Amortization 2,453 2,453 Translation 9,516 9,516 Balance December 31, 1995 70,078 171,765 325,674 (6,484) 16,272 (120,647) 456,658 Net income 113,185 113,185 Cash dividends on common stock (37,409) (37,409) Stock options 673 14,824 15,497 Stock awards 522 2,912 (3,638) 1,779 1,575 Reacquired shares (22,790) (22,790) Amortization 2,732 2,732 Translation (9,485) (9,485) Balance December 31, 1996 70,751 187,111 404,362 (7,390) 6,787 (141,658) 519,963 Net income 133,955 133,955 Cash dividends on common stock (43,367) (43,367) Stock options 648 15,877 16,525 Stock awards 5,093 (5,200) 1,427 1,320 Business acquisitions 12,454 3,946 16,400 Reacquired shares (60,795) (60,795) Amortization 3,430 3,430 Translation (35,730) (35,730) Stock dividend 71,398 (71,398) Balance December 31, 1997 $142,797 $149,137 $494,950 $(9,160) $(28,943) $(197,080) $551,701 Common Stock Activity 1997 1996 1995 Year ended December 31 (shares) Common Stock Treasury Stock Common Stock Treasury Stock Common Stock Treasury Stock Shares, beginning of year 70,750,741 (5,950,518) 70,078,398 (5,376,917) 69,659,101 (1,988,427) Stock options 648,085 672,343 419,297 Stock awards 124,440 150,010 198,314 Business acquisitions 308,343 Reacquired shares (1,317,077) (723,611) (3,586,804) Stock dividend 71,397,826 (6,834,812) Shares, end of year 142,796,652 (13,669,624) 70,750,741 (5,950,518) 70,078,398 (5,376,917) See notes to consolidated financial statements. Ecolab 1997 Annual Report 39
- 13. NotesNotes to Consolidated Financial Statements 1. Nature of Business depreciated as a group and written off when fully depreciated. Depreciation and amortization are charged to operations using The company is the leading global developer and marketer of the straight-line method over the assets’ estimated useful lives. premium cleaning, sanitizing and maintenance products and services for the hospitality, institutional and industrial markets. Intangible Assets Customers include hotels and restaurants; foodservice, health- Intangible assets arise principally from business acquisitions care and educational facilities; quickservice (fast-food) units; and are stated at cost. The assets are amortized on a straight- commercial laundries; light industry; dairy plants and farms; line basis over their estimated economic lives, generally not and food and beverage processors around the world. exceeding 30 years. Long-Lived Assets 2. Summary of Significant Accounting Policies The company periodically assesses the recoverability of long- Principles of Consolidation lived and intangible assets based on anticipated future earnings The consolidated financial statements include the accounts of and operating cash flows. the company and all majority-owned subsidiaries. The company Net Income Per Common Share accounts for its investment in the Henkel-Ecolab joint venture under the equity method of accounting. International subsidiaries In the fourth quarter of 1997, the company adopted Statement and the Henkel-Ecolab joint venture are included in the financial of Financial Accounting Standards No. 128, a new standard of statements on the basis of their November 30 fiscal year ends. computing and presenting both basic and diluted net income per common share amounts. All prior periods have been changed F o r e i g n C u r r e n c y Tr a n s l a t i o n to conform with the new presentation. However, basic and Financial position and results of operations of the company’s diluted net income per share amounts are generally consistent international subsidiaries and the Henkel-Ecolab joint venture with net income per share amounts previously reported. generally are measured using local currencies as the functional The computation of the basic and diluted per share amounts currency. Assets and liabilities of these operations are translated were as follows: at the exchange rates in effect at each fiscal year end. Income (thousands, except per share) 1997 1996 1995 statement accounts are translated at the average rates of exchange prevailing during the year. Translation adjustments Net income $133,955 $113,185 $ 99,189 arising from the use of differing exchange rates from period to Weighted average common period are included in the cumulative translation account in shares outstanding shareholders’ equity. Translation adjustments for operations in Basic (actual shares highly inflationary economies are included in net income and outstanding) 129,446 128,991 132,193 Effect of dilutive were not significant. stock options 4,376 3,826 2,763 Cash and Cash Equivalents Diluted 133,822 132,817 134,956 Cash equivalents include highly liquid investments with a Net income per common share maturity of three months or less when purchased. Basic $ 1.03 $ 0.88 $ 0.75 Diluted $ 1.00 $ 0.85 $ 0.73 I n v e n t o r y Va l u a t i o n s Inventories are valued at the lower of cost or market. Domestic Virtually all stock options outstanding for each of these chemical inventory costs are determined on a last-in, first-out periods were dilutive and included in the calculation of the (lifo) basis. Lifo inventories represented 40 percent, 44 percent diluted per share amounts. and 38 percent of consolidated inventories at year-end 1997, 1996 and 1995, respectively. All other inventory costs are Use of Estimates determined on a first-in, first-out (fifo) basis. The preparation of the company’s financial statements requires management to make certain estimates and assumptions that P r o p e r t y, P l a n t a n d E q u i p m e n t affect the reported amounts of assets and liabilities as of the Property, plant and equipment are stated at cost. Merchandising date of the financial statements and the reported amounts of equipment consists principally of various systems that dispense revenues and expenses during the reporting periods. Actual cleaning and sanitizing products and low-temperature dish- results could differ from these estimates. washing machines. The dispensing systems are accounted for on a mass asset basis, whereby equipment is capitalized and 40 Ecolab 1997 Annual Report
- 14. Notes to Consolidated Financial Statements 3. Balance Sheet Information Note 5. The terms of the amended and restated agreement are otherwise generally similar to the agreement which it replaced. December 31 (thousands) 1997 1996 1995 The company may borrow varying amounts from time to time on Accounts Receivable, Net a revolving credit basis, with loans denominated in G-7 curren- Accounts receivable $ 256,919 $ 214,369 $ 206,763 cies, or certain other currencies, if available. The company has Allowance for doubtful accounts (10,878) (9,343) (8,331) the option of borrowing based on various short-term interest Total $ 246,041 $ 205,026 $ 198,432 rates. The agreement includes a covenant regarding the ratio Inventories of total debt to capitalization. Amounts outstanding under the Finished goods $ 67,823 $ 52,232 $ 47,035 agreement at year-end 1997 were denominated in Australian Raw materials and parts 89,716 73,060 62,132 dollars and had an average annual interest rate of 5.2 percent. Excess of fifo cost over lifo cost (2,708) (3,044) (3,050) In October 1996, the company filed a shelf registration with Total $ 154,831 $ 122,248 $ 106,117 the Securities and Exchange Commission for the issuance of Property, Plant and Equipment, Net up to $200 million of debt securities. The filing is intended to Land $ 18,184 $ 7,969 $ 6,941 enhance the company’s future financial flexibility in funding Buildings and leaseholds 145,021 129,781 117,042 general business needs. The company has no immediate plans Machinery and equipment 232,940 208,704 188,453 Merchandising equipment 379,531 330,277 292,962 to issue debt under the registration. Construction in progress 19,862 11,745 14,571 As of December 31, the weighted-average interest rate on 795,538 688,476 619,969 notes payable was 5.4 percent for 1997, 5.1 percent for 1996 Accumulated depreciation and 6.3 percent for 1995. and amortization (399,976) (356,162) (327,032) As of December 31, 1997, the aggregate annual maturities of Total $ 395,562 $ 332,314 $ 292,937 long-term debt for the next five years were: 1998 – $15,444,000; Other Assets 1999 – $15,184,000; 2000 – $15,155,000; 2001 – $14,988,000 Intangible assets, net $ 217,120 $ 96,865 $ 50,773 and 2002 – $126,770,000. Investments in securities 5,000 5,000 5,000 Interest expense was $18,043,000 in 1997, $19,084,000 Deferred income taxes 23,444 26,582 27,383 Other 25,793 26,904 24,417 in 1996 and $15,857,000 in 1995. Total interest paid was Total $ 271,357 $ 155,351 $ 107,573 $18,168,000 in 1997, $16,897,000 in 1996 and $16,170,000 in 1995. Short-Term Debt Other noncurrent liabilities included income taxes payable of Notes payable $ 33,440 $ 12,333 $ 54,950 Long-term debt, $82 million at December 31, 1997, $100 million at December 31, current maturities 15,444 15,276 16,697 1996 and $96 million at December 31, 1995. Income taxes Total $ 48,884 $ 27,609 $ 71,647 payable reflected a reduction in U.S. federal income tax Long-Term Debt payments during 1995 and prior years, as a result of tax losses 7.19% senior notes, due 2006 $ 75,000 $ 75,000 $ on the disposition of a discontinued business in 1992. 9.68% senior notes, due 1995-2001 57,143 71,429 85,714 4. Financial Instruments Multicurrency Credit Agreement, due 2002 116,450 Foreign Cur rency Instruments Other 26,235 17,530 20,385 The company uses hedging and derivative financial instruments 274,828 163,959 106,099 to limit financial risk related to foreign currency exchange rates, Long-term debt, interest rates and other market risks. The company does not hold current maturities (15,444) (15,276) (16,697) hedging or derivative financial instruments of a speculative nature. Total $ 259,384 $ 148,683 $ 89,402 The company enters into foreign currency forward and The 9.68 percent senior notes include covenants regarding option contracts to hedge specific foreign currency exposures, consolidated shareholders’ equity and amounts of certain long- principally related to intercompany debt and joint venture royalty term debt. transactions. These contracts generally expire within one year. In late 1997, the company amended and restated its $225 Gains and losses on these contracts are deferred and recog- million Multicurrency Credit Agreement, increasing the credit nized as part of the specific transactions hedged. The cash available to $275 million, extending the term one year to flows from these contracts are classified in the same category September 2002, and specifically providing for anticipated as the transaction hedged in the Consolidated Statement of borrowings of Australian dollars to acquire the outstanding Cash Flows. shares of Gibson Chemical Industries Limited, as described in 41 Ecolab 1997 Annual Report