SlideShare una empresa de Scribd logo
1 de 77
Descargar para leer sin conexión
$700
                                                   $625*
                                        21%
                                                                                                                19.9%*                                          20%
                                                                                                    $600
 18.1%
                                        18%                 $511
                                                                                                    $500
                                                                               $442                                                                             15%
                                        15%                                                                               13.7%
                                                                                                    $400
                                                                                           $313
         11.4%                                                                                                                               9.3%
                                        12%                                                                                                                     10%
                                                                                                    $300
                                                                      $241
                                                                                                                                                         5.9%
                                 8.5%   9%
                          8.1%                                                                                                      5.7%
                 7.6%                                                                               $200                                                        5%
                                        6%
                                                                                                    $100
                                                                                                                                             2003        2004
 2000    2001      2002   2003   2004                                                                            2000      2001     2002
                                                                                           2004
                                                   2000     2001      2002     2003

                                                  Net Income (in millions)
Operating Margin                                                                                               Return On Stockholders’ Equity
                                                * Excludes cumulative effect of change                        * Excludes cumulative effect of change
                                                  in accounting principle of $22 million                        in accounting principle of $22 million


     CONSOLIDATED HIGHLIGHTS
                                                                                      2004                   2003                              CHANGE
    (DOLLARS IN MILLIONS, EXCEPT PER SHARE AMOUNTS)

    Operating revenues                                                                     $6,530              $5,937                            10.0%

    Operating expenses                                                                     $5,976              $5,454                               9.6%

    Operating income                                                                                                                              14.7%
                                                                                             $554                 $483

    Operating margin                                                                           8.5%                  8 . 1%                         0.4pts.

    Net income                                                                                                                                   (29.2)%
                                                                                             $313                  $442

    Net margin                                                                                    4.8%                7.4%                          (2.6)pts.

    Net income per share – basic                                                              $.40                   $.56                        (28.6)%

    Net income per share – diluted                                                                                                               (29.6)%
                                                                                              $.38                  $.54
    Stockholders’ equity                                                               $5,524                                                       9.3%
                                                                                                               $5,052

    Return on average stockholders’ equity                                                        5.9%               9.3%                         (3.4)pts.

    Stockholders’ equity per common share outstanding                                                                                               9.2%
                                                                                             $6.99                 $6.40

    Revenue passengers carried                                                                                                                      8.0%
                                                                               70,902,773                  65,673,945

    Revenue passenger miles {RPMs} (000s)                                       53,418,353                 47,943,066                             11.4%

    Available seat miles {ASMs} (000s)                                                                     71,790,425
                                                                               76,861,296                                                           7.1%
    Passenger load factor                                                                                                                           2.7pts.
                                                                                              69.5%                66.8%
    Passenger revenue yield per RPM                                                         11.76¢               11.97¢                             (1.8)%
    Operating revenue yield per ASM                                                           8.5 0 ¢               8.2 7 ¢                         2.8%

    Operating expenses per ASM                                                                7.77¢                 7.60¢                           2.2%

    Size of fleet at yearend                                                                                        388                             7.5%
                                                                                               417

    Number of Employees at yearend                                                         3 1, 0 11           32,847                               (5.6)%


Southwest Airlines Co. is the nation’s low-fare, high Customer Satisfaction airline. We primarily serve shorthaul and

mediumhaul city pairs, providing single -class air transportation which targets business and leisure travelers. The

Company, incorporated in Texas, commenced Customer Service on June 18, 1971, with three Boeing 737 aircraft serving

three Texas cities—-Dallas, Houston, and San Antonio. At yearend 2004, Southwest operated 417 Boeing 737 aircraft

and provided service to 60 airports in 31 states throughout the United States. Southwest has one of the lowest

operating cost structures in the domestic airline industry and consistently offers the lowest and simplest fares.

Southwest also has one of the best overall Customer Service records. LUV is our stock exchange symbol, selected to

represent our home at Dallas Love Field, as well as the theme of our Employee, Shareholder, and Customer relationships.
1
                                                    Southwest Airlines Co. 2004 Annual Report


     DING! Sound familiar? It is the signal
     that Americans are now free to move
about the country. It is also perhaps the most
   memorable sound and word in the airline
industry. When Southwest Airlines first began
flying back in 1971, our goal was to democratize
 the skies. While other airlines were charging
  a fistful of dollars to fly from Dallas, Texas,
 to Houston and San Antonio, Southwest’s low
   fare was a mere $15——less than bus fare!


  Today, we continue to offer our Customers
   legendary low fares, lots of daily flights,
       and our genuine Southwest Spirit
   from coast to coast. After 33-plus years,
   our mission still has a familiar ring to it.
2   Southwest Airlines Co. 2004 Annual Report


    To Our Shareholders:                                                 jet fuel (there is no futures market for refined jet fuel) are
                                                                         unusually high, we currently anticipate, if these market
        In 2004, Southwest Airlines recorded its 32nd consecutive        conditions persist, that our first quarter 2005 jet fuel prices
    year of profitability, which, we believe, is a record unmatched      will exceed our average fourth quarter 2004 jet fuel cost of
    in the history of the commercial airline industry.                   89.1 cents per gallon.

        Our 2004 profit of $313 million (or $.38 per diluted share)          In December 2004, we were successful in completing a
    exceeded our 2003 profit (excluding a special federal government
                                                                         significant transaction with ATA Airlines in its Chapter 11
    allowance to the airline industry) of $298 million (or $.36 per
                                                                         bankruptcy proceeding. We acquired the rights to six additional
    diluted share) by 5.0 percent.
                                                                         gates at Chicago’s Midway Airport, which will soon be fully
                                                                         utilized by added Southwest flights, and a much needed six-bay
        In fourth quarter 2004, we experienced the unit revenue
                                                                         Midway Airport maintenance hangar. In addition, we agreed
    decline (revenue per available seat mile) that we warned
                                                                         to begin codesharing flights with ATA Airlines on February 4,
    about in our third quarter 2004 earnings press release. This
                                                                         2005, initially exchanging single-ticketed passengers only at
    decline was accompanied by an increase of 20.1 percent, net
                                                                         the convenient Midway Airport connecting point between our
    of fuel hedging gains, in our jet fuel price per gallon. Primarily
                                                                         two airlines, with a limited number of other connecting points
    as a consequence of these two items, our fourth quarter 2004
                                                                         to be subsequently added as our respective ground facilities
    earnings of $56 million (or $.07 per diluted share) were
                                                                         permit. We are, at this writing, already booking codeshare
    $10 million, or 15.2 percent, less than our fourth quarter 2003
                                                                         passengers on our respective codesharing flights, and, as
    earnings of $66 million (or $.08 per diluted share).
                                                                         mentioned above, we expect this new relationship to augment
       That this diminution in fourth quarter earnings was principally   our first quarter 2005 revenue stream during most of
    attributable to intense downward revenue pressures and to            February and all of March.
    significantly enhanced jet fuel prices is evidenced by the fact
    that our costs per available seat mile, excluding fuel, declined        In May 2004, we entered the Philadelphia market, and
    by 4.5 percent, primarily as the result of enhanced productivity.    by March 2005, we will be providing nonstop service to
                                                                         18 cities from Philadelphia, where our reception has been both
        Since depressed available seat mile yields and higher jet
                                                                         heartwarming and enormously enthusiastic.
    fuel prices were the primary causes of our year over year
    decline in fourth quarter 2004 earnings, what is the present
                                                                            In May of this year, we will begin service to Pittsburgh,
    status of these two earnings variables at the commencement
                                                                         which we view as a very promising opportunity since
    of first quarter 2005?
                                                                         US Airways has so drastically reduced its service to the
                                                                         Pittsburgh area, in effect disassembling its Pittsburgh hub.
        First, with respect to unit yields, our industry continues to
                                                                         Our routes and fares out of Pittsburgh will not be
    expand available domestic seat miles and, as a consequence,
                                                                         announced until later in the first quarter, but again, the
    charge ever lower fares in order to fill excess seats. This
                                                                         disclosure of our service plan engendered an enthusiastic
    “oversupply” of industry “product,” at present depressed levels
                                                                         reception and welcome.
    of uninduced passenger demand, is aided and abetted by
    Chapter 11 airline bankruptcy access as well as extraordinary
    government and vendor “subsidies” for failing airlines, which            Our financial strength, cost consciousness, and dedicated
    together contravene the free enterprise “law” of supply and          People support our reception of a net 29 new Boeing 737-700s
    demand. As a matter of economic doctrine, not allowing high-cost     in 2005 and our available seat mile expansion of approximately
    carriers to cease operations enables the continuing sale of          ten percent during the year.
    ever more seat miles at less than the cost of producing them.
                                                                            We are confident that our People’s awareness of the
        Based on recent events, we presently expect this condition       debilitated condition of the domestic airline industry as a
    of “oversupply” to persist in first quarter 2005, alleviated, to
                                                                         whole and their valorous, wise, energetic, and stouthearted
    some extent, by the fact that the Easter Holiday falls in March
                                                                         response will enable us to continue as an industry leading
    of 2005, as compared to April in 2004, and by the cost-efficient,
                                                                         carrier providing unprecedented job security, profitsharing,
    somewhat enhanced revenue stream we expect from our
                                                                         and wellbeing to all of our Employees. Southwest was recently
    recent codesharing agreement with ATA Airlines.
                                                                         named “Best Low-Cost Carrier” by Business Traveler magazine,
                                                                         which is a tribute to our People’s warm, caring Customer
       Second, with respect to our jet fuel costs, we are presently
                                                                         Service (to each other and to our passengers) and to the high
    protected better than any major domestic carrier. For the
                                                                         quality, low-fare service ideal that we embody and continue to
    entirety of 2005, we are 85 percent hedged with prices
                                                                         pursue with rigorous vigor.
    capped at the equivalent of $26 per barrel of crude oil.
    Nonetheless, because prices are presently so high on the
                                                                            To all the People of Southwest Airlines, we say a united
    15 percent unhedged portion of our anticipated requirements
    and because oil refinery spreads for converting crude oil to         “thank you.”


                                                                         January 19, 2005
                                                                         Most sincerely,
3
        Southwest Airlines Co. 2004 Annual Report


Herbert D. Kelleher
Chairman of the Board


Gary C. Kelly
Chief Executive Officer


Colleen C. Barrett
President
4   Southwest Airlines Co. 2004 Annual Report


                                   For the fourth straight year, the                   Low Costs
                                   airline industry, as a whole, reported
                                   massive losses. The two major                           Although the cost gap between Southwest and the rest
                                   problems the industry faced in                      of the industry has narrowed due to LCC growth and cost
                                   2004 were record-high energy                        reduction efforts by the legacy carriers through restructuring,
                                   prices and a glut of domestic                       bankruptcy, furloughs, and labor concessions, we continued to
                                   airline seats. Despite these                        be one of the lowest cost producers in the industry for 2004.
    staggering industry losses, high-cost carriers continued to                        Despite high energy prices, increased airport costs, and labor
    add capacity in an attempt to thwart the growth of low-cost                        rate pressures, Southwest Airlines has protected its low-cost
    carriers (LCCs), selling seats well below their costs to produce                   competitive advantage through our People’s perseverance and
    them. As a result of this oversupply of seats, revenue yields                      strenuous efforts to reduce costs. Southwest Airlines experienced
    remain under tremendous pressure. Southwest does not                               unfavorable cost trends during the first half of 2004, and
    anticipate a complete recovery in the industry’s or our revenues                   our Employees took aggressive and innovative measures to
    until there is a rationalization of industry capacity or a recovery                improve our productivity and mitigate the cost pressures.
    in business full-fare travel.                                                      Their superb efforts were successful in the second half of
                                                                                       2004, reversing the trends for an
        Despite the extremely challenging environment we’ve                            improved cost performance.
    faced over the past four years, Southwest reported its 32nd
    consecutive annual profit in 2004. This was not an easy task                           Southwest’s low costs were instituted
    and was only achieved through the preparation, discipline,                         by our strategic decisions made early on
    dedication, and foresight of our resilient Employees. Our                          in our history——to fly a single aircraft
    wonderful Employees have always prepared for the tough                             type; operate an efficient point-to-point
    times during the good times and have always been willing to                        route system; and utilize our assets in a
    adapt quickly to the economic and competitive challenges                           highly efficient manner. However, our low
    affecting our Company. Over the last several years, the                            costs are preserved through the hard
    economic realities in our industry have drastically changed,                       work, creativity, and high spirits of our People. As a result of
    and our Employees have reacted with the same fighting                              our Employees’ amazing efforts, Southwest reduced its fourth
    SOUTHWEST SPIRIT that got us off the ground over 33 years                          quarter 2004 year over year unit costs (operating expenses
    ago. As a result, we remained one of the lowest cost producers                     per ASM), excluding fuel, by 4.5 percent, without sacrificing
    in the U.S. airline industry for 2004.                                             the safety and quality of our outstanding Customer Service.

        Our Employees understand that our Customers demand                                 Among other cost reduction measures, we made the difficult
    low fares now more than ever and did what was needed to                            decision to close three of our Reservations Centers (Dallas,
    lower our cost structure in 2004. We have a proven business                        Salt Lake City, and Little Rock) in February 2004. The
    strategy and the most respected and well-known airline                             decision to consolidate our Reservations Centers from nine to
    brand in the country. We have a top-rated frequent flyer                           six was made in response to the established shift by Customers
    program, Rapid Rewards, and are widely recognized for our                          to our web site, southwest.com, as a preferred way of booking
    Employees’ remarkable Customer Service.                                            travel. Almost 60 percent of our passenger revenues were
    Despite the economic hardships our industry                                        generated through southwest.com during 2004. We also
    has faced, our financial condition is stronger                                     provided a Companywide early-out offer to our Employees in
    than ever. In this weak industry environment,                                      June 2004 and introduced our “Going Where We’re Growing”
    we have excellent opportunities to grow and are                                    program to ensure we are efficiently utilizing our extraordinary
    well-poised to return to historical profitability                                  People throughout our operations. As a result of all these efforts
    levels once a meaningful reduction in unprofitable                                 and more, we have successfully reduced our 2004 headcount
    industry capacity or rebound in full-fare                                          per aircraft to 74 from 85 in 2003 without any furloughs, while
    business travel occurs.                                                            growing our ASMs over seven percent.


                                                                                                                                    2000     2001     2002     2003     2004
                                      7.77¢   7.8¢                                             6.5¢
      7.73¢                                                                            6.47¢
                                                                               6.44¢
                                                                                                                                    $5,468   $5,379   $5,341   $5,741   $6,280
                                                                                                              Passenger Revenues
                              7.60¢                    6.38¢
                                              7.6¢                                             6.4¢
              7.54¢                                            6.36¢
                                                                                                              Internet                        39%     49%       54%      59%
                                                                                                                                     31%
                      7.41¢
                                              7.4¢                                             6.3¢
                                                                       6.30¢
                                                                                                              Travel Agency                                     16%      13%
                                                                                                                                     28%      25%      20%
                                              7.2¢                                             6.2¢
                                                                                                              Reservations Center    28%               20%      19%      18%
                                                                                                                                              24%
                                              7.0¢                                             6.1¢
                                                                                                              Other                  13%               11%      11%      10%
                                                                                                                                              12%

       2000   2001    2002    2003    2004             2000    2001    2002    2003    2004

                                                     Operating Expenses Per ASM, Excluding Fuel              Passenger Revenues and Distribution Method (in millions)
     Operating Expenses Per Available Seat Mile
5
Southwest Airlines Co. 2004 Annual Report
6   Southwest Airlines Co. 2004 Annual Report


                                        We continue to automate our airport     Employees and increasing longterm value for our loyal
                                       operations. All of our airports are      Employee and non-Employee Shareholders.
                                      now equipped with RAPID CHECK-IN
                                   self-service kiosks. Customers can               In addition to our low fares and convenient flight schedule,
                                now print their boarding and transfer           our frequent flyers are generously rewarded with free trips
                              passes when they check in either through          through our Rapid Rewards program. Rapid Rewards allows
                             the self-service kiosks or through                 Customers to receive a roundtrip Award valid for travel
                            southwest.com. While we have made great             anywhere Southwest flies by simply flying eight roundtrips or
                           strides in improving our productivity, controlling   earning 16 credits (a one-way ticket equals one credit) within
                          and reducing our costs is an ongoing effort           12 consecutive months. With no seat restrictions and limited
                         that we will continue to pursue vigorously.            blackout dates, Members can use their Award to fly virtually
                                                                                anytime to anywhere you can fly on Southwest. Rapid Rewards
        One of our greatest cost pressures is jet fuel, which is our            Awards are also fully transferable. Inside Flyer magazine
    second highest cost category after labor. Although market jet               recognized the generosity and simplicity of our Rapid Rewards
    fuel prices were at record high levels during 2004, Southwest               program in 2004 with awards for Best Customer Service, Best
    had the wisdom and foresight to hedge approximately 80 to                   Award Redemption, Best Web Site, and Best Bonus Promotion
    85 percent of our fuel needs, which reduced our 2004 fuel                   among all frequent flyer programs. Rapid Rewards Members
    and oil expense by $455 million. We are well-protected in                   can receive Rapid Rewards credits when doing business with
                                                                                                                ®                   ®         ®
    2005 with 85 percent of our anticipated fuel needs hedged at                our Preferred Partners (Alamo, American Express, Budget,
                                                                                            ®      ®      ®          ®       ®            ®     ®
    $26 per barrel of crude oil. We are also opportunistically                  Diners Club, Dollar, Hertz, Earthlink, Nextel, and Hilton, Hyatt,
                                                                                Marriott, La Quinta, and Choice® brand hotels) as well as through
                                                                                         ®          ®
    building hedging positions for future years and are currently
    hedged 65 percent at $32 per barrel in 2006; over 45 percent                the use of the Southwest Airlines Rapid Rewards Visa credit card
                                                                                                                  ®
    at $31 per barrel in 2007; 30 percent at $33 per barrel in                  issued by JPMorgan Chase Bank.
    2008; and over 25 percent at $35 per barrel in 2009.
                                                                                Proven Business Strategy
       In addition to our protective fuel hedging position, we have
    implemented fuel conservation programs to offset high energy                    Southwest has a proven and
    costs. All of our Boeing 737-700 aircraft will have Blended                 flexible business strategy. Even
    Winglets installed by March 2005, which are estimated to                    though we offer low fares, our
    produce around three percent annual savings on fuel consumption             strategy allows us to prosper in good
    per aircraft. Our Pilots, Dispatchers, Ground Operations, and               times and maintain profitability in bad times. Of course, the key
    Fuel Management Employees also coordinate their efforts on                  to our success is low costs, and our unique operating strategy
    a daily basis to minimize fuel consumption as much as possible              and Culture are the main ingredients to our low-cost formula.
    and purchase fuel at the lowest costs.
                                                                                    Southwest has been able to continually achieve the highest
    Low Fares and Rapid Rewards                                                 productivity of any major U.S. airline and, therefore, the
                                                                                lowest unit costs (adjusted for stage length) in the U.S. airline
        While the recent industry fare changes to lower and                     industry. Although many factors contribute to our historic
    simplified fares may be a new phenomenon for many airlines,                 cost advantage, one of the primary drivers is our high asset
    our Customers have always been able to rely on Southwest                    utilization resulting from our dedication to the low-fare,
    Airlines for simple, low fares. From our inception, our                     point-to-point market niche. This market focus allows us to
    mission has been to give Americans the Freedom to Fly.                      operate a single aircraft type, the Boeing 737, which significantly
    We have policed the skies for over 33 years with our                        simplifies scheduling, operations, and maintenance, and
    low-fare service and have made air travel                                   therefore minimizes costs.
    affordable for Americans. Unlike many of our
    competitors, we never charge a rebooking or                                     We schedule our aircraft on a point-to-point, not hub-and-
    exchange fee, nor have we ever required a                                   spoke, basis and concentrate on the local, not through or
    Saturday-night stay. After 33-plus years, our                               connecting, traffic. As a result, approximately 80 percent of
    low fares remain simple and reliable.                                       our Customers fly nonstop. Our point-to-point system, as
                                                                                compared to hub-and-spoke, provides for more direct nonstop
       While there may be Southwest wannabes in                                 routings for our Customers and, therefore, minimizes stops,
    what appears to be a permanent low-fare                                     connections, delays, and total trip time. Although our frequent
    environment, the survivors will be the airlines                             flights and our recent codeshare agreement with ATA Airlines
    with the lowest costs, the highest quality service, and the best            at Chicago Midway allow for the convenient connection and
    Employees. Southwest Airlines has built its 32 years of profitable          transfer of Customers, we schedule our aircraft based on local
    operations on a low-fare, high quality, low-cost philosophy. We             traffic needs.
    have the best Employees in America, who are devoted to our
    mission and Company. As a result, we remain well-positioned                     We serve many conveniently located secondary or downtown
    with our proven business strategy to meet the challenges of                 airports such as Baltimore/Washington, Chicago Midway,
    the airline industry with the ultimate objective of continued               Dallas Love Field, Fort Lauderdale/Hollywood, Houston Hobby,
    prosperity, profitability, and job security for our deserving               Long Island/Islip, Manchester, Oakland, and Providence.
7
Southwest Airlines Co. 2004 Annual Report
8   Southwest Airlines Co. 2004 Annual Report


                                  Although we have successful operations at                      As revealed in A&E’s heartwarming real-life series AIRLINE,
                                  larger hub airports such as Los Angeles (LAX),              Southwest Employees pride themselves on delivering
                                  Philadelphia, and Phoenix, we prefer to                     Positively Outrageous Customer Service, which is why we
                                  avoid congested hub airports if there are                   consistently receive high marks in Customer Satisfaction, based
                                  better alternatives. We especially prefer                   on Customer complaints reported in the U.S. Department of
                                  to avoid airports with high costs in areas                  Transportation’s (D.O.T.) Air Travel Consumer Report. In addition,
                                  such as landing fees and terminal rents.                    Southwest was recently named “Best Low Cost Carrier” by
                                                                                              Business Traveler magazine and was once again recognized
                             We are selective and prudent about                               by FORTUNE as one of America’s Most Admired Companies
                          the airports we choose to serve. We prefer                          and America’s most admired airline.
    to fly from airports that support a high number of frequencies
    and our low operating costs. In fact, eight of our airports have                             Our Employees consistently provide outstanding Customer
    over 100 departures per day. Our Schedule Planning Department                             Service because they genuinely care about our Company and
    continually evaluates the cost, efficiency, and convenience of                            our Customers. They also care about the communities we
    our airports and those we would like to one day serve. As part                            serve and embrace the causes they are passionate about with
    of this review and the ongoing industry challenges, Southwest                             their time and support. At Southwest, we have an amazing
    recently made the difficult decision to cease flight operations                           Culture and are proud that it is often used as a
    at Houston George Bush Intercontinental Airport where we                                  measuring stick for corporations across America.
    operate six daily flights on April 2, 2005. The people of
    Houston, however, can still take advantage of our extensive                                   As a result of our strong brand, frequent
    flight schedule (139 daily departures) at Houston Hobby                                   flights, and low fares, Southwest dominates
    Airport. While this will be only the fifth airport we have exited                         the majority of the markets we serve.
    in our history, the focus on airport service allows us to                                 Based on data for October 2004 (the latest
    sustain high productivity, provide reliable ontime service, and                           available data), Southwest is the largest
    maintain low airport unit costs.                                                          carrier in the United States based on
                                                                                              originating domestic passengers boarded and
        We also schedule our aircraft to minimize the amount of                               scheduled domestic departures. We consistently rank first in
    time at the gate, which is why we consistently achieve the                                market share in approximately 90 percent of our top 100 city
    highest aircraft utilization and Employee productivity of any                             pairs, and in the aggregate, hold over 65 percent of the total
    major U.S. airline. Because our aircraft are generally at the                             market share in those markets. Southwest also carries the
    gate less than 25 minutes, we require fewer aircraft and gate                             most passengers in the top 100 U.S. markets despite serving only
    facilities than otherwise would be needed.                                                40 of them. As of third quarter 2004, we have a market share of
                                                                                              46 percent in Chicago Midway; 44 percent in Baltimore/Washington;
    Strong Brand and Reliable Customer Service                                                37 percent in Phoenix; and 34 percent in Las Vegas. We also
                                                                                              have a 73 percent market share in intra-Texas; 68 percent in
       Southwest’s low fares, convenience, friendly Customer                                  intra-California; and 53 percent in intra-Florida traffic.
    Service, robust route system, and longstanding profitability
    record have made Southwest Airlines one of the most                                       Strong Financials
    respected brands in America. Our Customers know that they can
    depend on Southwest for a low fare and on our Employees to                                   The airline industry is highly competitive. It is cyclical,
    get them to their destination on                                                          energy-intensive, labor-intensive, and capital-intensive. As a result,
    time with their bags. They also                                                           maintaining a strong financial position is imperative to our
    know that they will be treated with                                                       longterm prosperity. Our business has largely fixed operating
    kindness and care by our 31,000-                                                          costs, and our operations are susceptible to weather conditions,
    plus Employees from the moment                                                            natural disasters, and federal oversight. Without financial
    they book a reservation until their                                                       stability and preparation, it is difficult for an airline to survive
    bags arrive at their destination.                                                         such unpredictable circumstances.


                                                                                                                                                                                   1.25
                                                                                                                                                                            1.21
                                                                                          $6,530 $7,000
                                                                                 $5,937
                                      11:20                                                                                                                          1.02
                                                                                                 $6,000
                                                          $5,650 $5,555 $5,522
                                              11:20
      11:18                                                                                                                                                                        1.0
                                                                                                                                                         .89   .89
                                                                                                                                               .88
                                                                                                                                        .82
                                                                                                                                 .79
                                                                                                 $5,000
                                              11:15
                                                                                                                                                                                   .75
                      11:12
              11:10                                                                              $4,000
                                              11:10
                              11:09                                                                                       .58
                                                                                                                                                                                   .50
                                                                                                 $3,000
                                              11:05
                                                                                                                                                                                   .25
                                                                                                                   .18
                                                                                                 $2,000
                                              11:00

                                                                                                                   LUV   ALK    DAL     CAL   AMR NWAC UAL                  UAIR
                                                                                                                                                                     AWA
      2000    2001    2002    2003    2004                 2000   2001   2002    2003     2004

                                                                       (in millions)
    Aircraft Utilizationminutes per day)
                 (hours and                                                                                                  (Complaints per 100,000 Customers boarded)
                                                         Operating Revenues                                      Customer Service
                                                                                                                 For the year ending December 31, 2004
9
Southwest Airlines Co. 2004 Annual Report
10   Southwest Airlines Co. 2004 Annual Report


                                As a result of prudent planning and                           Southwest acquired the leasehold rights to these six gates and
                            discipline throughout our 33-plus year                            a six-bay maintenance hangar in Chicago for a purchase price
                           history, we have the strongest balance sheet                       of $40 million. Our bid also included a commitment to codeshare
                        in the airline industry and are the only U.S. airline                 with ATA at Chicago Midway and other points on our system,
                      with an investment-grade credit rating. We                              subject to facility availability and Customer convenience; a
                             have ample liquidity and access to capital.                      $40 million debtor-in-possession loan to ATA for bankruptcy
                              We ended 2004 with $1.3 billion in cash                         restructuring purposes; and a commitment to convert the
                         and a fully available bank revolving credit                          debtor-in-possession financing to a term loan, and purchase
     facility of $575 million. We also had $682 million in cash                               $30 million of non-voting convertible preferred stock upon
     deposits at Boeing for future aircraft deliveries. Our unmortgaged                       ATA’s emergence from bankruptcy.
     assets have a value of over $5 billion, and our debt to total
     capital is under 40 percent, including aircraft leases as debt.                              Through the ATA codeshare agreement, Southwest Airlines
                                                                                              Customers will be able to initially connect in Chicago Midway
         Due to our strong financial position, we have been able to                           for travel between select Southwest cities and the following
     react quickly to growth opportunities even in the worst of                               ATA destinations: Boston Logan Airport, Denver International
     times. Although we prefer to grow at a managed growth rate                               Airport, Southwest Florida International Airport (serving
     of roughly eight percent per annum, we have the financial                                Ft. Myers/Naples), Honolulu International Airport,
     wherewithal and flexibility to take advantage of growth                                  Minneapolis/St. Paul International Airport, New York’s
     opportunities as they arise.                                                             LaGuardia Airport, Newark Liberty
                                                                                              International Airport, San Francisco
     Growth Opportunities                                                                     International Airport, Sarasota-
                                                                                              Bradenton Airport, St. Petersburg/
         Southwest is a growth airline, and we believe we have lots                           Clearwater International Airport,
     of opportunities to grow and invest in our future. Our financial                         and Ronald Reagan Washington
     strength provides us the freedom to pursue market opportunities                          National Airport. We estimate this
     as they arise, even in this weakened industry environment. We                            codeshare agreement should increase Southwest’s annual revenues
     began service to Philadelphia in May 2004 with a tremendous                              by $25 to $50 million.
     reception from our Philadelphia Customers. Increasing daily
     flights from an initial 14 to 41 over the course of a few months,                            At the end of 2004, Southwest operated an all-coach,
     Philadelphia was our most aggressive startup ever, and we                                Boeing 737 fleet of 417 aircraft. All of our future orders,
     plan to continue to grow this market, as facilities become                               options, and purchase rights with The Boeing Company for
     available, to meet our Customers’ demands. We are also eager to                          2005 through 2012 are for 737-700s. The average age of our
     begin service to Pittsburgh, our 60th city, which will open in                           young fleet is less than ten years. We are in the process of
     May 2005!                                                                                renewing the interior and exterior of our entire fleet, which
                                                                                              includes comfortable leather-covered seats, before the end
         Growing Chicago’s Midway Airport was also a priority in                              of 2005.
     2004 and will continue to be so in 2005. By summer 2005,
     we will be at 170 daily departures, making Chicago Midway our                               The Boeing 737-700 remains our future. In January 2005,
     third-largest airport in terms of daily                                                  we retired our last five 737-200 aircraft, bringing an end to
     departures. To support future growth,                                                    the tenure of these reliable aircraft in the Company’s fleet.
     we acquired the leasehold rights to six                                                  We plan to add 34 new -700s to our fleet in 2005, for a net
     additional gates through the competitive                                                 addition of 29 aircraft and a ten percent year-over-year
     bid process in the ATA Airlines, Inc.                                                    capacity growth. We are projecting an average annual growth
     bankruptcy proceedings, bringing our                                                     rate of roughly eight percent through 2012, based on current
     total gates in Chicago Midway to 25.                                                     orders and options placed with Boeing.


                                                                                                500
                                                9.5¢
        9.43¢                                                                           417                                                                     2009-
                                                                                                              Type               2005    2006   2007     2008           Total
                                                                                 388
                                                9.0¢                                                                                                            2012
                                                                           375                  400
                                                                  355
                8.51¢                   8.50¢            344                                                 Firm Orders           34     26     25       6      –       91
                                                8.5¢
                                8.27¢
                        8.02¢                                                                   300
                                                                                                              Options                     8          9   25      –       42
                                                8.0¢                                                                               –

                                                7.5¢                                                         Purchase Rights                             20     177     217
                                                                                                                                   –      –      20
                                                                                                200
                                                7.0¢                                                          Total                34            54      51     177     350
                                                                                                                                          34

                                                         2000     2001    2002   2003   2004
        2000    2001    2002    2003    2004

                                                                                                            Boeing 737-700 Firm Orders and Options
                                                       Fleet Size (at yearend)
      Operating Revenues Per Available Seat Mile
11
Southwest Airlines Co. 2004 Annual Report
12       Southwest Airlines Co. 2004 Annual Report


                                               Seattle/
                                               Tacoma
                                                  Spokane

                                Portland

                                                                                                                                                                                                                                       Manchester
                                                                                                                                                                                             Buffalo/                                      (Boston Area)
                                                                                                                                                                                          Niagara Falls
                                                                 Boise                                                                                                                                                                        Providence
                                                                                                                                                                                                           Albany                                  (Boston Area)
                                                                                                                                                                                                                               Hartford/Springfield
                                                                                                                                                                           Detroit
                                                                                                                                                                                                                            Long Island/Islip
                                                                                                                                                                                                 Pittsburgh
                                                                                                                                                          Chicago                                                      Philadelphia
                                                                                                                                                                                   Cleveland
                 Sacramento                 Reno/Tahoe                                                                                                     (Midway)
                                                                                                                         Omaha
                                                                     Salt Lake City
                                                                                                                                                                                                     Baltimore/ Washington (BWI)
             Oakland                                                                                                                                                             Columbus
     (San Francisco Area)                                                                                                                                                                                                          (D.C. Area)
                                                                                                                                            Kansas City           Indianapolis
                             San Jose
                                                                                                                                                                                                                        Norfolk
                            (San Francisco Area)
                                                                                                                                                                                                                             (Southern Virginia)
                                                                                                                                                                             Louisville
                                                                                                                                                  St. Louis
                                                     Las Vegas
                                                                                                                                                                                               Raleigh-Durham
                                                                                                                                                                             Nashville
                                                                                                                                    Tulsa
                                                                                      Albuquerque
                                           Burbank
                                                                                       (Santa Fe Area)                                         Little Rock
              Los Angeles (LAX)                 Ontario                                                     Amarillo
                                                   (Palm Springs Area)
                   Orange County                                                                                       Oklahoma City
                                                                         Phoenix
                                                                                                            Lubbock
                                 San Diego
                                                                                                                                                                      Birmingham
                                                                          Tucson
                                                                                                                                 Dallas                       Jackson
                                                                                                  El Paso   Midland/         (Love Field)
                                                                                                            Odessa                                                                                   Jacksonville
                                                                                                                     Austin
                                                                                                                San Antonio                                           New Orleans                         Orlando
                                                                                                                                            Houston
                                                                                                                                                                                    Tampa Bay
                                                                                                                       Corpus               (Hobby)
                                                                                                                       Christi                                                                                West Palm Beach
         Southwest System Map (at yearend)                                                                                                                                                                    Ft. Lauderdale
                                                                                                                                                                                                              (Miami Area)
                                                                                                                                 Harlingen/South Padre Island
     •   Service to Pittsburgh starts May 2005


                                                                                                                                                                      California
                                                                                                                                                                        18%                         East
                                                                                                                                                                                                    29%
                                                                                         Other Carriers
                                                                                             34%

                                                                                                                                                          Remaining West
                                                      Southwest
                                                                                                                                                              26%
                                                        66%
                                                                                                                                                                                                   Midwest
                                                                                                                                                                                                    16%


                                                                                                                                                                                 Heartland
                                                                                                                                                                                   11%


         Southwest’s Market Share (at yearend)
                                                                                                                                                      Southwest’s Capacity By Region (at yearend)
         (Southwest’s top 100 city-pair markets based on passengers carried)


                                                                                                                                                                                                                                       200
                                                                                                                                                                                                                195
                                                                                                                                                                                             190

                                                                                                                                                                                                                                       175
                                                                                                                                                                          165

                                                                                                                                                                                                                                       150
                                                                                                                                                        145
                                                                                                                                  139
                                                                                                                129
                                                                                                                                                                                                                                       125
                                                                                                  123
                                                                             117
                                                                                                                                                                                                                                       100
                                                        86
                                  85
                                                                                                                                                                                                                                       75

                                                                                                                                                                                                                                       50

                                                                                                                                 Houston                              Baltimore/
                                                                                                                                                      Chicago                                              Las Vegas
                            San Diego                                                                         Oakland
                                                   Nashville             Los Angeles Dallas Love                                                                                          Phoenix
                                                                                                                                  Hobby                               Washington
                                                                                                                                                      Midway


         Southwest’s Top Ten Airports — Daily Departures (at yearend)
13
                                                                                                                                   Southwest Airlines Co. 2004 Annual Report


QUARTERLY FINANCIAL DATA (UNAUDITED)


                                                                                                      THREE MONTHS ENDED
                                                              MARCH 31                               JUNE 30            SEPTEMBER 30                        DECEMBER 31
(In millions, except per share amounts)
2004
Operating revenues                                                $1,484                               $1,716               $1,674                                 $1,655
Operating income                                                       46                                   197                   191                                 120
Income before income taxes                                             41                                     179                 181                                     89
Net income                                                             26                                     113                 119                                     56
Net income per share, basic                                           .03                                     .14                 .15                                     .07
Net income per share, diluted                                         .03                                     .14                 .15                                     .07


2003
Operating revenues                                                $1,351                               $1,515               $1, 553                                $1,517
Operating income                                                       46                                     140                 185                                 111
Income before income taxes                                             39                                     397                 171                                 101
Net income                                                             24                                   246                   106                                     66
Net income per share, basic                                           .03                                     .32                 .14                                     .08
Net income per share, diluted                                         .03                                     .30                  .13                                    .08


COMMON STOCK PRICE RANGES AND DIVIDENDS


Southwest’s common stock is listed on the New York Stock Exchange and is traded under the symbol LUV. The high, low, and close sales prices of the
common stock on the Composite Tape and the quarterly dividends per share were:


PERIOD                                                 DIVIDENDS                               HIGH                      LOW                                 CLOSE
2004
1st Quarter                                              $.0045                                $16.60                    $12.88                               $14.21
2nd Quarter                                               .0045                                    17.06                  13.56                                   16.77
3rd Quarter                                               .0045                                    16.85                  13.18                                   13.62
4th Quarter                                               .0045                                    16.74                  13.45                                   16.28


2003
1st Quarter                                              $.0045                                $15.33                    $11.72                               $14.36
2nd Quarter                                               .0045                                    17.70                  14.09                                   17.20
3rd Quarter                                               .0045                                    18.99                  15.86                                   17.61
4th Quarter                                               .0045                                    19.69                  15.30                                   16.14


                                                                                                               60,000
                                              80,000
                                     76,861
                                                                                                     53,418
                                                                                                                                                                                75%
                            71,790
                   68,887                                                                   47,943             50,000             70.5%
                                              70,000                                                                                                               69.5%
                                                                            44,494 45,392
          65,295                                                                                                                                                                70%
                                                                                                                                          68.1%
                                                                  42,215                                                                                  66.8%
                                                                                                                                                  65.9%
 59,910                                                                                                                                                                         65%
                                              60,000                                                           40,000
                                                                                                                                                                                60%
                                              50,000                                                           30,000
                                                                                                                                                                                55%
                                              40,000                                                           20,000                                                           50%

  2000    2001      2002    2002     2004                          2000     2001    2002    2003     2004                                                 2003
                                                                                                                                  2000    2001    2002             2004

                                                                  Revenue Passenger Miles (in millions)
Available Seat Miles (in millions)                                                                                            Passenger Load Factor
14   Southwest Airlines Co. 2004 Annual Report


     TEN -YEAR SUMMARY

     SELECTED CONSOLIDATED FINANCIAL DATA
     (Dollars in millions, except per share amounts)                                             2003(4)                  2002(3)                  2001(3)
                                                                         2004
     Operating revenues:
       Passenger (2)                                             $        6,280            $        5,741            $        5,341          $        5,379
       Freight                                                              117                        94                           85                   91
               (2)
       Other                                                                133                      102                            96                   85
     Total operating revenues                                             6,530                     5,937                     5,522                  5,555
     Operating expenses                                                    5,976                    5,454                     5,105                  4,924
     Operating income                                                       554                      483                       417                      631
     Other expenses (income), net                                            65                     (225)                           24                 (197)
     Income before income taxes                                             489                      708                       393                      828
     Provision for income taxes                                             176                      266                       152                      317
       Net income (1)                                            $          313            $         442             $         241           $         511
     Net income per share, basic (1)                                        $.40                    $.56                       $.31                    $.67
                                         (1)
     Net income per share, diluted                                         $.38                      $.54                      $.30                    $.63
     Cash dividends per common share                                      $.0180                  $.0180                    $.0180                  $.0180
     Total assets                                                $        11,337           $        9,878            $        8,954          $       8,997
     Long-term debt less current maturities                      $         1,700           $        1,332            $        1,553          $       1,327
     Stockholders’ equity                                         $        5,524           $        5,052            $       4,422           $       4,014

     CONSOLIDATED FINANCIAL RATIOS
     Return on average total assets(1)                                       3.0%                     4.7%                      2.7%                    6.5%
                                                     (1)
     Return on average stockholders’ equity                                  5.9%                     9.3%                      5.7%                   13.7%
     Operating margin                                                        8.5%                     8.1%                      7.6%                   11.4%
     Net margin                                                              4.8%                     7.4%                      4.4%                    9.2%

     CONSOLIDATED OPERATING STATISTICS
     Revenue passengers carried                                       70,902,773               65,673,945                63,045,988           64,446,773
     Enplaned passengers                                              81,066,038               74,719,340                72,462,123           73,628,723
     RPMs (000s)                                                      53,418,353               47,943,066                45,391,903           44,493,916
     ASMs (000s)                                                      76,861,296               71,790,425                68,886,546           65,295,290
     Passenger load factor                                                  69.5%                   66.8%                      65.9%                   68.1%
     Average length of passenger haul (miles)                               753                      730                       720                     690
     Average stage length (miles)                                           576                      558                       537                      514
     Trips flown                                                        981,591                  949,882                   947,331                 940,426
     Average passenger fare (2)                                          $88.57                   $87.42                    $84.72                  $83.46
                                               (2)
     Passenger revenue yield per RPM                                       11.76¢                  11.97¢                     11.77¢                 12.09¢
     Operating revenue yield per ASM                                       8.50¢                     8.27¢                     8.02¢                   8.51¢
     Operating expenses per ASM                                             7.77¢                    7.60¢                     7.41¢                   7.54¢
     Operating expenses per ASM, excluding fuel                             6.47¢                    6.44¢                     6.30¢                   6.36¢
     Fuel cost per gallon (average)                                         82.8¢                    72.3¢                     68.0¢                   70.9¢
     Number of Employees at yearend                                       31,011                  32,847                    33,705                   31,580
     Size of fleet at yearend (5)                                           417                      388                       375                      355

     (1) Before cumulative effect of change in accounting principle
     (2) Includes effect of reclassification of revenue reported in 1999 through 1995 related to sale of flight segment
         credits from Other to Passenger due to the accounting change implemented in 2000
     (3) Certain figures in 2001 and 2002 include special items related to the September 11, 2001, terrorist attacks and Stabilization Act grant
     (4) Certain figures in 2003 include special items related to the Wartime Act grant
     (5) Includes leased aircraft
15
                                                                         Southwest Airlines Co. 2004 Annual Report


    2000            1999            1998               1997              1996                          1995


$     5,468     $     4,563     $     4 ,010       $     3, 670      $     3, 285               $        2,768
        111             103                99                 95                80                            66
           71              70              55                 52                41                            39
      5,650           4, 736          4 ,164             3, 817            3, 406                        2,873
      4,629           3,954           3,480              3, 293            3, 055                        2,559
      1,021             782             684                524               351                           314
           4                8           (21)                   7                10                             8
      1,017             774             705                517               341                           306
        392             299             272                199               134                           123
$       625     $       475     $       433        $       318       $       207                $          183
       $.84            $.63            $.58               $.43               $.28                         $.25
       $.79            $.59            $.55               $.41               $.27                         $.24
     $.0148          $.0143          $.0126             $ .0098           $.0087                        $.0079
$     6,670     $     5, 654    $     4,716        $     4, 246      $     3,723                $        3,256
$       761     $       872     $       623        $       628       $       650                $          661
$     3,451     $     2, 836    $     2,398        $     2, 009      $     1, 648               $        1,427


       10.1%            9.2%               9.7 %           8.0 %              5.9%                            6.0%
       19.9%           18.1 %          19.7 %             17.4 %             13.5%                        13.7%
        18.1%           16.5%          16.4%              13.7%              10.3%                        10.9%
        11.1%           10.0%          10.4%                  8.3%              6.1%                          6.4%


63,678,261      57,500, 213     52,586,400         50, 399 ,960      49, 621,504                    44 ,785,573
72,566,817      65,287,540      59,053,217         55,943,540        55,372,361                  50,038,707
42,215,162      36,479,322      31,419,110         28,355,169        27,083,483                     23,327,804
59,909,965      52,855,467      47,543,515         44,487, 496       40,727, 495                    36,180, 001
       70.5%           69.0%           66.1%              63.7%              66.5%                        64.5%
        663             634             597                563               546                           521
        492             465             441                425               410                           400
    903,754         846, 823        806,822            786,288           748, 634                      685,524
     $85.87          $79.35          $76.26            $72.81             $66.20                        $61.80
      12.95¢          12.51¢          12.76¢            12.94¢              12.13¢                       11.86¢
       9.43¢           8.96¢           8.76¢              8.58¢              8.36¢                        7.94¢
       7.73¢            7.48¢          7.32¢              7.40¢              7.50¢                        7.07¢
       6.38¢           6.55¢           6.50¢              6. 29¢             6.31¢                        6.06¢
       78.7¢           52.7¢           45.7¢              62.5¢              65.5¢                        55.2¢
     29, 274         27,653          25,844             23,974            22,944                        19,933
        344             312             280                261               243                           224
16   Southwest Airlines Co. 2004 Annual Report


     CORPORATE DATA

     TRANSFER AGENT AND REGISTRAR                     INDEPENDENT AUDITORS                             and Exchange Commission (SEC) is included
     Registered shareholder inquiries regarding       Ernst & Young LLP                                herein. Other financial information can be found
     stock transfers, address changes, lost stock     Dallas, Texas                                    on Southwest’s web site (southwest.com) or may
     certificates, dividend payments, or account                                                       be obtained without charge by writing or calling:
     consolidation should be directed to:             GENERAL OFFICES
                                                      P.O. Box 36611                                   Southwest Airlines Co.
     Wells Fargo Shareowner Services                  Dallas, Texas 75235-1611                         Investor Relations
     161 N. Concord Exchange                                                                           P.O. Box 36611
     South St. Paul, MN 55075                         ANNUAL MEETING                                   Dallas, Texas 75235-1611
     (866) 877-6206 (651) 450-4064                    The Annual Meeting of Shareholders of            Telephone (214) 792-4908
     www.shareowneronline.com                         Southwest Airlines Co. will be held at
                                                      10:00 a.m. on May 18, 2005, at the               WEB SITES
                                                                                                       www.southwest.com
     STOCK EXCHANGE LISTING                           Southwest Airlines Corporate Headquarters,
                                                                                                       www.swabiz.com
     New York Stock Exchange                          2702 Love Field Drive, Dallas, Texas.
                                                                                                       www.swavacations.com
     Ticker Symbol: LUV
                                                                                                       www.swacargo.com
                                                      FINANCIAL INFORMATION
                                                      A copy of the Company’s Annual Report
                                                      on Form 10-K as filed with the U.S. Securities


     DIRECTORS                                        JOHN T. MONTFORD                                 LAURA H. WRIGHT*
                                                      Senior Vice President — State Legislative and    Senior Vice President — Finance and Chief
     COLLEEN C. BARRETT                               Regulatory Affairs, SBC Services, Inc., San      Financial Officer
     President and Corporate Secretary,               Antonio, Texas; Audit and Nominating and
     Southwest Airlines Co., Dallas, Texas                                                             DEBORAH ACKERMAN
                                                      Corporate Governance (Chairman) Committees
                                                                                                       Vice President and General Counsel
     LOUIS CALDERA                                    JUNE M. MORRIS
     President, The University of New Mexico,         Founder and former Chief Executive Officer,      GREGORY N. CRUM
     Albuquerque, New Mexico; Audit and               Morris Air Corporation, Salt Lake City, Utah;    Vice President — Flight Operations
     Nominating and Corporate Governance              Audit, Compensation, and Nominating and
     Committees                                                                                        CAMILLE T. KEITH
                                                      Corporate Governance Committees
                                                                                                       Vice President — Special Marketing
     C. WEBB CROCKETT
                                                      OFFICERS
     Attorney, Fennemore Craig,                                                                        DARYL KRAUSE
     Attorneys at Law, Phoenix, Arizona;                                                               Vice President — Inf light
                                                      GARY C. KELLY*
     Compensation and Nominating and Corporate
                                                      Vice Chairman and Chief Executive Officer        KEVIN M. KRONE
     Governance Committees
                                                                                                       Vice President — Interactive Marketing
                                                      COLLEEN C. BARRETT*
     WILLIAM H. CUNNINGHAM, Ph.D.
                                                      President and Corporate Secretary
     James L. Bayless Professor of Marketing,                                                          PETE MCGLADE
     University of Texas School of Business;          DONNA D. CONOVER*                                Vice President — Schedule Planning
     Former Chancellor, The University of Texas       Executive Vice President — Customer Operations
                                                                                                       BOB MONTGOMERY
     System, Austin, Texas; Audit (Chairman) and
                                                      JAMES C. WIMBERLY*                               Vice President — Properties
     Nominating and Corporate Governance
                                                      Executive Vice President — Aircraft Operations
     Committees
                                                                                                       ROB MYRBEN
                                                      BEVERLY CARMICHAEL*
     WILLIAM P. HOBBY                                                                                  Vice President — Fuel
                                                      Vice President — Employee and Labor Relations
     Chairman of the Board, Hobby
                                                                                                       TAMMY ROMO
     Communications, L.L.C.; Former Lieutenant        GINGER C. HARDAGE*
                                                                                                       Vice President — Treasurer
     Governor of Texas; Houston, Texas; Audit,        Senior Vice President — Corporate
     Compensation (Chairman), and Nominating and      Communications                                   JAMES A. RUPPEL
     Corporate Governance Committees
                                                                                                       Vice President — Customer Relations and
                                                      ROBERT E. JORDAN*
     TRAVIS C. JOHNSON                                Senior Vice President — Enterprise Spend         Rapid Rewards
     Attorney at Law, El Paso, Texas; Audit,          Management
                                                                                                       RAY SEARS
     Executive, and Nominating and Corporate
                                                      TOM NEALON*                                      Vice President — Purchasing
     Governance Committees
                                                      Senior Vice President — Technology and Chief
                                                                                                       JIM SOKOL
     HERBERT D. KELLEHER                              Information Officer
     Chairman of the Board, Southwest Airlines Co.,                                                    Vice President — Maintenance and Engineering
                                                      RON RICKS*
     Dallas, Texas; Executive Committee
                                                      Senior Vice President — Law, Airports, and       KEITH L. TAYLOR
     GARY C. KELLY                                    Public Affairs                                   Vice President — Revenue Management
     Vice Chairman and Chief Executive Officer,
                                                      DAVE RIDLEY*                                     ELLEN TORBERT
     Southwest Airlines Co., Dallas, Texas
                                                      Senior Vice President — People and Leadership
                                                                                                       Vice President — Reservations
     ROLLIN W. KING                                   Development
     Retired, Dallas, Texas; Audit, Executive, and                                                     GREG WELLS
                                                      JOYCE C. ROGGE*
     Nominating and Corporate Governance                                                               Vice President — Ground Operations
                                                      Senior Vice President — Marketing
     Committees
                                                                                                       STEVEN P. WHALEY
                                                      MICHAEL G. VAN DE VEN*
     NANCY LOEFFLER
                                                                                                       Vice President — Controller
                                                      Senior Vice President — Planning
     Longtime advocate of volunteerism,
                                                                                                       *Member of Executive Planning Committee
     San Antonio, Texas
southwest airline ar04

Más contenido relacionado

La actualidad más candente

loews 2 CNA Lilienthal Mense
loews 2 CNA Lilienthal Mense loews 2 CNA Lilienthal Mense
loews 2 CNA Lilienthal Mense finance14
 
Arvinmeritor2001 Annua lReport
Arvinmeritor2001 Annua lReportArvinmeritor2001 Annua lReport
Arvinmeritor2001 Annua lReportfinance27
 
Downtown office market dashboard 2011 q1
Downtown office market dashboard 2011 q1Downtown office market dashboard 2011 q1
Downtown office market dashboard 2011 q1Chris Fyvie
 
constellation energy 2001 Annual Report
constellation energy 2001 Annual Report constellation energy 2001 Annual Report
constellation energy 2001 Annual Report finance12
 
Stryker AnnualReport2008
Stryker AnnualReport2008Stryker AnnualReport2008
Stryker AnnualReport2008finance34
 
WESCO AR 2007
WESCO AR 2007WESCO AR 2007
WESCO AR 2007finance34
 
southwest airline ar06
southwest airline ar06southwest airline ar06
southwest airline ar06finance40
 
whirlpool Annual Report2005
whirlpool Annual Report2005whirlpool Annual Report2005
whirlpool Annual Report2005finance13
 
progress energy 4/3/08
progress energy 4/3/08progress energy 4/3/08
progress energy 4/3/08finance25
 
Big_Lots_AR2004
Big_Lots_AR2004Big_Lots_AR2004
Big_Lots_AR2004finance50
 
Melbourne IT FY 2011 Investor Presentation
Melbourne IT FY 2011 Investor PresentationMelbourne IT FY 2011 Investor Presentation
Melbourne IT FY 2011 Investor PresentationMelbourne IT
 
Arq 94 229289
Arq 94 229289Arq 94 229289
Arq 94 229289Localiza
 

La actualidad más candente (13)

loews 2 CNA Lilienthal Mense
loews 2 CNA Lilienthal Mense loews 2 CNA Lilienthal Mense
loews 2 CNA Lilienthal Mense
 
Arvinmeritor2001 Annua lReport
Arvinmeritor2001 Annua lReportArvinmeritor2001 Annua lReport
Arvinmeritor2001 Annua lReport
 
Downtown office market dashboard 2011 q1
Downtown office market dashboard 2011 q1Downtown office market dashboard 2011 q1
Downtown office market dashboard 2011 q1
 
constellation energy 2001 Annual Report
constellation energy 2001 Annual Report constellation energy 2001 Annual Report
constellation energy 2001 Annual Report
 
Stryker AnnualReport2008
Stryker AnnualReport2008Stryker AnnualReport2008
Stryker AnnualReport2008
 
WESCO AR 2007
WESCO AR 2007WESCO AR 2007
WESCO AR 2007
 
southwest airline ar06
southwest airline ar06southwest airline ar06
southwest airline ar06
 
whirlpool Annual Report2005
whirlpool Annual Report2005whirlpool Annual Report2005
whirlpool Annual Report2005
 
progress energy 4/3/08
progress energy 4/3/08progress energy 4/3/08
progress energy 4/3/08
 
Big_Lots_AR2004
Big_Lots_AR2004Big_Lots_AR2004
Big_Lots_AR2004
 
Melbourne IT FY 2011 Investor Presentation
Melbourne IT FY 2011 Investor PresentationMelbourne IT FY 2011 Investor Presentation
Melbourne IT FY 2011 Investor Presentation
 
U.S. Airlines Economic Review
U.S. Airlines Economic ReviewU.S. Airlines Economic Review
U.S. Airlines Economic Review
 
Arq 94 229289
Arq 94 229289Arq 94 229289
Arq 94 229289
 

Destacado

Southwest airline case_study final version
Southwest airline case_study final versionSouthwest airline case_study final version
Southwest airline case_study final versionLuigi Cormaci
 
Southwest Airlines
Southwest AirlinesSouthwest Airlines
Southwest Airlinesjdslrc81
 
Southwest Airlines
Southwest AirlinesSouthwest Airlines
Southwest AirlinesMing Wei Lu
 
Five forces, swot and internal analysis of southwest airlines and the airline...
Five forces, swot and internal analysis of southwest airlines and the airline...Five forces, swot and internal analysis of southwest airlines and the airline...
Five forces, swot and internal analysis of southwest airlines and the airline...Hoang (Lee) Dang
 
Business Model Canvas of Discount Airline case study Southwest Airlines - Sho...
Business Model Canvas of Discount Airline case study Southwest Airlines - Sho...Business Model Canvas of Discount Airline case study Southwest Airlines - Sho...
Business Model Canvas of Discount Airline case study Southwest Airlines - Sho...Jukka Ala-Mutka, Dr Sc.
 
Strategic Analysis - Southwest Airlines Co.
Strategic Analysis - Southwest Airlines Co.Strategic Analysis - Southwest Airlines Co.
Strategic Analysis - Southwest Airlines Co.Shekera Alvarado
 
Southwest Airlines : Case Study
Southwest Airlines : Case StudySouthwest Airlines : Case Study
Southwest Airlines : Case StudySarang Bhutada
 

Destacado (10)

Southwest airline case_study final version
Southwest airline case_study final versionSouthwest airline case_study final version
Southwest airline case_study final version
 
Southwest Airlines
Southwest AirlinesSouthwest Airlines
Southwest Airlines
 
Southwest Airlines
Southwest AirlinesSouthwest Airlines
Southwest Airlines
 
Southwest airline compiled project report
Southwest airline  compiled project reportSouthwest airline  compiled project report
Southwest airline compiled project report
 
Southwest airline the best hr case study
Southwest airline  the best hr case studySouthwest airline  the best hr case study
Southwest airline the best hr case study
 
Five forces, swot and internal analysis of southwest airlines and the airline...
Five forces, swot and internal analysis of southwest airlines and the airline...Five forces, swot and internal analysis of southwest airlines and the airline...
Five forces, swot and internal analysis of southwest airlines and the airline...
 
Business Model Canvas of Discount Airline case study Southwest Airlines - Sho...
Business Model Canvas of Discount Airline case study Southwest Airlines - Sho...Business Model Canvas of Discount Airline case study Southwest Airlines - Sho...
Business Model Canvas of Discount Airline case study Southwest Airlines - Sho...
 
Strategic Analysis - Southwest Airlines Co.
Strategic Analysis - Southwest Airlines Co.Strategic Analysis - Southwest Airlines Co.
Strategic Analysis - Southwest Airlines Co.
 
Southwest Airlines : Case Study
Southwest Airlines : Case StudySouthwest Airlines : Case Study
Southwest Airlines : Case Study
 
All about Google
All about GoogleAll about Google
All about Google
 

Similar a southwest airline ar04

Starbucks 2009 Annual Report
Starbucks 2009 Annual ReportStarbucks 2009 Annual Report
Starbucks 2009 Annual Reportnove88
 
starbucks 2007AR
starbucks  2007ARstarbucks  2007AR
starbucks 2007ARfinance41
 
starbucks AR2008
starbucks  AR2008starbucks  AR2008
starbucks AR2008finance41
 
United Health Group Financial Performance at a Glance
United Health Group Financial Performance at a GlanceUnited Health Group Financial Performance at a Glance
United Health Group Financial Performance at a Glancefinance3
 
whirlpool Annual Report2006
whirlpool Annual Report2006whirlpool Annual Report2006
whirlpool Annual Report2006finance13
 
whirlpool Financial Highlights / Chairman's Letter
whirlpool Financial Highlights / Chairman's Letterwhirlpool Financial Highlights / Chairman's Letter
whirlpool Financial Highlights / Chairman's Letterfinance13
 
nordstrom AnnualReport2006
nordstrom AnnualReport2006nordstrom AnnualReport2006
nordstrom AnnualReport2006finance43
 
nordstrom AnnualReport2006
nordstrom AnnualReport2006nordstrom AnnualReport2006
nordstrom AnnualReport2006finance43
 
starbucks Annual_Report_2004_part2
starbucks  Annual_Report_2004_part2starbucks  Annual_Report_2004_part2
starbucks Annual_Report_2004_part2finance41
 
starbucks Annual_Report_2004_part2
starbucks  Annual_Report_2004_part2starbucks  Annual_Report_2004_part2
starbucks Annual_Report_2004_part2finance41
 
Brazil Market Managed Services Trend
Brazil Market Managed Services TrendBrazil Market Managed Services Trend
Brazil Market Managed Services TrendMichel Abranches
 
kellogg annual reports 2005
kellogg annual reports 2005kellogg annual reports 2005
kellogg annual reports 2005finance23
 
WESCO AR 2007
WESCO AR 2007WESCO AR 2007
WESCO AR 2007finance34
 
goldman sachs Creditor Presentation
goldman sachs Creditor Presentationgoldman sachs Creditor Presentation
goldman sachs Creditor Presentationfinance2
 
Creditor Presentation
Creditor Presentation Creditor Presentation
Creditor Presentation finance2
 
CloroxAR08_Complete
CloroxAR08_CompleteCloroxAR08_Complete
CloroxAR08_Completefinance48
 

Similar a southwest airline ar04 (20)

Starbucks 2009 Annual Report
Starbucks 2009 Annual ReportStarbucks 2009 Annual Report
Starbucks 2009 Annual Report
 
starbucks 2007AR
starbucks  2007ARstarbucks  2007AR
starbucks 2007AR
 
starbucks AR2008
starbucks  AR2008starbucks  AR2008
starbucks AR2008
 
United Health Group Financial Performance at a Glance
United Health Group Financial Performance at a GlanceUnited Health Group Financial Performance at a Glance
United Health Group Financial Performance at a Glance
 
whirlpool Annual Report2006
whirlpool Annual Report2006whirlpool Annual Report2006
whirlpool Annual Report2006
 
whirlpool Financial Highlights / Chairman's Letter
whirlpool Financial Highlights / Chairman's Letterwhirlpool Financial Highlights / Chairman's Letter
whirlpool Financial Highlights / Chairman's Letter
 
nordstrom AnnualReport2006
nordstrom AnnualReport2006nordstrom AnnualReport2006
nordstrom AnnualReport2006
 
nordstrom AnnualReport2006
nordstrom AnnualReport2006nordstrom AnnualReport2006
nordstrom AnnualReport2006
 
MHK07/03/07
MHK07/03/07MHK07/03/07
MHK07/03/07
 
MHK07/03/07
MHK07/03/07MHK07/03/07
MHK07/03/07
 
starbucks Annual_Report_2004_part2
starbucks  Annual_Report_2004_part2starbucks  Annual_Report_2004_part2
starbucks Annual_Report_2004_part2
 
starbucks Annual_Report_2004_part2
starbucks  Annual_Report_2004_part2starbucks  Annual_Report_2004_part2
starbucks Annual_Report_2004_part2
 
Brazil Market Managed Services Trend
Brazil Market Managed Services TrendBrazil Market Managed Services Trend
Brazil Market Managed Services Trend
 
kellogg annual reports 2005
kellogg annual reports 2005kellogg annual reports 2005
kellogg annual reports 2005
 
WESCOAR2007
WESCOAR2007WESCOAR2007
WESCOAR2007
 
WESCO AR 2007
WESCO AR 2007WESCO AR 2007
WESCO AR 2007
 
WESCOAR2007
WESCOAR2007WESCOAR2007
WESCOAR2007
 
goldman sachs Creditor Presentation
goldman sachs Creditor Presentationgoldman sachs Creditor Presentation
goldman sachs Creditor Presentation
 
Creditor Presentation
Creditor Presentation Creditor Presentation
Creditor Presentation
 
CloroxAR08_Complete
CloroxAR08_CompleteCloroxAR08_Complete
CloroxAR08_Complete
 

Más de finance40

thermo fisher ED886123-7163-46F5-8387-5F57485F786B_FINAL09SHOW_III
thermo fisher ED886123-7163-46F5-8387-5F57485F786B_FINAL09SHOW_IIIthermo fisher ED886123-7163-46F5-8387-5F57485F786B_FINAL09SHOW_III
thermo fisher ED886123-7163-46F5-8387-5F57485F786B_FINAL09SHOW_IIIfinance40
 
thermo fisher 04/01/06_10Q
thermo fisher 04/01/06_10Qthermo fisher 04/01/06_10Q
thermo fisher 04/01/06_10Qfinance40
 
thermo fisher 04/01/06_10Q
thermo fisher 04/01/06_10Qthermo fisher 04/01/06_10Q
thermo fisher 04/01/06_10Qfinance40
 
thermo fisher 07/01/06_10Q
thermo fisher 07/01/06_10Qthermo fisher 07/01/06_10Q
thermo fisher 07/01/06_10Qfinance40
 
thermo fisher 07/01/06_10Q
thermo fisher 07/01/06_10Qthermo fisher 07/01/06_10Q
thermo fisher 07/01/06_10Qfinance40
 
thermo fisher 09/30/06_10Q
thermo fisher 09/30/06_10Qthermo fisher 09/30/06_10Q
thermo fisher 09/30/06_10Qfinance40
 
thermo fisher 09/30/06_10Q
thermo fisher 09/30/06_10Qthermo fisher 09/30/06_10Q
thermo fisher 09/30/06_10Qfinance40
 
thermo fisher 12/30/0610K
thermo fisher 12/30/0610Kthermo fisher 12/30/0610K
thermo fisher 12/30/0610Kfinance40
 
thermo fisher 12/30/0610K
thermo fisher 12/30/0610Kthermo fisher 12/30/0610K
thermo fisher 12/30/0610Kfinance40
 
thermo fisher Q107_10Q
thermo fisher Q107_10Qthermo fisher Q107_10Q
thermo fisher Q107_10Qfinance40
 
thermo fisher Q107_10Q
thermo fisher Q107_10Qthermo fisher Q107_10Q
thermo fisher Q107_10Qfinance40
 
thermo fisher Q207_10Q
thermo fisher Q207_10Qthermo fisher Q207_10Q
thermo fisher Q207_10Qfinance40
 
thermo fisher Q207_10Q
thermo fisher Q207_10Qthermo fisher Q207_10Q
thermo fisher Q207_10Qfinance40
 
thermo fisher Q307_10Q
thermo fisher Q307_10Qthermo fisher Q307_10Q
thermo fisher Q307_10Qfinance40
 
thermo fisher Q307_10Q
thermo fisher Q307_10Qthermo fisher Q307_10Q
thermo fisher Q307_10Qfinance40
 
tmo_2007_10K
tmo_2007_10Ktmo_2007_10K
tmo_2007_10Kfinance40
 
tmo_2007_10K
tmo_2007_10Ktmo_2007_10K
tmo_2007_10Kfinance40
 
thermo fisher Q10810q
thermo fisher Q10810qthermo fisher Q10810q
thermo fisher Q10810qfinance40
 
thermo fisher Q10810q
thermo fisher Q10810qthermo fisher Q10810q
thermo fisher Q10810qfinance40
 
thermo fisher tmoq310q
thermo fisher tmoq310qthermo fisher tmoq310q
thermo fisher tmoq310qfinance40
 

Más de finance40 (20)

thermo fisher ED886123-7163-46F5-8387-5F57485F786B_FINAL09SHOW_III
thermo fisher ED886123-7163-46F5-8387-5F57485F786B_FINAL09SHOW_IIIthermo fisher ED886123-7163-46F5-8387-5F57485F786B_FINAL09SHOW_III
thermo fisher ED886123-7163-46F5-8387-5F57485F786B_FINAL09SHOW_III
 
thermo fisher 04/01/06_10Q
thermo fisher 04/01/06_10Qthermo fisher 04/01/06_10Q
thermo fisher 04/01/06_10Q
 
thermo fisher 04/01/06_10Q
thermo fisher 04/01/06_10Qthermo fisher 04/01/06_10Q
thermo fisher 04/01/06_10Q
 
thermo fisher 07/01/06_10Q
thermo fisher 07/01/06_10Qthermo fisher 07/01/06_10Q
thermo fisher 07/01/06_10Q
 
thermo fisher 07/01/06_10Q
thermo fisher 07/01/06_10Qthermo fisher 07/01/06_10Q
thermo fisher 07/01/06_10Q
 
thermo fisher 09/30/06_10Q
thermo fisher 09/30/06_10Qthermo fisher 09/30/06_10Q
thermo fisher 09/30/06_10Q
 
thermo fisher 09/30/06_10Q
thermo fisher 09/30/06_10Qthermo fisher 09/30/06_10Q
thermo fisher 09/30/06_10Q
 
thermo fisher 12/30/0610K
thermo fisher 12/30/0610Kthermo fisher 12/30/0610K
thermo fisher 12/30/0610K
 
thermo fisher 12/30/0610K
thermo fisher 12/30/0610Kthermo fisher 12/30/0610K
thermo fisher 12/30/0610K
 
thermo fisher Q107_10Q
thermo fisher Q107_10Qthermo fisher Q107_10Q
thermo fisher Q107_10Q
 
thermo fisher Q107_10Q
thermo fisher Q107_10Qthermo fisher Q107_10Q
thermo fisher Q107_10Q
 
thermo fisher Q207_10Q
thermo fisher Q207_10Qthermo fisher Q207_10Q
thermo fisher Q207_10Q
 
thermo fisher Q207_10Q
thermo fisher Q207_10Qthermo fisher Q207_10Q
thermo fisher Q207_10Q
 
thermo fisher Q307_10Q
thermo fisher Q307_10Qthermo fisher Q307_10Q
thermo fisher Q307_10Q
 
thermo fisher Q307_10Q
thermo fisher Q307_10Qthermo fisher Q307_10Q
thermo fisher Q307_10Q
 
tmo_2007_10K
tmo_2007_10Ktmo_2007_10K
tmo_2007_10K
 
tmo_2007_10K
tmo_2007_10Ktmo_2007_10K
tmo_2007_10K
 
thermo fisher Q10810q
thermo fisher Q10810qthermo fisher Q10810q
thermo fisher Q10810q
 
thermo fisher Q10810q
thermo fisher Q10810qthermo fisher Q10810q
thermo fisher Q10810q
 
thermo fisher tmoq310q
thermo fisher tmoq310qthermo fisher tmoq310q
thermo fisher tmoq310q
 

Último

CALL ON ➥8923113531 🔝Call Girls Gomti Nagar Lucknow best sexual service
CALL ON ➥8923113531 🔝Call Girls Gomti Nagar Lucknow best sexual serviceCALL ON ➥8923113531 🔝Call Girls Gomti Nagar Lucknow best sexual service
CALL ON ➥8923113531 🔝Call Girls Gomti Nagar Lucknow best sexual serviceanilsa9823
 
Call Girls Service Nagpur Maya Call 7001035870 Meet With Nagpur Escorts
Call Girls Service Nagpur Maya Call 7001035870 Meet With Nagpur EscortsCall Girls Service Nagpur Maya Call 7001035870 Meet With Nagpur Escorts
Call Girls Service Nagpur Maya Call 7001035870 Meet With Nagpur Escortsranjana rawat
 
Call Girls Koregaon Park Call Me 7737669865 Budget Friendly No Advance Booking
Call Girls Koregaon Park Call Me 7737669865 Budget Friendly No Advance BookingCall Girls Koregaon Park Call Me 7737669865 Budget Friendly No Advance Booking
Call Girls Koregaon Park Call Me 7737669865 Budget Friendly No Advance Bookingroncy bisnoi
 
(ANIKA) Budhwar Peth Call Girls Just Call 7001035870 [ Cash on Delivery ] Pun...
(ANIKA) Budhwar Peth Call Girls Just Call 7001035870 [ Cash on Delivery ] Pun...(ANIKA) Budhwar Peth Call Girls Just Call 7001035870 [ Cash on Delivery ] Pun...
(ANIKA) Budhwar Peth Call Girls Just Call 7001035870 [ Cash on Delivery ] Pun...ranjana rawat
 
The Economic History of the U.S. Lecture 17.pdf
The Economic History of the U.S. Lecture 17.pdfThe Economic History of the U.S. Lecture 17.pdf
The Economic History of the U.S. Lecture 17.pdfGale Pooley
 
The Economic History of the U.S. Lecture 30.pdf
The Economic History of the U.S. Lecture 30.pdfThe Economic History of the U.S. Lecture 30.pdf
The Economic History of the U.S. Lecture 30.pdfGale Pooley
 
(DIYA) Bhumkar Chowk Call Girls Just Call 7001035870 [ Cash on Delivery ] Pun...
(DIYA) Bhumkar Chowk Call Girls Just Call 7001035870 [ Cash on Delivery ] Pun...(DIYA) Bhumkar Chowk Call Girls Just Call 7001035870 [ Cash on Delivery ] Pun...
(DIYA) Bhumkar Chowk Call Girls Just Call 7001035870 [ Cash on Delivery ] Pun...ranjana rawat
 
Dharavi Russian callg Girls, { 09892124323 } || Call Girl In Mumbai ...
Dharavi Russian callg Girls, { 09892124323 } || Call Girl In Mumbai ...Dharavi Russian callg Girls, { 09892124323 } || Call Girl In Mumbai ...
Dharavi Russian callg Girls, { 09892124323 } || Call Girl In Mumbai ...Pooja Nehwal
 
High Class Call Girls Nagpur Grishma Call 7001035870 Meet With Nagpur Escorts
High Class Call Girls Nagpur Grishma Call 7001035870 Meet With Nagpur EscortsHigh Class Call Girls Nagpur Grishma Call 7001035870 Meet With Nagpur Escorts
High Class Call Girls Nagpur Grishma Call 7001035870 Meet With Nagpur Escortsranjana rawat
 
Log your LOA pain with Pension Lab's brilliant campaign
Log your LOA pain with Pension Lab's brilliant campaignLog your LOA pain with Pension Lab's brilliant campaign
Log your LOA pain with Pension Lab's brilliant campaignHenry Tapper
 
06_Joeri Van Speybroek_Dell_MeetupDora&Cybersecurity.pdf
06_Joeri Van Speybroek_Dell_MeetupDora&Cybersecurity.pdf06_Joeri Van Speybroek_Dell_MeetupDora&Cybersecurity.pdf
06_Joeri Van Speybroek_Dell_MeetupDora&Cybersecurity.pdfFinTech Belgium
 
TEST BANK For Corporate Finance, 13th Edition By Stephen Ross, Randolph Weste...
TEST BANK For Corporate Finance, 13th Edition By Stephen Ross, Randolph Weste...TEST BANK For Corporate Finance, 13th Edition By Stephen Ross, Randolph Weste...
TEST BANK For Corporate Finance, 13th Edition By Stephen Ross, Randolph Weste...ssifa0344
 
20240429 Calibre April 2024 Investor Presentation.pdf
20240429 Calibre April 2024 Investor Presentation.pdf20240429 Calibre April 2024 Investor Presentation.pdf
20240429 Calibre April 2024 Investor Presentation.pdfAdnet Communications
 
Best VIP Call Girls Noida Sector 18 Call Me: 8448380779
Best VIP Call Girls Noida Sector 18 Call Me: 8448380779Best VIP Call Girls Noida Sector 18 Call Me: 8448380779
Best VIP Call Girls Noida Sector 18 Call Me: 8448380779Delhi Call girls
 
Indore Real Estate Market Trends Report.pdf
Indore Real Estate Market Trends Report.pdfIndore Real Estate Market Trends Report.pdf
Indore Real Estate Market Trends Report.pdfSaviRakhecha1
 
The Economic History of the U.S. Lecture 20.pdf
The Economic History of the U.S. Lecture 20.pdfThe Economic History of the U.S. Lecture 20.pdf
The Economic History of the U.S. Lecture 20.pdfGale Pooley
 
Vip Call US 📞 7738631006 ✅Call Girls In Sakinaka ( Mumbai )
Vip Call US 📞 7738631006 ✅Call Girls In Sakinaka ( Mumbai )Vip Call US 📞 7738631006 ✅Call Girls In Sakinaka ( Mumbai )
Vip Call US 📞 7738631006 ✅Call Girls In Sakinaka ( Mumbai )Pooja Nehwal
 
Independent Call Girl Number in Kurla Mumbai📲 Pooja Nehwal 9892124323 💞 Full ...
Independent Call Girl Number in Kurla Mumbai📲 Pooja Nehwal 9892124323 💞 Full ...Independent Call Girl Number in Kurla Mumbai📲 Pooja Nehwal 9892124323 💞 Full ...
Independent Call Girl Number in Kurla Mumbai📲 Pooja Nehwal 9892124323 💞 Full ...Pooja Nehwal
 
VIP Call Girl in Mira Road 💧 9920725232 ( Call Me ) Get A New Crush Everyday ...
VIP Call Girl in Mira Road 💧 9920725232 ( Call Me ) Get A New Crush Everyday ...VIP Call Girl in Mira Road 💧 9920725232 ( Call Me ) Get A New Crush Everyday ...
VIP Call Girl in Mira Road 💧 9920725232 ( Call Me ) Get A New Crush Everyday ...dipikadinghjn ( Why You Choose Us? ) Escorts
 

Último (20)

CALL ON ➥8923113531 🔝Call Girls Gomti Nagar Lucknow best sexual service
CALL ON ➥8923113531 🔝Call Girls Gomti Nagar Lucknow best sexual serviceCALL ON ➥8923113531 🔝Call Girls Gomti Nagar Lucknow best sexual service
CALL ON ➥8923113531 🔝Call Girls Gomti Nagar Lucknow best sexual service
 
Call Girls Service Nagpur Maya Call 7001035870 Meet With Nagpur Escorts
Call Girls Service Nagpur Maya Call 7001035870 Meet With Nagpur EscortsCall Girls Service Nagpur Maya Call 7001035870 Meet With Nagpur Escorts
Call Girls Service Nagpur Maya Call 7001035870 Meet With Nagpur Escorts
 
Call Girls Koregaon Park Call Me 7737669865 Budget Friendly No Advance Booking
Call Girls Koregaon Park Call Me 7737669865 Budget Friendly No Advance BookingCall Girls Koregaon Park Call Me 7737669865 Budget Friendly No Advance Booking
Call Girls Koregaon Park Call Me 7737669865 Budget Friendly No Advance Booking
 
(ANIKA) Budhwar Peth Call Girls Just Call 7001035870 [ Cash on Delivery ] Pun...
(ANIKA) Budhwar Peth Call Girls Just Call 7001035870 [ Cash on Delivery ] Pun...(ANIKA) Budhwar Peth Call Girls Just Call 7001035870 [ Cash on Delivery ] Pun...
(ANIKA) Budhwar Peth Call Girls Just Call 7001035870 [ Cash on Delivery ] Pun...
 
The Economic History of the U.S. Lecture 17.pdf
The Economic History of the U.S. Lecture 17.pdfThe Economic History of the U.S. Lecture 17.pdf
The Economic History of the U.S. Lecture 17.pdf
 
The Economic History of the U.S. Lecture 30.pdf
The Economic History of the U.S. Lecture 30.pdfThe Economic History of the U.S. Lecture 30.pdf
The Economic History of the U.S. Lecture 30.pdf
 
(Vedika) Low Rate Call Girls in Pune Call Now 8250077686 Pune Escorts 24x7
(Vedika) Low Rate Call Girls in Pune Call Now 8250077686 Pune Escorts 24x7(Vedika) Low Rate Call Girls in Pune Call Now 8250077686 Pune Escorts 24x7
(Vedika) Low Rate Call Girls in Pune Call Now 8250077686 Pune Escorts 24x7
 
(DIYA) Bhumkar Chowk Call Girls Just Call 7001035870 [ Cash on Delivery ] Pun...
(DIYA) Bhumkar Chowk Call Girls Just Call 7001035870 [ Cash on Delivery ] Pun...(DIYA) Bhumkar Chowk Call Girls Just Call 7001035870 [ Cash on Delivery ] Pun...
(DIYA) Bhumkar Chowk Call Girls Just Call 7001035870 [ Cash on Delivery ] Pun...
 
Dharavi Russian callg Girls, { 09892124323 } || Call Girl In Mumbai ...
Dharavi Russian callg Girls, { 09892124323 } || Call Girl In Mumbai ...Dharavi Russian callg Girls, { 09892124323 } || Call Girl In Mumbai ...
Dharavi Russian callg Girls, { 09892124323 } || Call Girl In Mumbai ...
 
High Class Call Girls Nagpur Grishma Call 7001035870 Meet With Nagpur Escorts
High Class Call Girls Nagpur Grishma Call 7001035870 Meet With Nagpur EscortsHigh Class Call Girls Nagpur Grishma Call 7001035870 Meet With Nagpur Escorts
High Class Call Girls Nagpur Grishma Call 7001035870 Meet With Nagpur Escorts
 
Log your LOA pain with Pension Lab's brilliant campaign
Log your LOA pain with Pension Lab's brilliant campaignLog your LOA pain with Pension Lab's brilliant campaign
Log your LOA pain with Pension Lab's brilliant campaign
 
06_Joeri Van Speybroek_Dell_MeetupDora&Cybersecurity.pdf
06_Joeri Van Speybroek_Dell_MeetupDora&Cybersecurity.pdf06_Joeri Van Speybroek_Dell_MeetupDora&Cybersecurity.pdf
06_Joeri Van Speybroek_Dell_MeetupDora&Cybersecurity.pdf
 
TEST BANK For Corporate Finance, 13th Edition By Stephen Ross, Randolph Weste...
TEST BANK For Corporate Finance, 13th Edition By Stephen Ross, Randolph Weste...TEST BANK For Corporate Finance, 13th Edition By Stephen Ross, Randolph Weste...
TEST BANK For Corporate Finance, 13th Edition By Stephen Ross, Randolph Weste...
 
20240429 Calibre April 2024 Investor Presentation.pdf
20240429 Calibre April 2024 Investor Presentation.pdf20240429 Calibre April 2024 Investor Presentation.pdf
20240429 Calibre April 2024 Investor Presentation.pdf
 
Best VIP Call Girls Noida Sector 18 Call Me: 8448380779
Best VIP Call Girls Noida Sector 18 Call Me: 8448380779Best VIP Call Girls Noida Sector 18 Call Me: 8448380779
Best VIP Call Girls Noida Sector 18 Call Me: 8448380779
 
Indore Real Estate Market Trends Report.pdf
Indore Real Estate Market Trends Report.pdfIndore Real Estate Market Trends Report.pdf
Indore Real Estate Market Trends Report.pdf
 
The Economic History of the U.S. Lecture 20.pdf
The Economic History of the U.S. Lecture 20.pdfThe Economic History of the U.S. Lecture 20.pdf
The Economic History of the U.S. Lecture 20.pdf
 
Vip Call US 📞 7738631006 ✅Call Girls In Sakinaka ( Mumbai )
Vip Call US 📞 7738631006 ✅Call Girls In Sakinaka ( Mumbai )Vip Call US 📞 7738631006 ✅Call Girls In Sakinaka ( Mumbai )
Vip Call US 📞 7738631006 ✅Call Girls In Sakinaka ( Mumbai )
 
Independent Call Girl Number in Kurla Mumbai📲 Pooja Nehwal 9892124323 💞 Full ...
Independent Call Girl Number in Kurla Mumbai📲 Pooja Nehwal 9892124323 💞 Full ...Independent Call Girl Number in Kurla Mumbai📲 Pooja Nehwal 9892124323 💞 Full ...
Independent Call Girl Number in Kurla Mumbai📲 Pooja Nehwal 9892124323 💞 Full ...
 
VIP Call Girl in Mira Road 💧 9920725232 ( Call Me ) Get A New Crush Everyday ...
VIP Call Girl in Mira Road 💧 9920725232 ( Call Me ) Get A New Crush Everyday ...VIP Call Girl in Mira Road 💧 9920725232 ( Call Me ) Get A New Crush Everyday ...
VIP Call Girl in Mira Road 💧 9920725232 ( Call Me ) Get A New Crush Everyday ...
 

southwest airline ar04

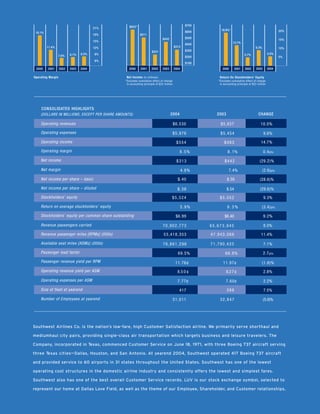
  • 1. $700 $625* 21% 19.9%* 20% $600 18.1% 18% $511 $500 $442 15% 15% 13.7% $400 $313 11.4% 9.3% 12% 10% $300 $241 5.9% 8.5% 9% 8.1% 5.7% 7.6% $200 5% 6% $100 2003 2004 2000 2001 2002 2003 2004 2000 2001 2002 2004 2000 2001 2002 2003 Net Income (in millions) Operating Margin Return On Stockholders’ Equity * Excludes cumulative effect of change * Excludes cumulative effect of change in accounting principle of $22 million in accounting principle of $22 million CONSOLIDATED HIGHLIGHTS 2004 2003 CHANGE (DOLLARS IN MILLIONS, EXCEPT PER SHARE AMOUNTS) Operating revenues $6,530 $5,937 10.0% Operating expenses $5,976 $5,454 9.6% Operating income 14.7% $554 $483 Operating margin 8.5% 8 . 1% 0.4pts. Net income (29.2)% $313 $442 Net margin 4.8% 7.4% (2.6)pts. Net income per share – basic $.40 $.56 (28.6)% Net income per share – diluted (29.6)% $.38 $.54 Stockholders’ equity $5,524 9.3% $5,052 Return on average stockholders’ equity 5.9% 9.3% (3.4)pts. Stockholders’ equity per common share outstanding 9.2% $6.99 $6.40 Revenue passengers carried 8.0% 70,902,773 65,673,945 Revenue passenger miles {RPMs} (000s) 53,418,353 47,943,066 11.4% Available seat miles {ASMs} (000s) 71,790,425 76,861,296 7.1% Passenger load factor 2.7pts. 69.5% 66.8% Passenger revenue yield per RPM 11.76¢ 11.97¢ (1.8)% Operating revenue yield per ASM 8.5 0 ¢ 8.2 7 ¢ 2.8% Operating expenses per ASM 7.77¢ 7.60¢ 2.2% Size of fleet at yearend 388 7.5% 417 Number of Employees at yearend 3 1, 0 11 32,847 (5.6)% Southwest Airlines Co. is the nation’s low-fare, high Customer Satisfaction airline. We primarily serve shorthaul and mediumhaul city pairs, providing single -class air transportation which targets business and leisure travelers. The Company, incorporated in Texas, commenced Customer Service on June 18, 1971, with three Boeing 737 aircraft serving three Texas cities—-Dallas, Houston, and San Antonio. At yearend 2004, Southwest operated 417 Boeing 737 aircraft and provided service to 60 airports in 31 states throughout the United States. Southwest has one of the lowest operating cost structures in the domestic airline industry and consistently offers the lowest and simplest fares. Southwest also has one of the best overall Customer Service records. LUV is our stock exchange symbol, selected to represent our home at Dallas Love Field, as well as the theme of our Employee, Shareholder, and Customer relationships.
  • 2. 1 Southwest Airlines Co. 2004 Annual Report DING! Sound familiar? It is the signal that Americans are now free to move about the country. It is also perhaps the most memorable sound and word in the airline industry. When Southwest Airlines first began flying back in 1971, our goal was to democratize the skies. While other airlines were charging a fistful of dollars to fly from Dallas, Texas, to Houston and San Antonio, Southwest’s low fare was a mere $15——less than bus fare! Today, we continue to offer our Customers legendary low fares, lots of daily flights, and our genuine Southwest Spirit from coast to coast. After 33-plus years, our mission still has a familiar ring to it.
  • 3. 2 Southwest Airlines Co. 2004 Annual Report To Our Shareholders: jet fuel (there is no futures market for refined jet fuel) are unusually high, we currently anticipate, if these market In 2004, Southwest Airlines recorded its 32nd consecutive conditions persist, that our first quarter 2005 jet fuel prices year of profitability, which, we believe, is a record unmatched will exceed our average fourth quarter 2004 jet fuel cost of in the history of the commercial airline industry. 89.1 cents per gallon. Our 2004 profit of $313 million (or $.38 per diluted share) In December 2004, we were successful in completing a exceeded our 2003 profit (excluding a special federal government significant transaction with ATA Airlines in its Chapter 11 allowance to the airline industry) of $298 million (or $.36 per bankruptcy proceeding. We acquired the rights to six additional diluted share) by 5.0 percent. gates at Chicago’s Midway Airport, which will soon be fully utilized by added Southwest flights, and a much needed six-bay In fourth quarter 2004, we experienced the unit revenue Midway Airport maintenance hangar. In addition, we agreed decline (revenue per available seat mile) that we warned to begin codesharing flights with ATA Airlines on February 4, about in our third quarter 2004 earnings press release. This 2005, initially exchanging single-ticketed passengers only at decline was accompanied by an increase of 20.1 percent, net the convenient Midway Airport connecting point between our of fuel hedging gains, in our jet fuel price per gallon. Primarily two airlines, with a limited number of other connecting points as a consequence of these two items, our fourth quarter 2004 to be subsequently added as our respective ground facilities earnings of $56 million (or $.07 per diluted share) were permit. We are, at this writing, already booking codeshare $10 million, or 15.2 percent, less than our fourth quarter 2003 passengers on our respective codesharing flights, and, as earnings of $66 million (or $.08 per diluted share). mentioned above, we expect this new relationship to augment That this diminution in fourth quarter earnings was principally our first quarter 2005 revenue stream during most of attributable to intense downward revenue pressures and to February and all of March. significantly enhanced jet fuel prices is evidenced by the fact that our costs per available seat mile, excluding fuel, declined In May 2004, we entered the Philadelphia market, and by 4.5 percent, primarily as the result of enhanced productivity. by March 2005, we will be providing nonstop service to 18 cities from Philadelphia, where our reception has been both Since depressed available seat mile yields and higher jet heartwarming and enormously enthusiastic. fuel prices were the primary causes of our year over year decline in fourth quarter 2004 earnings, what is the present In May of this year, we will begin service to Pittsburgh, status of these two earnings variables at the commencement which we view as a very promising opportunity since of first quarter 2005? US Airways has so drastically reduced its service to the Pittsburgh area, in effect disassembling its Pittsburgh hub. First, with respect to unit yields, our industry continues to Our routes and fares out of Pittsburgh will not be expand available domestic seat miles and, as a consequence, announced until later in the first quarter, but again, the charge ever lower fares in order to fill excess seats. This disclosure of our service plan engendered an enthusiastic “oversupply” of industry “product,” at present depressed levels reception and welcome. of uninduced passenger demand, is aided and abetted by Chapter 11 airline bankruptcy access as well as extraordinary government and vendor “subsidies” for failing airlines, which Our financial strength, cost consciousness, and dedicated together contravene the free enterprise “law” of supply and People support our reception of a net 29 new Boeing 737-700s demand. As a matter of economic doctrine, not allowing high-cost in 2005 and our available seat mile expansion of approximately carriers to cease operations enables the continuing sale of ten percent during the year. ever more seat miles at less than the cost of producing them. We are confident that our People’s awareness of the Based on recent events, we presently expect this condition debilitated condition of the domestic airline industry as a of “oversupply” to persist in first quarter 2005, alleviated, to whole and their valorous, wise, energetic, and stouthearted some extent, by the fact that the Easter Holiday falls in March response will enable us to continue as an industry leading of 2005, as compared to April in 2004, and by the cost-efficient, carrier providing unprecedented job security, profitsharing, somewhat enhanced revenue stream we expect from our and wellbeing to all of our Employees. Southwest was recently recent codesharing agreement with ATA Airlines. named “Best Low-Cost Carrier” by Business Traveler magazine, which is a tribute to our People’s warm, caring Customer Second, with respect to our jet fuel costs, we are presently Service (to each other and to our passengers) and to the high protected better than any major domestic carrier. For the quality, low-fare service ideal that we embody and continue to entirety of 2005, we are 85 percent hedged with prices pursue with rigorous vigor. capped at the equivalent of $26 per barrel of crude oil. Nonetheless, because prices are presently so high on the To all the People of Southwest Airlines, we say a united 15 percent unhedged portion of our anticipated requirements and because oil refinery spreads for converting crude oil to “thank you.” January 19, 2005 Most sincerely,
  • 4. 3 Southwest Airlines Co. 2004 Annual Report Herbert D. Kelleher Chairman of the Board Gary C. Kelly Chief Executive Officer Colleen C. Barrett President
  • 5. 4 Southwest Airlines Co. 2004 Annual Report For the fourth straight year, the Low Costs airline industry, as a whole, reported massive losses. The two major Although the cost gap between Southwest and the rest problems the industry faced in of the industry has narrowed due to LCC growth and cost 2004 were record-high energy reduction efforts by the legacy carriers through restructuring, prices and a glut of domestic bankruptcy, furloughs, and labor concessions, we continued to airline seats. Despite these be one of the lowest cost producers in the industry for 2004. staggering industry losses, high-cost carriers continued to Despite high energy prices, increased airport costs, and labor add capacity in an attempt to thwart the growth of low-cost rate pressures, Southwest Airlines has protected its low-cost carriers (LCCs), selling seats well below their costs to produce competitive advantage through our People’s perseverance and them. As a result of this oversupply of seats, revenue yields strenuous efforts to reduce costs. Southwest Airlines experienced remain under tremendous pressure. Southwest does not unfavorable cost trends during the first half of 2004, and anticipate a complete recovery in the industry’s or our revenues our Employees took aggressive and innovative measures to until there is a rationalization of industry capacity or a recovery improve our productivity and mitigate the cost pressures. in business full-fare travel. Their superb efforts were successful in the second half of 2004, reversing the trends for an Despite the extremely challenging environment we’ve improved cost performance. faced over the past four years, Southwest reported its 32nd consecutive annual profit in 2004. This was not an easy task Southwest’s low costs were instituted and was only achieved through the preparation, discipline, by our strategic decisions made early on dedication, and foresight of our resilient Employees. Our in our history——to fly a single aircraft wonderful Employees have always prepared for the tough type; operate an efficient point-to-point times during the good times and have always been willing to route system; and utilize our assets in a adapt quickly to the economic and competitive challenges highly efficient manner. However, our low affecting our Company. Over the last several years, the costs are preserved through the hard economic realities in our industry have drastically changed, work, creativity, and high spirits of our People. As a result of and our Employees have reacted with the same fighting our Employees’ amazing efforts, Southwest reduced its fourth SOUTHWEST SPIRIT that got us off the ground over 33 years quarter 2004 year over year unit costs (operating expenses ago. As a result, we remained one of the lowest cost producers per ASM), excluding fuel, by 4.5 percent, without sacrificing in the U.S. airline industry for 2004. the safety and quality of our outstanding Customer Service. Our Employees understand that our Customers demand Among other cost reduction measures, we made the difficult low fares now more than ever and did what was needed to decision to close three of our Reservations Centers (Dallas, lower our cost structure in 2004. We have a proven business Salt Lake City, and Little Rock) in February 2004. The strategy and the most respected and well-known airline decision to consolidate our Reservations Centers from nine to brand in the country. We have a top-rated frequent flyer six was made in response to the established shift by Customers program, Rapid Rewards, and are widely recognized for our to our web site, southwest.com, as a preferred way of booking Employees’ remarkable Customer Service. travel. Almost 60 percent of our passenger revenues were Despite the economic hardships our industry generated through southwest.com during 2004. We also has faced, our financial condition is stronger provided a Companywide early-out offer to our Employees in than ever. In this weak industry environment, June 2004 and introduced our “Going Where We’re Growing” we have excellent opportunities to grow and are program to ensure we are efficiently utilizing our extraordinary well-poised to return to historical profitability People throughout our operations. As a result of all these efforts levels once a meaningful reduction in unprofitable and more, we have successfully reduced our 2004 headcount industry capacity or rebound in full-fare per aircraft to 74 from 85 in 2003 without any furloughs, while business travel occurs. growing our ASMs over seven percent. 2000 2001 2002 2003 2004 7.77¢ 7.8¢ 6.5¢ 7.73¢ 6.47¢ 6.44¢ $5,468 $5,379 $5,341 $5,741 $6,280 Passenger Revenues 7.60¢ 6.38¢ 7.6¢ 6.4¢ 7.54¢ 6.36¢ Internet 39% 49% 54% 59% 31% 7.41¢ 7.4¢ 6.3¢ 6.30¢ Travel Agency 16% 13% 28% 25% 20% 7.2¢ 6.2¢ Reservations Center 28% 20% 19% 18% 24% 7.0¢ 6.1¢ Other 13% 11% 11% 10% 12% 2000 2001 2002 2003 2004 2000 2001 2002 2003 2004 Operating Expenses Per ASM, Excluding Fuel Passenger Revenues and Distribution Method (in millions) Operating Expenses Per Available Seat Mile
  • 6. 5 Southwest Airlines Co. 2004 Annual Report
  • 7. 6 Southwest Airlines Co. 2004 Annual Report We continue to automate our airport Employees and increasing longterm value for our loyal operations. All of our airports are Employee and non-Employee Shareholders. now equipped with RAPID CHECK-IN self-service kiosks. Customers can In addition to our low fares and convenient flight schedule, now print their boarding and transfer our frequent flyers are generously rewarded with free trips passes when they check in either through through our Rapid Rewards program. Rapid Rewards allows the self-service kiosks or through Customers to receive a roundtrip Award valid for travel southwest.com. While we have made great anywhere Southwest flies by simply flying eight roundtrips or strides in improving our productivity, controlling earning 16 credits (a one-way ticket equals one credit) within and reducing our costs is an ongoing effort 12 consecutive months. With no seat restrictions and limited that we will continue to pursue vigorously. blackout dates, Members can use their Award to fly virtually anytime to anywhere you can fly on Southwest. Rapid Rewards One of our greatest cost pressures is jet fuel, which is our Awards are also fully transferable. Inside Flyer magazine second highest cost category after labor. Although market jet recognized the generosity and simplicity of our Rapid Rewards fuel prices were at record high levels during 2004, Southwest program in 2004 with awards for Best Customer Service, Best had the wisdom and foresight to hedge approximately 80 to Award Redemption, Best Web Site, and Best Bonus Promotion 85 percent of our fuel needs, which reduced our 2004 fuel among all frequent flyer programs. Rapid Rewards Members and oil expense by $455 million. We are well-protected in can receive Rapid Rewards credits when doing business with ® ® ® 2005 with 85 percent of our anticipated fuel needs hedged at our Preferred Partners (Alamo, American Express, Budget, ® ® ® ® ® ® ® $26 per barrel of crude oil. We are also opportunistically Diners Club, Dollar, Hertz, Earthlink, Nextel, and Hilton, Hyatt, Marriott, La Quinta, and Choice® brand hotels) as well as through ® ® building hedging positions for future years and are currently hedged 65 percent at $32 per barrel in 2006; over 45 percent the use of the Southwest Airlines Rapid Rewards Visa credit card ® at $31 per barrel in 2007; 30 percent at $33 per barrel in issued by JPMorgan Chase Bank. 2008; and over 25 percent at $35 per barrel in 2009. Proven Business Strategy In addition to our protective fuel hedging position, we have implemented fuel conservation programs to offset high energy Southwest has a proven and costs. All of our Boeing 737-700 aircraft will have Blended flexible business strategy. Even Winglets installed by March 2005, which are estimated to though we offer low fares, our produce around three percent annual savings on fuel consumption strategy allows us to prosper in good per aircraft. Our Pilots, Dispatchers, Ground Operations, and times and maintain profitability in bad times. Of course, the key Fuel Management Employees also coordinate their efforts on to our success is low costs, and our unique operating strategy a daily basis to minimize fuel consumption as much as possible and Culture are the main ingredients to our low-cost formula. and purchase fuel at the lowest costs. Southwest has been able to continually achieve the highest Low Fares and Rapid Rewards productivity of any major U.S. airline and, therefore, the lowest unit costs (adjusted for stage length) in the U.S. airline While the recent industry fare changes to lower and industry. Although many factors contribute to our historic simplified fares may be a new phenomenon for many airlines, cost advantage, one of the primary drivers is our high asset our Customers have always been able to rely on Southwest utilization resulting from our dedication to the low-fare, Airlines for simple, low fares. From our inception, our point-to-point market niche. This market focus allows us to mission has been to give Americans the Freedom to Fly. operate a single aircraft type, the Boeing 737, which significantly We have policed the skies for over 33 years with our simplifies scheduling, operations, and maintenance, and low-fare service and have made air travel therefore minimizes costs. affordable for Americans. Unlike many of our competitors, we never charge a rebooking or We schedule our aircraft on a point-to-point, not hub-and- exchange fee, nor have we ever required a spoke, basis and concentrate on the local, not through or Saturday-night stay. After 33-plus years, our connecting, traffic. As a result, approximately 80 percent of low fares remain simple and reliable. our Customers fly nonstop. Our point-to-point system, as compared to hub-and-spoke, provides for more direct nonstop While there may be Southwest wannabes in routings for our Customers and, therefore, minimizes stops, what appears to be a permanent low-fare connections, delays, and total trip time. Although our frequent environment, the survivors will be the airlines flights and our recent codeshare agreement with ATA Airlines with the lowest costs, the highest quality service, and the best at Chicago Midway allow for the convenient connection and Employees. Southwest Airlines has built its 32 years of profitable transfer of Customers, we schedule our aircraft based on local operations on a low-fare, high quality, low-cost philosophy. We traffic needs. have the best Employees in America, who are devoted to our mission and Company. As a result, we remain well-positioned We serve many conveniently located secondary or downtown with our proven business strategy to meet the challenges of airports such as Baltimore/Washington, Chicago Midway, the airline industry with the ultimate objective of continued Dallas Love Field, Fort Lauderdale/Hollywood, Houston Hobby, prosperity, profitability, and job security for our deserving Long Island/Islip, Manchester, Oakland, and Providence.
  • 8. 7 Southwest Airlines Co. 2004 Annual Report
  • 9. 8 Southwest Airlines Co. 2004 Annual Report Although we have successful operations at As revealed in A&E’s heartwarming real-life series AIRLINE, larger hub airports such as Los Angeles (LAX), Southwest Employees pride themselves on delivering Philadelphia, and Phoenix, we prefer to Positively Outrageous Customer Service, which is why we avoid congested hub airports if there are consistently receive high marks in Customer Satisfaction, based better alternatives. We especially prefer on Customer complaints reported in the U.S. Department of to avoid airports with high costs in areas Transportation’s (D.O.T.) Air Travel Consumer Report. In addition, such as landing fees and terminal rents. Southwest was recently named “Best Low Cost Carrier” by Business Traveler magazine and was once again recognized We are selective and prudent about by FORTUNE as one of America’s Most Admired Companies the airports we choose to serve. We prefer and America’s most admired airline. to fly from airports that support a high number of frequencies and our low operating costs. In fact, eight of our airports have Our Employees consistently provide outstanding Customer over 100 departures per day. Our Schedule Planning Department Service because they genuinely care about our Company and continually evaluates the cost, efficiency, and convenience of our Customers. They also care about the communities we our airports and those we would like to one day serve. As part serve and embrace the causes they are passionate about with of this review and the ongoing industry challenges, Southwest their time and support. At Southwest, we have an amazing recently made the difficult decision to cease flight operations Culture and are proud that it is often used as a at Houston George Bush Intercontinental Airport where we measuring stick for corporations across America. operate six daily flights on April 2, 2005. The people of Houston, however, can still take advantage of our extensive As a result of our strong brand, frequent flight schedule (139 daily departures) at Houston Hobby flights, and low fares, Southwest dominates Airport. While this will be only the fifth airport we have exited the majority of the markets we serve. in our history, the focus on airport service allows us to Based on data for October 2004 (the latest sustain high productivity, provide reliable ontime service, and available data), Southwest is the largest maintain low airport unit costs. carrier in the United States based on originating domestic passengers boarded and We also schedule our aircraft to minimize the amount of scheduled domestic departures. We consistently rank first in time at the gate, which is why we consistently achieve the market share in approximately 90 percent of our top 100 city highest aircraft utilization and Employee productivity of any pairs, and in the aggregate, hold over 65 percent of the total major U.S. airline. Because our aircraft are generally at the market share in those markets. Southwest also carries the gate less than 25 minutes, we require fewer aircraft and gate most passengers in the top 100 U.S. markets despite serving only facilities than otherwise would be needed. 40 of them. As of third quarter 2004, we have a market share of 46 percent in Chicago Midway; 44 percent in Baltimore/Washington; Strong Brand and Reliable Customer Service 37 percent in Phoenix; and 34 percent in Las Vegas. We also have a 73 percent market share in intra-Texas; 68 percent in Southwest’s low fares, convenience, friendly Customer intra-California; and 53 percent in intra-Florida traffic. Service, robust route system, and longstanding profitability record have made Southwest Airlines one of the most Strong Financials respected brands in America. Our Customers know that they can depend on Southwest for a low fare and on our Employees to The airline industry is highly competitive. It is cyclical, get them to their destination on energy-intensive, labor-intensive, and capital-intensive. As a result, time with their bags. They also maintaining a strong financial position is imperative to our know that they will be treated with longterm prosperity. Our business has largely fixed operating kindness and care by our 31,000- costs, and our operations are susceptible to weather conditions, plus Employees from the moment natural disasters, and federal oversight. Without financial they book a reservation until their stability and preparation, it is difficult for an airline to survive bags arrive at their destination. such unpredictable circumstances. 1.25 1.21 $6,530 $7,000 $5,937 11:20 1.02 $6,000 $5,650 $5,555 $5,522 11:20 11:18 1.0 .89 .89 .88 .82 .79 $5,000 11:15 .75 11:12 11:10 $4,000 11:10 11:09 .58 .50 $3,000 11:05 .25 .18 $2,000 11:00 LUV ALK DAL CAL AMR NWAC UAL UAIR AWA 2000 2001 2002 2003 2004 2000 2001 2002 2003 2004 (in millions) Aircraft Utilizationminutes per day) (hours and (Complaints per 100,000 Customers boarded) Operating Revenues Customer Service For the year ending December 31, 2004
  • 10. 9 Southwest Airlines Co. 2004 Annual Report
  • 11. 10 Southwest Airlines Co. 2004 Annual Report As a result of prudent planning and Southwest acquired the leasehold rights to these six gates and discipline throughout our 33-plus year a six-bay maintenance hangar in Chicago for a purchase price history, we have the strongest balance sheet of $40 million. Our bid also included a commitment to codeshare in the airline industry and are the only U.S. airline with ATA at Chicago Midway and other points on our system, with an investment-grade credit rating. We subject to facility availability and Customer convenience; a have ample liquidity and access to capital. $40 million debtor-in-possession loan to ATA for bankruptcy We ended 2004 with $1.3 billion in cash restructuring purposes; and a commitment to convert the and a fully available bank revolving credit debtor-in-possession financing to a term loan, and purchase facility of $575 million. We also had $682 million in cash $30 million of non-voting convertible preferred stock upon deposits at Boeing for future aircraft deliveries. Our unmortgaged ATA’s emergence from bankruptcy. assets have a value of over $5 billion, and our debt to total capital is under 40 percent, including aircraft leases as debt. Through the ATA codeshare agreement, Southwest Airlines Customers will be able to initially connect in Chicago Midway Due to our strong financial position, we have been able to for travel between select Southwest cities and the following react quickly to growth opportunities even in the worst of ATA destinations: Boston Logan Airport, Denver International times. Although we prefer to grow at a managed growth rate Airport, Southwest Florida International Airport (serving of roughly eight percent per annum, we have the financial Ft. Myers/Naples), Honolulu International Airport, wherewithal and flexibility to take advantage of growth Minneapolis/St. Paul International Airport, New York’s opportunities as they arise. LaGuardia Airport, Newark Liberty International Airport, San Francisco Growth Opportunities International Airport, Sarasota- Bradenton Airport, St. Petersburg/ Southwest is a growth airline, and we believe we have lots Clearwater International Airport, of opportunities to grow and invest in our future. Our financial and Ronald Reagan Washington strength provides us the freedom to pursue market opportunities National Airport. We estimate this as they arise, even in this weakened industry environment. We codeshare agreement should increase Southwest’s annual revenues began service to Philadelphia in May 2004 with a tremendous by $25 to $50 million. reception from our Philadelphia Customers. Increasing daily flights from an initial 14 to 41 over the course of a few months, At the end of 2004, Southwest operated an all-coach, Philadelphia was our most aggressive startup ever, and we Boeing 737 fleet of 417 aircraft. All of our future orders, plan to continue to grow this market, as facilities become options, and purchase rights with The Boeing Company for available, to meet our Customers’ demands. We are also eager to 2005 through 2012 are for 737-700s. The average age of our begin service to Pittsburgh, our 60th city, which will open in young fleet is less than ten years. We are in the process of May 2005! renewing the interior and exterior of our entire fleet, which includes comfortable leather-covered seats, before the end Growing Chicago’s Midway Airport was also a priority in of 2005. 2004 and will continue to be so in 2005. By summer 2005, we will be at 170 daily departures, making Chicago Midway our The Boeing 737-700 remains our future. In January 2005, third-largest airport in terms of daily we retired our last five 737-200 aircraft, bringing an end to departures. To support future growth, the tenure of these reliable aircraft in the Company’s fleet. we acquired the leasehold rights to six We plan to add 34 new -700s to our fleet in 2005, for a net additional gates through the competitive addition of 29 aircraft and a ten percent year-over-year bid process in the ATA Airlines, Inc. capacity growth. We are projecting an average annual growth bankruptcy proceedings, bringing our rate of roughly eight percent through 2012, based on current total gates in Chicago Midway to 25. orders and options placed with Boeing. 500 9.5¢ 9.43¢ 417 2009- Type 2005 2006 2007 2008 Total 388 9.0¢ 2012 375 400 355 8.51¢ 8.50¢ 344 Firm Orders 34 26 25 6 – 91 8.5¢ 8.27¢ 8.02¢ 300 Options 8 9 25 – 42 8.0¢ – 7.5¢ Purchase Rights 20 177 217 – – 20 200 7.0¢ Total 34 54 51 177 350 34 2000 2001 2002 2003 2004 2000 2001 2002 2003 2004 Boeing 737-700 Firm Orders and Options Fleet Size (at yearend) Operating Revenues Per Available Seat Mile
  • 12. 11 Southwest Airlines Co. 2004 Annual Report
  • 13. 12 Southwest Airlines Co. 2004 Annual Report Seattle/ Tacoma Spokane Portland Manchester Buffalo/ (Boston Area) Niagara Falls Boise Providence Albany (Boston Area) Hartford/Springfield Detroit Long Island/Islip Pittsburgh Chicago Philadelphia Cleveland Sacramento Reno/Tahoe (Midway) Omaha Salt Lake City Baltimore/ Washington (BWI) Oakland Columbus (San Francisco Area) (D.C. Area) Kansas City Indianapolis San Jose Norfolk (San Francisco Area) (Southern Virginia) Louisville St. Louis Las Vegas Raleigh-Durham Nashville Tulsa Albuquerque Burbank (Santa Fe Area) Little Rock Los Angeles (LAX) Ontario Amarillo (Palm Springs Area) Orange County Oklahoma City Phoenix Lubbock San Diego Birmingham Tucson Dallas Jackson El Paso Midland/ (Love Field) Odessa Jacksonville Austin San Antonio New Orleans Orlando Houston Tampa Bay Corpus (Hobby) Christi West Palm Beach Southwest System Map (at yearend) Ft. Lauderdale (Miami Area) Harlingen/South Padre Island • Service to Pittsburgh starts May 2005 California 18% East 29% Other Carriers 34% Remaining West Southwest 26% 66% Midwest 16% Heartland 11% Southwest’s Market Share (at yearend) Southwest’s Capacity By Region (at yearend) (Southwest’s top 100 city-pair markets based on passengers carried) 200 195 190 175 165 150 145 139 129 125 123 117 100 86 85 75 50 Houston Baltimore/ Chicago Las Vegas San Diego Oakland Nashville Los Angeles Dallas Love Phoenix Hobby Washington Midway Southwest’s Top Ten Airports — Daily Departures (at yearend)
  • 14. 13 Southwest Airlines Co. 2004 Annual Report QUARTERLY FINANCIAL DATA (UNAUDITED) THREE MONTHS ENDED MARCH 31 JUNE 30 SEPTEMBER 30 DECEMBER 31 (In millions, except per share amounts) 2004 Operating revenues $1,484 $1,716 $1,674 $1,655 Operating income 46 197 191 120 Income before income taxes 41 179 181 89 Net income 26 113 119 56 Net income per share, basic .03 .14 .15 .07 Net income per share, diluted .03 .14 .15 .07 2003 Operating revenues $1,351 $1,515 $1, 553 $1,517 Operating income 46 140 185 111 Income before income taxes 39 397 171 101 Net income 24 246 106 66 Net income per share, basic .03 .32 .14 .08 Net income per share, diluted .03 .30 .13 .08 COMMON STOCK PRICE RANGES AND DIVIDENDS Southwest’s common stock is listed on the New York Stock Exchange and is traded under the symbol LUV. The high, low, and close sales prices of the common stock on the Composite Tape and the quarterly dividends per share were: PERIOD DIVIDENDS HIGH LOW CLOSE 2004 1st Quarter $.0045 $16.60 $12.88 $14.21 2nd Quarter .0045 17.06 13.56 16.77 3rd Quarter .0045 16.85 13.18 13.62 4th Quarter .0045 16.74 13.45 16.28 2003 1st Quarter $.0045 $15.33 $11.72 $14.36 2nd Quarter .0045 17.70 14.09 17.20 3rd Quarter .0045 18.99 15.86 17.61 4th Quarter .0045 19.69 15.30 16.14 60,000 80,000 76,861 53,418 75% 71,790 68,887 47,943 50,000 70.5% 70,000 69.5% 44,494 45,392 65,295 70% 68.1% 42,215 66.8% 65.9% 59,910 65% 60,000 40,000 60% 50,000 30,000 55% 40,000 20,000 50% 2000 2001 2002 2002 2004 2000 2001 2002 2003 2004 2003 2000 2001 2002 2004 Revenue Passenger Miles (in millions) Available Seat Miles (in millions) Passenger Load Factor
  • 15. 14 Southwest Airlines Co. 2004 Annual Report TEN -YEAR SUMMARY SELECTED CONSOLIDATED FINANCIAL DATA (Dollars in millions, except per share amounts) 2003(4) 2002(3) 2001(3) 2004 Operating revenues: Passenger (2) $ 6,280 $ 5,741 $ 5,341 $ 5,379 Freight 117 94 85 91 (2) Other 133 102 96 85 Total operating revenues 6,530 5,937 5,522 5,555 Operating expenses 5,976 5,454 5,105 4,924 Operating income 554 483 417 631 Other expenses (income), net 65 (225) 24 (197) Income before income taxes 489 708 393 828 Provision for income taxes 176 266 152 317 Net income (1) $ 313 $ 442 $ 241 $ 511 Net income per share, basic (1) $.40 $.56 $.31 $.67 (1) Net income per share, diluted $.38 $.54 $.30 $.63 Cash dividends per common share $.0180 $.0180 $.0180 $.0180 Total assets $ 11,337 $ 9,878 $ 8,954 $ 8,997 Long-term debt less current maturities $ 1,700 $ 1,332 $ 1,553 $ 1,327 Stockholders’ equity $ 5,524 $ 5,052 $ 4,422 $ 4,014 CONSOLIDATED FINANCIAL RATIOS Return on average total assets(1) 3.0% 4.7% 2.7% 6.5% (1) Return on average stockholders’ equity 5.9% 9.3% 5.7% 13.7% Operating margin 8.5% 8.1% 7.6% 11.4% Net margin 4.8% 7.4% 4.4% 9.2% CONSOLIDATED OPERATING STATISTICS Revenue passengers carried 70,902,773 65,673,945 63,045,988 64,446,773 Enplaned passengers 81,066,038 74,719,340 72,462,123 73,628,723 RPMs (000s) 53,418,353 47,943,066 45,391,903 44,493,916 ASMs (000s) 76,861,296 71,790,425 68,886,546 65,295,290 Passenger load factor 69.5% 66.8% 65.9% 68.1% Average length of passenger haul (miles) 753 730 720 690 Average stage length (miles) 576 558 537 514 Trips flown 981,591 949,882 947,331 940,426 Average passenger fare (2) $88.57 $87.42 $84.72 $83.46 (2) Passenger revenue yield per RPM 11.76¢ 11.97¢ 11.77¢ 12.09¢ Operating revenue yield per ASM 8.50¢ 8.27¢ 8.02¢ 8.51¢ Operating expenses per ASM 7.77¢ 7.60¢ 7.41¢ 7.54¢ Operating expenses per ASM, excluding fuel 6.47¢ 6.44¢ 6.30¢ 6.36¢ Fuel cost per gallon (average) 82.8¢ 72.3¢ 68.0¢ 70.9¢ Number of Employees at yearend 31,011 32,847 33,705 31,580 Size of fleet at yearend (5) 417 388 375 355 (1) Before cumulative effect of change in accounting principle (2) Includes effect of reclassification of revenue reported in 1999 through 1995 related to sale of flight segment credits from Other to Passenger due to the accounting change implemented in 2000 (3) Certain figures in 2001 and 2002 include special items related to the September 11, 2001, terrorist attacks and Stabilization Act grant (4) Certain figures in 2003 include special items related to the Wartime Act grant (5) Includes leased aircraft
  • 16. 15 Southwest Airlines Co. 2004 Annual Report 2000 1999 1998 1997 1996 1995 $ 5,468 $ 4,563 $ 4 ,010 $ 3, 670 $ 3, 285 $ 2,768 111 103 99 95 80 66 71 70 55 52 41 39 5,650 4, 736 4 ,164 3, 817 3, 406 2,873 4,629 3,954 3,480 3, 293 3, 055 2,559 1,021 782 684 524 351 314 4 8 (21) 7 10 8 1,017 774 705 517 341 306 392 299 272 199 134 123 $ 625 $ 475 $ 433 $ 318 $ 207 $ 183 $.84 $.63 $.58 $.43 $.28 $.25 $.79 $.59 $.55 $.41 $.27 $.24 $.0148 $.0143 $.0126 $ .0098 $.0087 $.0079 $ 6,670 $ 5, 654 $ 4,716 $ 4, 246 $ 3,723 $ 3,256 $ 761 $ 872 $ 623 $ 628 $ 650 $ 661 $ 3,451 $ 2, 836 $ 2,398 $ 2, 009 $ 1, 648 $ 1,427 10.1% 9.2% 9.7 % 8.0 % 5.9% 6.0% 19.9% 18.1 % 19.7 % 17.4 % 13.5% 13.7% 18.1% 16.5% 16.4% 13.7% 10.3% 10.9% 11.1% 10.0% 10.4% 8.3% 6.1% 6.4% 63,678,261 57,500, 213 52,586,400 50, 399 ,960 49, 621,504 44 ,785,573 72,566,817 65,287,540 59,053,217 55,943,540 55,372,361 50,038,707 42,215,162 36,479,322 31,419,110 28,355,169 27,083,483 23,327,804 59,909,965 52,855,467 47,543,515 44,487, 496 40,727, 495 36,180, 001 70.5% 69.0% 66.1% 63.7% 66.5% 64.5% 663 634 597 563 546 521 492 465 441 425 410 400 903,754 846, 823 806,822 786,288 748, 634 685,524 $85.87 $79.35 $76.26 $72.81 $66.20 $61.80 12.95¢ 12.51¢ 12.76¢ 12.94¢ 12.13¢ 11.86¢ 9.43¢ 8.96¢ 8.76¢ 8.58¢ 8.36¢ 7.94¢ 7.73¢ 7.48¢ 7.32¢ 7.40¢ 7.50¢ 7.07¢ 6.38¢ 6.55¢ 6.50¢ 6. 29¢ 6.31¢ 6.06¢ 78.7¢ 52.7¢ 45.7¢ 62.5¢ 65.5¢ 55.2¢ 29, 274 27,653 25,844 23,974 22,944 19,933 344 312 280 261 243 224
  • 17. 16 Southwest Airlines Co. 2004 Annual Report CORPORATE DATA TRANSFER AGENT AND REGISTRAR INDEPENDENT AUDITORS and Exchange Commission (SEC) is included Registered shareholder inquiries regarding Ernst & Young LLP herein. Other financial information can be found stock transfers, address changes, lost stock Dallas, Texas on Southwest’s web site (southwest.com) or may certificates, dividend payments, or account be obtained without charge by writing or calling: consolidation should be directed to: GENERAL OFFICES P.O. Box 36611 Southwest Airlines Co. Wells Fargo Shareowner Services Dallas, Texas 75235-1611 Investor Relations 161 N. Concord Exchange P.O. Box 36611 South St. Paul, MN 55075 ANNUAL MEETING Dallas, Texas 75235-1611 (866) 877-6206 (651) 450-4064 The Annual Meeting of Shareholders of Telephone (214) 792-4908 www.shareowneronline.com Southwest Airlines Co. will be held at 10:00 a.m. on May 18, 2005, at the WEB SITES www.southwest.com STOCK EXCHANGE LISTING Southwest Airlines Corporate Headquarters, www.swabiz.com New York Stock Exchange 2702 Love Field Drive, Dallas, Texas. www.swavacations.com Ticker Symbol: LUV www.swacargo.com FINANCIAL INFORMATION A copy of the Company’s Annual Report on Form 10-K as filed with the U.S. Securities DIRECTORS JOHN T. MONTFORD LAURA H. WRIGHT* Senior Vice President — State Legislative and Senior Vice President — Finance and Chief COLLEEN C. BARRETT Regulatory Affairs, SBC Services, Inc., San Financial Officer President and Corporate Secretary, Antonio, Texas; Audit and Nominating and Southwest Airlines Co., Dallas, Texas DEBORAH ACKERMAN Corporate Governance (Chairman) Committees Vice President and General Counsel LOUIS CALDERA JUNE M. MORRIS President, The University of New Mexico, Founder and former Chief Executive Officer, GREGORY N. CRUM Albuquerque, New Mexico; Audit and Morris Air Corporation, Salt Lake City, Utah; Vice President — Flight Operations Nominating and Corporate Governance Audit, Compensation, and Nominating and Committees CAMILLE T. KEITH Corporate Governance Committees Vice President — Special Marketing C. WEBB CROCKETT OFFICERS Attorney, Fennemore Craig, DARYL KRAUSE Attorneys at Law, Phoenix, Arizona; Vice President — Inf light GARY C. KELLY* Compensation and Nominating and Corporate Vice Chairman and Chief Executive Officer KEVIN M. KRONE Governance Committees Vice President — Interactive Marketing COLLEEN C. BARRETT* WILLIAM H. CUNNINGHAM, Ph.D. President and Corporate Secretary James L. Bayless Professor of Marketing, PETE MCGLADE University of Texas School of Business; DONNA D. CONOVER* Vice President — Schedule Planning Former Chancellor, The University of Texas Executive Vice President — Customer Operations BOB MONTGOMERY System, Austin, Texas; Audit (Chairman) and JAMES C. WIMBERLY* Vice President — Properties Nominating and Corporate Governance Executive Vice President — Aircraft Operations Committees ROB MYRBEN BEVERLY CARMICHAEL* WILLIAM P. HOBBY Vice President — Fuel Vice President — Employee and Labor Relations Chairman of the Board, Hobby TAMMY ROMO Communications, L.L.C.; Former Lieutenant GINGER C. HARDAGE* Vice President — Treasurer Governor of Texas; Houston, Texas; Audit, Senior Vice President — Corporate Compensation (Chairman), and Nominating and Communications JAMES A. RUPPEL Corporate Governance Committees Vice President — Customer Relations and ROBERT E. JORDAN* TRAVIS C. JOHNSON Senior Vice President — Enterprise Spend Rapid Rewards Attorney at Law, El Paso, Texas; Audit, Management RAY SEARS Executive, and Nominating and Corporate TOM NEALON* Vice President — Purchasing Governance Committees Senior Vice President — Technology and Chief JIM SOKOL HERBERT D. KELLEHER Information Officer Chairman of the Board, Southwest Airlines Co., Vice President — Maintenance and Engineering RON RICKS* Dallas, Texas; Executive Committee Senior Vice President — Law, Airports, and KEITH L. TAYLOR GARY C. KELLY Public Affairs Vice President — Revenue Management Vice Chairman and Chief Executive Officer, DAVE RIDLEY* ELLEN TORBERT Southwest Airlines Co., Dallas, Texas Senior Vice President — People and Leadership Vice President — Reservations ROLLIN W. KING Development Retired, Dallas, Texas; Audit, Executive, and GREG WELLS JOYCE C. ROGGE* Nominating and Corporate Governance Vice President — Ground Operations Senior Vice President — Marketing Committees STEVEN P. WHALEY MICHAEL G. VAN DE VEN* NANCY LOEFFLER Vice President — Controller Senior Vice President — Planning Longtime advocate of volunteerism, *Member of Executive Planning Committee San Antonio, Texas