Call Girls Rajgurunagar Call Me 7737669865 Budget Friendly No Advance Booking
tribune earnings_q4_01_tables
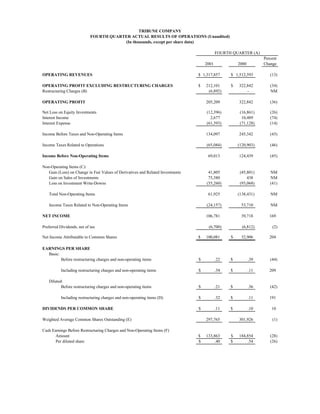
1. TRIBUNE COMPANY
FOURTH QUARTER ACTUAL RESULTS OF OPERATIONS (Unaudited)
(In thousands, except per share data)
FOURTH QUARTER (A)
Percent
2001 2000 Change
OPERATING REVENUES $ 1,317,857 $ 1,512,593 (13)
OPERATING PROFIT EXCLUDING RESTRUCTURING CHARGES $ 212,101 $ 322,842 (34)
Restructuring Charges (B) (6,892) - NM
OPERATING PROFIT 205,209 322,842 (36)
Net Loss on Equity Investments (12,396) (16,861) (26)
Interest Income 2,677 10,489 (74)
Interest Expense (61,393) (71,128) (14)
Income Before Taxes and Non-Operating Items 134,097 245,342 (45)
Income Taxes Related to Operations (65,084) (120,903) (46)
Income Before Non-Operating Items 69,013 124,439 (45)
Non-Operating Items (C):
Gain (Loss) on Change in Fair Values of Derivatives and Related Investments 41,805 (45,801) NM
Gain on Sales of Investments 75,380 438 NM
Loss on Investment Write-Downs (55,260) (93,068) (41)
Total Non-Operating Items 61,925 (138,431) NM
Income Taxes Related to Non-Operating Items (24,157) 53,710 NM
NET INCOME 106,781 39,718 169
Preferred Dividends, net of tax (6,700) (6,812) (2)
Net Income Attributable to Common Shares $ 100,081 $ 32,906 204
EARNINGS PER SHARE
Basic:
Before restructuring charges and non-operating items $ .22 $ .39 (44)
Including restructuring charges and non-operating items $ .34 $ .11 209
Diluted:
Before restructuring charges and non-operating items $ .21 $ .36 (42)
Including restructuring charges and non-operating items (D) $ .32 $ .11 191
DIVIDENDS PER COMMON SHARE $ .11 $ .10 10
Weighted Average Common Shares Outstanding (E) 297,765 301,926 (1)
Cash Earnings Before Restructuring Charges and Non-Operating Items (F)
Amount $ 133,863 $ 184,854 (28)
Per diluted share $ .40 $ .54 (26)
2. (A) 2001 quarter: Oct. 1, 2001 to Dec. 30, 2001. (13 weeks)
2000 quarter: Sept. 25, 2000 to Dec. 31, 2000. (14 weeks)
(B) During the second quarter of 2001, the Company announced a voluntary retirement program. In addition, various
other cost reduction initiatives have been implemented throughout the organization. In the fourth quarter of
2001, the Company recorded pretax restructuring charges of $6.9 million ($4.2 million after-tax) for these initiatives,
which reduced diluted earnings per share by $.01.
(C) The fourth quarter of 2001 included the following non-operating items:
Pretax Diluted
Gain (Loss) EPS
Gain on net change in fair values of PHONES derivatives and related
AOL Time Warner (quot;AOLquot;) shares $ 41,805 $ .08
Gain on sale of AOL common stock 74,896 .14
Gain on sale of other investments 484 -
Loss on investment write-downs (55,260) (.10)
Total non-operating items $ 61,925 $ .12
The fourth quarter of 2000 included the following non-operating items:
Pretax Diluted
Gain (Loss) EPS
Loss on net change in fair values of PHONES, DECS, PEPS and AOL
collar derivatives and related AOL and Mattel shares $ (45,801) $ (.08)
Gain on sale of investments 438 -
Loss on investment write-downs (93,068) (.17)
Total non-operating items $ (138,431) $ (.25)
(D) Diluted EPS was computed assuming that the Series B convertible preferred shares and the LYONs
debt securities were converted into common shares. Also, weighted average common shares outstanding
was adjusted for the dilutive effect of stock options. The Company has certain other convertible securities which
were not included in the calculation of diluted EPS because their effects were antidilutive. Following is the calculation
of diluted EPS for the fourth quarter:
Fourth Quarter
2001 2000
Net income $ 106,781 $ 39,718
Additional ESOP contribution required assuming Series B
preferred shares were converted, net of tax (2,670) (3,192)
Dividends for Series C, D-1, and D-2 preferred stock (2,014) (2,014)
LYONs interest expense, net of tax 1,550 1,501
Adjusted net income $ 103,647 $ 36,013
Weighted average common shares outstanding 297,765 301,926
Assumed conversion of Series B preferred shares into common 18,263 19,405
Assumed exercise of stock options, net of common
shares assumed repurchased 3,962 6,250
Assumed conversion of LYONs debt securities 7,272 7,272
Adjusted weighted average common
shares outstanding 327,262 334,853
Diluted earnings per share $ .32 $ .11
3. (E) The number of common shares outstanding, in thousands, at Dec. 30, 2001 was 298,003.
(F) Cash earnings was computed as net income before restructuring charges and non-operating items, plus amortization
of goodwill and other intangible assets. The calculations are summarized as follows:
Fourth Quarter
2001 2000
Net income before restructuring charges and non-operating items $ 73,216 $ 124,439
Amortization of intangible assets 60,647 60,415
Cash earnings before restructuring charges and non-operating items $ 133,863 $ 184,854
Per diluted share $ .40 $ .54
4. TRIBUNE COMPANY
FULL YEAR ACTUAL RESULTS OF OPERATIONS (Unaudited)
(In thousands, except per share data)
FULL YEAR (A)
Percent
2001 2000 Change
OPERATING REVENUES $ 5,253,366 $ 4,950,830 6
OPERATING PROFIT EXCLUDING RESTRUCTURING CHARGES $ 802,229 $ 1,033,011 (22)
Restructuring Charges (B) (151,892) - NM
OPERATING PROFIT 650,337 1,033,011 (37)
Net Loss on Equity Investments (60,813) (79,374) (23)
Interest Income 8,853 33,124 (73)
Interest Expense (254,521) (240,708) 6
Income from Continuing Operations Before Taxes and Non-Operating Items 343,856 746,053 (54)
Income Taxes Related to Operations (187,035) (328,040) (43)
Minority Interest Expense Related to Continuing Operations, net of tax (C) - (14,494) (100)
Income from Continuing Operations Before Non-Operating Items 156,821 403,519 (61)
Non-Operating Items (D):
Loss on Change in Fair Values of Derivatives and Related Investments (7,682) (100,965) (92)
Gain on Sales of Investments 78,358 59,504 32
Loss on Investment Write-Downs (145,581) (107,505) 35
Total Non-Operating Items (74,905) (148,966) (50)
Income Taxes Related to Non-Operating Items 29,220 57,689 (49)
Minority Interest Expense Related to Non-Operating Item, net of tax (C) - (1,841) (100)
Income from Continuing Operations 111,136 310,401 (64)
Loss from Discontinued Operations, net of tax (E) - (86,015) (100)
NET INCOME 111,136 224,386 (50)
Preferred Dividends, net of tax (26,800) (22,984) 17
Net Income Attributable to Common Shares $ 84,336 $ 201,402 (58)
5. EARNINGS PER SHARE
Basic:
From continuing operations
Before restructuring charges and non-operating items $ .75 $ 1.40 (46)
Including restructuring charges and non-operating items $ .28 $ 1.06 (74)
Discontinued operations - (.32) (100)
Total $ .28 $ .74 (62)
Diluted:
From continuing operations
Before restructuring charges and non-operating items $ .72 $ 1.30 (45)
Including restructuring charges and non-operating items $ .28 $ .99 (72)
Discontinued operations - (.29) (100)
Total (F) $ .28 $ .70 (60)
DIVIDENDS PER COMMON SHARE $ .44 $ .40 10
Weighted Average Common Shares Outstanding (G) 298,295 271,951 10
Cash Earnings from Continuing Operations Before Restructuring Charges
and Non-Operating Items (H)
Amount $ 490,497 $ 582,681 (16)
Per diluted share $ 1.45 $ 1.90 (24)
6. (A) 2001 full year: Jan. 1, 2001 to Dec. 30, 2001. (52 weeks)
2000 full year: Dec. 27, 1999 to Dec. 31, 2000. (53 weeks)
Times Mirror operating results are included beginning on April 17, 2000.
(B) During the second quarter of 2001, the Company announced a voluntary retirement program. In addition, various
other cost reduction initiatives have been implemented throughout the organization. For the full year
2001, the Company recorded pretax restructuring charges of $151.9 million ($92.6 million after-tax) for
these initiatives, which reduced diluted earnings per share by $.29.
(C) Minority interest expense was recorded for the 60.6% of Times Mirror not owned by Tribune from
April 17 through June 11, 2000.
(D) The full year 2001 included the following non-operating items:
Pretax Diluted
Gain (Loss) EPS
Loss on net change in fair values of PHONES, DECS, and PEPS derivatives and
related AOL Time Warner (quot;AOLquot;) and Mattel shares (1Q, 2Q, 3Q & 4Q) $ (7,682) $ (.01)
Gain on sale of AOL common stock (4Q) 74,896 .14
Gain on sale of other investments (1Q, 2Q, 3Q & 4Q) 3,462 .01
Loss on investment write-downs (2Q, 3Q & 4Q) (145,581) (.29)
Total non-operating items $ (74,905) $ (.15)
The full year 2000 included the following non-operating items:
Pretax Diluted
Gain (Loss) EPS
Loss on net change in fair values of PHONES, DECS, PEPS and AOL collar
derivatives and related AOL and Mattel shares (1Q, 2Q, 3Q & 4Q) $ (100,965) $ (.20)
Gain on sale of AOL common stock (1Q & 3Q) 13,011 .03
Gain on sale of Digital City and other investment (2Q & 3Q) 46,493 .10
Loss on investment write-downs (2Q, 3Q & 4Q) (107,505) (.24)
Total non-operating items $ (148,966) $ (.31)
(E) Tribune Education was sold to The McGraw-Hill Companies on Sept. 5, 2000 for approximately $686 million,
including the related tax benefit of $22 million. The accompanying financial statements reflect the Education
segment as discontinued operations, which are summarized as follows:
Full Year
2001 2000
Income from operations, net of tax $ - $ 9,743
Loss on disposal, net of tax and income during the holding period - (95,758)
Loss from discontinued operations, net of tax $ - $ (86,015)
7. (F) For the full year 2001, weighted average common shares outstanding was adjusted for the dilutive effects of stock
options. The Company's convertible preferred shares and the LYONs debt securities were not included in the
calculation of diluted EPS because their effects were antidilutive.
For 2000, diluted EPS was computed assuming that the Series B convertible preferred shares and the LYONs debt
securities were converted into common shares. Also, weighted average common shares outstanding was adjusted for
the dilutive effect of stock options. The Company has certain other convertible securities which were not included
in the calculation of diluted EPS because their effects were antidilutive. Following is the calculation of diluted EPS
for the full year 2001 and 2000:
Full Year
2001 2000
Net income $ 111,136 $ 224,386
Additional ESOP contribution required assuming Series B
preferred shares were converted, net of tax - (11,404)
Dividends for Series B, C, D-1, and D-2 preferred stock (26,800) (4,821)
LYONs interest expense, net of tax - 3,268
Minority interest adjustment, net of tax - (318)
Adjusted net income $ 84,336 $ 211,111
Weighted average common shares outstanding 298,295 271,951
Assumed conversion of Series B preferred shares into common - 19,405
Assumed exercise of stock options, net of common
shares assumed repurchased 5,685 4,396
Assumed conversion of LYONs debt securities - 3,979
Adjusted weighted average common
shares outstanding 303,980 299,731
Diluted earnings per share $ .28 $ .70
(G) The number of common shares outstanding, in thousands, at Dec. 30, 2001 was 298,003.
(H) Cash earnings was computed as income from continuing operations before restructuring charges and non-operating
items, plus amortization of goodwill and other intangible assets. The calculations are summarized as follows:
Full Year
2001 2000
Income from continuing operations, before restructuring charges and
non-operating items $ 249,460 $ 403,519
Amortization of intangible assets 241,037 179,162
Cash earnings from continuing operations, before restructuring charges
and non-operating items $ 490,497 $ 582,681
Per diluted share $ 1.45 $ 1.90
8. TRIBUNE COMPANY (A)
REPORTED BUSINESS SEGMENT DATA (Unaudited)
(In thousands)
FOURTH QUARTER FULL YEAR
2001 2000 % Change 2001 2000 % Change
BROADCASTING AND ENTERTAINMENT
Operating Revenues
Television $ 278,791 $ 332,268 (16) $ 1,130,125 $ 1,258,282 (10)
Radio 13,565 13,541 - 56,175 58,329 (4)
Entertainment/Other 26,446 24,799 7 163,635 148,942 10
Total Revenues 318,802 370,608 (14) 1,349,935 1,465,553 (8)
EBITDA (B)
Television 99,040 143,238 (31) 425,975 533,774 (20)
Radio 7,179 6,207 16 22,464 22,721 (1)
Entertainment/Other 4,719 2,467 91 3,929 7,991 (51)
Total before Restructuring Charges 110,938 151,912 (27) 452,368 564,486 (20)
Restructuring Charges (1,405) - NM (5,226) - NM
Total EBITDA 109,533 151,912 (28) 447,142 564,486 (21)
Operating Profit
Television 70,529 115,420 (39) 311,941 423,590 (26)
Radio 6,857 5,870 17 21,130 21,379 (1)
Entertainment/Other 3,850 1,246 NM 194 4,088 (95)
Total before Restructuring Charges 81,236 122,536 (34) 333,265 449,057 (26)
Restructuring Charges (2,210) - NM (6,567) - NM
Total Operating Profit $ 79,026 $ 122,536 (36) $ 326,698 $ 449,057 (27)
PUBLISHING
Operating Revenues $ 982,753 $ 1,128,550 (13) $ 3,843,949 $ 3,443,495 12
EBITDA before Restructuring Charges 222,958 313,898 (29) 850,730 942,531 (10)
Restructuring Charges (1,091) - NM (133,490) - NM
Total EBITDA 221,867 313,898 (29) 717,240 942,531 (24)
Operating Profit before Restructuring Charges 146,347 233,590 (37) 542,942 700,932 (23)
Restructuring Charges (4,465) - NM (140,409) - NM
Total Operating Profit $ 141,882 $ 233,590 (39) $ 402,533 $ 700,932 (43)
INTERACTIVE
Operating Revenues $ 16,302 $ 13,435 21 $ 59,482 $ 41,782 42
EBITDA before Restructuring Charges (3,692) (13,719) 73 (19,947) (44,139) 55
Restructuring Charges (5) - NM (1,896) - NM
Total EBITDA (3,697) (13,719) 73 (21,843) (44,139) 51
Operating Profit (Loss) before Restructuring Charges (6,754) (16,876) 60 (32,338) (52,606) 39
Restructuring Charges (5) - NM (2,922) - NM
Total Operating Profit (Loss) $ (6,759) $ (16,876) 60 $ (35,260) $ (52,606) 33
CORPORATE EXPENSES
EBITDA before Restructuring Charges $ (8,292) $ (14,854) 44 $ (39,056) $ (59,240) 34
Restructuring Charges (212) - NM (1,994) - NM
Total EBITDA (8,504) (14,854) 43 (41,050) (59,240) 31
Operating Profit (Loss) before Restructuring Charges (8,728) (16,408) 47 (41,640) (64,372) 35
Restructuring Charges (212) - NM (1,994) - NM
Total Operating Profit (Loss) $ (8,940) $ (16,408) 46 $ (43,634) $ (64,372) 32
CONSOLIDATED
Operating Revenues $ 1,317,857 $ 1,512,593 (13) $ 5,253,366 $ 4,950,830 6
EBITDA before Restructuring Charges 321,912 437,237 (26) 1,244,095 1,403,638 (11)
Restructuring Charges (2,713) - NM (142,606) - NM
Total EBITDA 319,199 437,237 (27) 1,101,489 1,403,638 (22)
Operating Profit before Restructuring Charges 212,101 322,842 (34) 802,229 1,033,011 (22)
Restructuring Charges (6,892) - NM (151,892) - NM
Total Operating Profit $ 205,209 $ 322,842 (36) $ 650,337 $ 1,033,011 (37)
(A) Times Mirror operating results are included beginning on April 17, 2000. Education operating results are excluded
from all periods presented.
(B) EBITDA is earnings before interest, taxes, depreciation, amortization of intangible assets, equity
results, non-operating items and minority interest.
9. TRIBUNE COMPANY
PRO FORMA RESULTS OF OPERATIONS (Unaudited) (A) (B) (C)
(In thousands)
FOURTH QUARTER FULL YEAR
2001 2000 Change 2001 2000 Change
OPERATING REVENUES
Broadcasting and Entertainment $ 318,802 $ 352,808 (10) $ 1,349,935 $ 1,447,753 (7)
Publishing 982,753 1,089,550 (10) 3,843,949 4,163,676 (8)
Interactive 16,302 13,135 24 59,482 47,704 25
Total operating revenues $ 1,317,857 $ 1,455,493 (9) $ 5,253,366 $ 5,659,133 (7)
EBITDA
Broadcasting and Entertainment $ 110,938 $ 145,412 (24) $ 452,368 $ 557,986 (19)
Publishing 222,958 307,898 (28) 850,730 1,139,745 (25)
Interactive (3,692) (13,269) 72 (19,947) (46,965) 58
Corporate Expenses (8,292) (13,793) 40 (39,056) (70,905) 45
Total EBITDA $ 321,912 $ 426,248 (24) $ 1,244,095 $ 1,579,861 (21)
OPERATING PROFIT
Broadcasting and Entertainment $ 81,236 $ 116,036 (30) $ 333,265 $ 442,557 (25)
Publishing 146,347 227,590 (36) 542,942 815,536 (33)
Interactive (6,754) (16,426) 59 (32,338) (58,624) 45
Corporate Expenses (8,728) (15,347) 43 (41,640) (77,315) 46
Total operating profit $ 212,101 $ 311,853 (32) $ 802,229 $ 1,122,154 (29)
(A) Tribune began to include Times Mirror in its reported results as of April 17, 2000. Pro forma data for full year 2000 assumes that
Times Mirror was acquired as of the beginning of fiscal 2000.
(B) Pro forma fourth quarter and full year 2000 amounts exclude the 53rd week in 2000. Reported 2000 revenues for Broadcasting and
Entertainment, Publishing and Interactive were reduced by $17.8 million, $39.0 million and $0.3 million, respectively. Reported 2000
EBITDA and operating profit were reduced by $6.5 million for Broadcasting and Entertainment and by $6.0 million for Publishing. The
reported 2000 operating cash flow loss (EBITDA) and operating loss were reduced by $0.5 million for Interactive and by $1.1 million for
Corporate.
(C) Pro forma fourth quarter and full year 2001 data excludes restructuring charges.
10. TRIBUNE COMPANY
SUMMARY OF REVENUES (Unaudited) (A) (B)
For Fourth Quarter Ended December 30, 2001
(In thousands)
Fourth Quarter Year-to-Date
(13 weeks) (14 weeks) (52 weeks) (53 weeks)
Actual Actual % Actual Pro Forma %
2001 2000 Change 2001 2000 Change
Broadcasting & Entertainment
$ 278,791 $ 332,268 $ 1,130,125 $ 1,258,282
Television (C) (16) (10)
13,565 13,541 56,175 58,329
Radio - (4)
26,446 24,799 163,635 148,942
Entertainment/Other 7 10
Segment Total (D) 318,802 370,608 (14) 1,349,935 1,465,553 (8)
Publishing
Advertising
1,230,071 1,306,339
Retail 358,543 403,421 (11) (6)
675,472 752,829
National 175,532 204,592 (14) (10)
1,041,610 1,270,457
Classified 217,584 289,571 (25) (18)
751,659 897,584 2,947,153 3,329,625
Sub-Total (16) (11)
167,834 171,974 662,368 655,701
Circulation (2) 1
234,428 217,350
Other 63,260 58,992 7 8
Segment Total (E) (F) 982,753 1,128,550 (13) 3,843,949 4,202,676 (9)
59,482 48,004
16,302 13,435 21 24
Interactive (G)
$ 1,317,857 $ 1,512,593 (13) $ 5,253,366 $ 5,716,233 (8)
Consolidated Revenues (H)
(A) The pro forma year-to-date 2000 data assumes that Times Mirror was acquired as of the beginning of fiscal 2000. The pro forma data does not
reflect any potential revenue enhancements or other synergies.
(B) The fourth quarter and full year 2001 comprised one less week than the same time periods in 2000.
(C) Includes WATL-Atlanta and WNOL-New Orleans, acquired in February 2000, and Tower Distribution (formerly United Video), acquired in
April 2001. On a same station basis, television revenues decreased 18% for the quarter and 12% for the year-to-date. Year-to-date includes
copyright royalties of $29.9 million in 2001 and $12.4 million in 2000. Excluding acquisitions, copyright royalties and the 53rd week in 2000,
television revenues decreased 14% for the quarter and 12% for the year-to-date.
(D) Excluding acquisitions, copyright royalties and the 53rd week in 2000, broadcasting and entertainment revenues decreased 11% for the quarter
and 10% for the year-to-date.
(E) Publishing revenues for 2000 actual and pro forma have been restated to conform with the 2001 presentation.
(F) Includes Virginia Gazette, acquired in February 2001 and TV Data, acquired in May 2001. Times Mirror's and Tribune's 2000 fiscal years
began on different days. This difference resulted in the seven newly acquired newspapers having five extra days in Period 1, 2001 compared to
Period 1, 2000. Excluding acquisitions, the extra five days and the 53rd week in 2000, publishing revenues decreased 11% for the quarter and
9% for the year-to-date.
(G) Excluding the 53rd week in 2000, interactive revenues increased 24% for the quarter and 25% for the year-to-date.
(H) Excluding acquisitions, copyright royalties, the 53rd week in 2000 and the extra days in 2001 for the seven newly acquired newspapers,
consolidated revenues decreased 11% for the quarter and 9% for the year-to-date.
11. TRIBUNE COMPANY
SUMMARY OF NEWSPAPER ADVERTISING VOLUME (Unaudited) (A) (B) (C)
For Fourth Quarter Ended December 30, 2001
(In thousands)
Fourth Quarter Year-to-Date
(13 weeks) (14 weeks) (52 weeks) (53 weeks)
Actual Actual % Actual Pro Forma %
2001 2000 Change 2001 2000 Change
Full Run
707 874 2,677 3,097
L.A. Times (19) (14)
Chicago Tribune 551 653 (16) 2,170 2,487 (13)
Newsday 423 479 (12) 1,684 1,731 (3)
Other Daily Newspapers (D) 3,584 3,980 (10) 13,895 15,105 (8)
Total 5,265 5,986 (12) 20,426 22,420 (9)
Part Run
1,409 1,448 5,199 6,036
L.A. Times (3) (14)
Chicago Tribune 1,379 1,485 (7) 5,589 5,546 1
Newsday 428 491 (13) 1,647 1,775 (7)
Other Daily Newspapers (D) 1,478 1,585 (7) 6,032 5,954 1
Total 4,694 5,009 (6) 18,467 19,311 (4)
Total Advertising Inches
Full Run
6,600 7,161
Retail 1,917 2,207 (13) (8)
3,324 3,962
National 873 1,054 (17) (16)
10,502 11,297
Classified 2,475 2,725 (9) (7)
5,265 5,986 20,426 22,420
Sub-Total (12) (9)
Part Run 4,694 5,009 (6) 18,467 19,311 (4)
Total 9,959 10,995 (9) 38,893 41,731 (7)
Preprint Pieces
1,692,348 1,227,319
L.A. Times (E) 536,761 417,930 28 38
2,718,692 2,941,339
Chicago Tribune 774,547 889,376 (13) (8)
2,286,951 2,284,529
Newsday 646,828 697,644 (7) -
3,431,825 3,505,340
Other Daily Newspapers (D) 1,008,103 1,045,730 (4) (2)
Total 2,966,239 3,050,680 (3) 10,129,816 9,958,527 2
(A) The pro forma year-to-date 2000 data assumes that Times Mirror was acquired as of the beginning of 2000. The pro forma data
does not reflect any potential revenue enhancements or other synergies.
(B) The fourth quarter and full year 2001 comprised one less week than the same time periods in 2000.
(C) Volume for 2000 actual and pro forma has been restated to conform with the 2001 presentation. Volume is based on preliminary
internal data, which may be updated in subsequent reports. Advertising volume is presented only for daily newspapers.
(D) Other daily newspapers include The Baltimore Sun, South Florida Sun-Sentinel, Orlando Sentinel, The Hartford Courant, The
Morning Call, Daily Press, The Advocate and Greenwich Time.
(E) Preprint pieces have been restated to exclude pieces distributed by L.A. Times direct mail operations.
12. TRIBUNE COMPANY
SUMMARY OF REVENUES (Unaudited) (A) (B)
For Period 12 Ended December 30, 2001
(In thousands)
Period 12 Year-to-Date
(5 weeks) (6 weeks) (52 weeks) (53 weeks)
Actual Actual % Actual Pro Forma %
2001 2000 Change 2001 2000 Change
Broadcasting & Entertainment
$ 97,860 $ 135,886 $ 1,130,125 $ 1,258,282
Television (C) (28) (10)
5,552 5,053 56,175 58,329
Radio 10 (4)
9,581 8,122 163,635 148,942
Entertainment/Other 18 10
Segment Total (D) 112,993 149,061 (24) 1,349,935 1,465,553 (8)
Publishing
Advertising
146,166 190,317 1,230,071 1,306,339
Retail (23) (6)
68,063 82,512 675,472 752,829
National (18) (10)
70,885 98,025 1,041,610 1,270,457
Classified (28) (18)
285,114 370,854 2,947,153 3,329,625
Sub-Total (23) (11)
63,401 72,280 662,368 655,701
Circulation (12) 1
22,607 20,059 234,428 217,350
Other 13 8
Segment Total (E) (F) 371,122 463,193 (20) 3,843,949 4,202,676 (9)
5,569 4,616 59,482 48,004
21 24
Interactive (G)
$ 489,684 $ 616,870 (21) $ 5,253,366 $ 5,716,233 (8)
Consolidated Revenues (H)
(A) The pro forma year-to-date 2000 data assumes that Times Mirror was acquired as of the beginning of fiscal 2000. The pro forma data does not
reflect any potential revenue enhancements or other synergies.
(B) Period 12 and full year 2001 comprised one less week than the same time periods in 2000.
(C) Includes WATL-Atlanta and WNOL-New Orleans, acquired in February 2000, and Tower Distribution (formerly United Video), acquired in
April 2001. On a same station basis, television revenues decreased 30% for the period and 12% for the year-to-date. Year-to-date includes
copyright royalties of $29.9 million in 2001 and $12.4 million in 2000. Excluding acquisitions, copyright royalties and the 53rd week in 2000,
television revenues decreased 18% for the period and 12% for the year-to-date.
(D) Excluding acquisitions, copyright royalties and the 53rd week in 2000, broadcasting and entertainment revenues decreased 14% for the period
and 10% for the year-to-date.
(E) Publishing revenues for 2000 actual and pro forma have been restated to conform with the 2001 presentation.
(F) Includes Virginia Gazette, acquired in February 2001 and TV Data, acquired in May 2001. Times Mirror's and Tribune's 2000 fiscal years
began on different days. This difference resulted in the seven newly acquired newspapers having five extra days in Period 1, 2001 compared to
Period 1, 2000. Excluding acquisitions, the extra five days and the 53rd week in 2000, publishing revenues decreased 13% for the period and
9% for the year-to-date.
(G) Excluding the 53rd week in 2000, interactive revenues increased 29% for the period and 25% for the year-to-date.
(H) Excluding acquisitions, copyright royalties, the 53rd week in 2000 and the extra days in 2001 for the seven newly acquired newspapers,
consolidated revenues decreased 13% for the period and 9% for the year-to-date.
13. TRIBUNE COMPANY
SUMMARY OF NEWSPAPER ADVERTISING VOLUME (Unaudited) (A) (B) (C)
For Period 12 Ended December 30, 2001
(In thousands)
Period 12 Year-to-Date
(5 weeks) (6 weeks) (52 weeks) (53 weeks)
Actual Actual % Actual Pro Forma %
2001 2000 Change 2001 2000 Change
Full Run
296 396 2,677 3,097
L.A. Times (25) (14)
204 266 2,170 2,487
Chicago Tribune (23) (13)
152 192 1,684 1,731
Newsday (21) (3)
1,314 1,607 13,895 15,105
Other Daily Newspapers (D) (18) (8)
20,426 22,420
Total 1,966 2,461 (20) (9)
Part Run
526 569 5,199 6,036
L.A. Times (8) (14)
434 542 5,589 5,546
Chicago Tribune (20) 1
153 197 1,647 1,775
Newsday (22) (7)
551 631 6,032 5,954
Other Daily Newspapers (D) (13) 1
Total 1,664 1,939 (14) 18,467 19,311 (4)
Total Advertising Inches
Full Run
781 1,052 6,600 7,161
Retail (26) (8)
334 419 3,324 3,962
National (20) (16)
851 990 10,502 11,297
Classified (14) (7)
1,966 2,461 20,426 22,420
Sub-Total (20) (9)
Part Run 1,664 1,939 (14) 18,467 19,311 (4)
Total 3,630 4,400 (18) 38,893 41,731 (7)
Preprint Pieces
232,168 206,979 1,692,348 1,227,319
L.A. Times (E) 12 38
305,144 404,646 2,718,692 2,941,339
Chicago Tribune (25) (8)
258,280 313,169 2,286,951 2,284,529
Newsday (18) -
425,429 485,165 3,431,825 3,505,340
Other Daily Newspapers (D) (12) (2)
Total 1,221,021 1,409,959 (13) 10,129,816 9,958,527 2
(A) The pro forma year-to-date 2000 data assumes that Times Mirror was acquired as of the beginning of 2000. The pro forma data
does not reflect any potential revenue enhancements or other synergies.
(B) Period 12 and full year 2001 comprised one less week than the same time periods in 2000.
(C) Volume for 2000 actual and pro forma has been restated to conform with the 2001 presentation. Volume is based on preliminary
internal data, which may be updated in subsequent reports. Advertising volume is presented only for daily newspapers.
(D) Other daily newspapers include The Baltimore Sun, South Florida Sun-Sentinel, Orlando Sentinel, The Hartford Courant, The
Morning Call, Daily Press, The Advocate and Greenwich Time.
(E) Preprint pieces have been restated to exclude pieces distributed by L.A. Times direct mail operations.