2. H O L LY C O R P O R AT I O N
OUR MISSION COMPANY PROFILE
Our mission is to be a premier U.S. petroleum Holly Corporation is an independent petroleum
refining and wholesale marketing company as refiner and marketer producing high-value products
measured by superior financial performance and such as gasoline, diesel fuel and jet fuel. Holly
sustainable, profitable growth. operates through its subsidiaries an 85,000 barrels
We seek to accomplish this by operating safely, per stream day (“bpsd”) refinery located in New
reliably and in an environmentally responsible Mexico, and a 26,000 bpsd refinery in Utah. Holly
manner, effectively and efficiently operating our also owns an interest in Holly Energy Partners, L.P.,
existing assets, offering superior products and which through subsidiaries owns or leases
services, and growing organically and through approximately 2,600 miles of petroleum product
strategic acquisitions. pipelines in Texas, New Mexico, Oklahoma and
We strive to outperform our competition due Utah and refined product terminals in several
to the quality and development of our people and Southwest and Rocky Mountain states.
our assets. We endeavor to maintain an inclusive
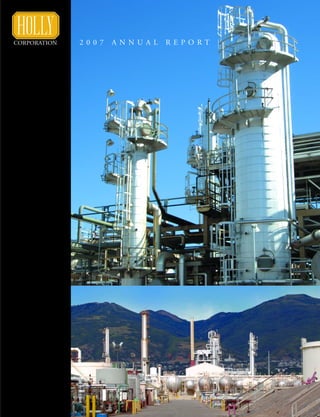
and stimulating work environment that enables Navajo Refinery
each employee to fully contribute to and participate
in the Company’s success.
3. H O L LY C O R P O R AT I O N
Financial and Operating Highlights
Years ended December 31, 2007 2006
Sales and other revenues $ 4,791,742,000 $ 4,023,217,000
Income from continuing operations before income taxes $ 499,444,000 $ 383,501,000
Net income $ 334,128,000 $ 266,566,000
Net income per common share - basic $ 6.09 $ 4.68
Net income per common share - diluted $ 5.98 $ 4.58
Net cash provided by operating activities $ 422,737,000 $ 245,183,000
Total assets $ 1,663,945,000 $ 1,237,869,000
Stockholders’ equity $ 593,794,000 $ 466,094,000
Sales of refined products - barrels per day (“bpd”) 126,800 119,870
Refinery production - bpd 113,270 105,730
Employees 909 859
Net Income Revenues Net Cash Provided by
Operating Activities
(millions of dollars) (millions of dollars)
(millions of dollars)
$4,792
$423
$334
$4,023
$267
$3,046
$251
$245
$168
05 06 07 05 06 07 05 06 07
4. H O L LY C O R P O R AT I O N
Refinery Production Stockholders’ Equity Total Assets
(thousands of barrels per day) (millions of dollars) (millions of dollars)
$1,664
$594
113
106
106
$1,238
$1,143
$466
$377
05 06 07 05 06 07 05 06 07
Dear Fellow Stockholders
By now you are used to hearing great things from Holly located within the Navajo and Woods Cross refinery complexes; the
Corporation and I am pleased to report that 2007 was another jet fuel products pipeline system from Artesia to Roswell, New
outstanding year for our Company and its stockholders. 2007 was Mexico; and several Woods Cross Refinery pipelines.
the fourth consecutive year in which we achieved all-time record
earnings. Salt Lake City to Las Vegas Refined Products Pipeline Project
Holly’s net income for 2007 was $334.1 million from continuing (UNEV Pipeline). In July, Holly announced an agreement with HEP
operations ($5.98 per diluted share), a substantial increase over our and Sinclair Transportation to build a new refined products pipeline
previous record net income from continuing operations of $246.9 from Salt Lake City, Utah to Las Vegas, Nevada, with terminal
million in 2006. facilities in the Cedar City, Utah area and North Las Vegas. HEP has
an option to purchase Holly’s share of the UNEV Pipeline after it
Some of Holly’s other key accomplishments in 2007 and the first becomes operational.
part of 2008 included: This pipeline is an important element of Holly’s strategy to deliver
continued growth and create stockholder value. Once completed, the
Increased Stock Repurchase Program. Our Board of Directors’ pipeline will offer Holly and other refiners in the Salt Lake City area,
confidence in the continued growth and profitability of Holly led to as well as shippers into Salt Lake City on the Pioneer Pipeline, the
increases of $300 million in the Company’s current stock repurchase ability to transport refined products to Las Vegas, Nevada and the
program. From the inception of our stock repurchase programs in fast growing area of Southwest Utah. Las Vegas will have a diversified
May 2005, Holly has repurchased approximately 13.5 million shares source of refined petroleum products to meet its growing demand,
for $518 million through December 2007. The plan to repurchase rather than depending solely on refined products from Southern
additional shares underscores the Company’s commitment to California. As the population increases in Southern Nevada and
enhancing value and returning capital to its stockholders. Southern Utah, two of the fastest growing areas in the country, so
does the demand for fuel. The UNEV pipeline will bring supplies to
Transfer of Pipeline and Tankage Assets to Holly Energy Partners. these fast-growing communities in the safest and cleanest way
In February 2008, Holly completed the transfer of certain pipeline possible. The pipeline is expected to commence operation in 2009
and tankage assets to Holly Energy Partners (HEP) for $171 million and is expected to create meaningful value for Holly.
in cash and approximately $9 million of HEP common units. The
assets include the Navajo Refinery crude oil delivery system; the Capital Spending Projects. In 2007, Holly’s Board of Directors
Western Permian Basin crude gathering lines; on-site crude tankage approved the final components of the refinery expansion and heavy
5. H O L LY C O R P O R AT I O N
Woods Cross Refinery
Navajo Refinery
2007 Sales of Refinery Produced Products
2007 Sales of Refinery Produced Products
26,130 BPD
88,920 BPD
59% GASOLINES
GASOLINES 63%
DIESEL FUELS
DIESEL FUELS 30% 27%
JET FUELS
JET FUELS 2%
3%
FUEL OILS
ASPHALTS 5%
2%
3%
LPG & OTHERS
LPG & OTHERS 6%
Woods Cross Refinery
crude oil processing projects for the Navajo and the Woods Cross Officer, succeeding Stephen McDonnell who now serves as Assistant
Refineries. These projects will improve Holly’s competitive position to the Chairman of the Board. In addition, George Damiris was
by increasing our feedstock optionality and overall refining capacity. appointed Senior Vice President, Supply & Marketing and Gary
Fuller was named Senior Vice President, Refinery Operations.
Important Additions to Senior Management Team. Holly has
announced a number of important promotions and hires to The Company’s plans for 2008 include:
strengthen its executive leadership. David Lamp, a tremendous asset
to the company, was named President in 2007, recognizing the Woods Cross Refinery Expansion. Holly’s upgrade and expansion
outstanding leadership he has demonstrated throughout his tenure at project at Woods Cross is proceeding on budget and ahead of its
Holly. More recently, Bruce Shaw was named Chief Financial initial schedule. We now expect it to be completed in the third
6. H O L LY C O R P O R AT I O N
quarter of 2008. This project will expand the capacity of the
Our Refined Product Markets
refinery by approximately 20% and most importantly will enhance
our ability to process low cost black wax and Canadian heavy crude
WASHINGT
ON
oils. We view our Woods Cross Refinery operations and the
MONTANA
SPOKANE
development of our UNEV pipeline as central components of our
Refinery/Terminals
Company’s future growth.
HEP Terminals
Product Pipelines:
HEP
Navajo Refinery Expansion. We expect to complete our Navajo
WYOMING Common Carrier
BOISE
expansion project in the first quarter of 2009. This project will
Corporate
Headquarters
increase our total capacity by approximately 18%, and increase
IDAHO
NEVADA
BURLEY
Navajo’s sour crude processing capabilities from 90% to 100%. In
WOODS CROSS
2008, we will also begin work on the heavy crude processing
component of our overall upgrade, which we expect to complete in
SALT LAKE CITY
the third quarter of 2009. Through this initiative, together with
the pipeline project that will give us access to feedstock from the
UTAH
COLORADO
BLOOMFIELD
ARIZONA
NEW MEXICO
Cushing area, Holly will gain the ability to process up to 40,000
LAS VEGAS TEXAS
MORIARTY
barrels of heavy Canadian crude each day at the Navajo Refinery.
ALBUQUERQUE
PHOENIX
These growth plans and our Company’s past record of profitable
DALLAS
growth and value creation would not be possible without the
TUCSON
ARTESIA tireless efforts of our talented employees. I would like to thank the
EL PASO
LOVINGTON
men and women of Holly for their dedication and service to the
NORTHERN MEXICO
Company.
Looking forward, we remain dedicated to continuing growth in
Stock Performance earnings while maintaining a strong balance sheet to take
Set forth below is a line graph comparing, for the period commencing January 1, 2003 and
advantage of strategic acquisitions or other opportunities to create
ending December 31, 2007, the annual percentage change in cumulative total stockholder return
value. We are guided every day by our commitments to safe,
on our common stock to the cumulative total stockholder return of the S&P Composite 500
Stock Index and of an industry peer group chosen by the Company. The stock price performance reliable and environmentally responsible operations, to good
depicted in the following graph is not necessarily indicative of future price performance. The
corporate citizenship, and to continuous improvement.
graph will not be deemed to be incorporated by reference in any filing by the Company under
We begin 2008 facing a challenging environment from a slowing
the Securities Act of 1933 or the Securities Exchange Act of 1934, except to the extent that the
Company specifically incorporates such graph by reference. economy and high energy prices. We believe the combination of
our strong financial position and the anticipated benefits from our
current value enhancing projects should better position Holly to
Holly Corp S&P 500 Index Peer Group(2)
weather challenging times and benefit from good times in the years
$1,000
ahead. Holly’s commitment to a strong balance sheet and
continued peer leading returns on invested capital should continue
$750
to result in increased stockholder value over the long term.
$500
Thank you for your continuing support.
$250
Sincerely,
0
Jan 03(1) Dec 03 Dec 04 Dec 05 Dec 06 Dec 07
Holly Corp $ 100 $ 128 $ 263 $ 559 $ 983 $ 981
S&P 500 Index $ 100 $ 129 $ 143 $ 150 $ 173 $ 183
Peer Group (2) $ 100 $ 150 $ 229 $ 452 $ 526 $ 710
(1) The amounts shown assume that the value of the investment in the Company and each index was $100 on
Matthew P. Clifton
January 1, 2003 and that all dividends have been reinvested.
(2) The Peer Group is comprised of Frontier Oil Corporation, Giant Industries, Inc. (included through 2006),
Chairman of the Board and Chief Executive Officer
Marathon Oil Corporation, Premcor, Inc. (included through 2004), Sunoco, Inc., Tesoro Petroleum Corp.
and Valero Energy Corporation. Premcor was acquired by Valero Energy Corporation in September 2005.
Giant was acquired by Western Refining, Inc. in June 2007. Most of the Peer Group companies are also
engaged in retail gasoline marketing in addition to their core refining activities and most are substantially
larger than the Company in terms of assets and revenues. March 20, 2008
7. UNITED STATES SECURITIES AND EXCHANGE COMMISSION
Washington, D.C. 20549
_____________________________________
FORM 10-K
(Mark One)
X Annual Report Pursuant to Section 13 or 15(d) of the Securities Exchange Act of 1934
For the fiscal year ended December 31, 2007
OR
Transition Report Pursuant to Section 13 or 15(d) of the Securities Exchange Act of 1934
For the transition period from to
Commission File Number 1-3876
HOLLY CORPORATION
(Exact name of registrant as specified in its charter)
Delaware 75-1056913
(State or other jurisdiction of (I.R.S Employer
incorporation or organization) Identification No.)
100 Crescent Court, Suite 1600, Dallas, Texas 75201-6915
(Address of principle executive offices) (Zip Code)
Registrant’s telephone number, including area code (214) 871-3555
Securities registered pursuant to Section 12(b) of the Act:
Common Stock, $0.01 par value registered on the New York Stock Exchange.
Securities registered pursuant to 12(g) of the Act:
None.
Indicate by check mark if the registrant is a well-known seasoned issuer, as defined in Rule 405 of the Securities Act.
Yes [X] No [ ]
Indicate by check mark if the registrant is not required to file reports pursuant to Section 13 or Section 15 (d) of the Act.
Yes [ ] No [X]
Indicate by check mark whether the registrant (1) has filed all reports required to be filed by Section 13 or 15(d) of the Securities
Exchange Act of 1934 during the preceding 12 months (or for such shorter period that the registrant was required to file such
reports), and (2) has been subject to such filing requirements for the past 90 days. Yes [X] No [ ]
Indicate by check mark if disclosure of delinquent filers pursuant to Item 405 of Regulation S-K is not contained herein, and will
not be contained, to the best of registrant’s knowledge, in definitive proxy or information statements incorporated by reference in
Part III of this Form 10-K or any amendment to this Form 10-K. [ ]
Indicate by check mark whether the registrant is a large accelerated filer, an accelerated filer, or a non-accelerated filer. See
definition of “accelerated filer and large accelerated filer” in Rule 12b-2 of the Exchange Act). (Check one):
Large accelerated filer [X] Accelerated filer [ ] Non-accelerated filer [ ] Smaller reporting company [ ]
Indicate by check mark whether the registrant is a shell company (as defined in Rule 12b-2 of the Exchange Act).
Yes [ ] No [X]
On June 30, 2007 the aggregate market value of the Common Stock, par value $.01 per share, held by non-affiliates of the
registrant was approximately $3,020,000,000. (This is not to be deemed an admission that any person whose shares were not
included in the computation of the amount set forth in the preceding sentence necessarily is an “affiliate” of the registrant.)
50,983,492 shares of Common Stock, par value $.01 per share, were outstanding on February 7, 2008.
DOCUMENTS INCORPORATED BY REFERENCE
Portions of the registrant’s proxy statement for its annual meeting of stockholders to be held on May 8, 2008, which proxy
statement will be filed with the Securities and Exchange Commission within 120 days after December 31, 2007, are incorporated
by reference in Part III.
8. TABLE OF CONTENTS
Item Page
PART I
Forward-Looking Statements.......................................................................................................... 3
Definitions ...................................................................................................................................... 4
1 and 2. Business and properties .................................................................................................... 7
1A. Risk factors....................................................................................................................... 21
1B. Unresolved staff comments .............................................................................................. 26
3. Legal proceedings............................................................................................................. 26
4. Submission of matters to a vote of security holders ......................................................... 27
PART II
5. Market for the Registrant’s common equity, related stockholder matters and issuer
purchases of equity securities........................................................................................ 28
6. Selected financial data ...................................................................................................... 29
7. Management’s discussion and analysis of financial condition and results of
operations...................................................................................................................... 30
7A. Quantitative and qualitative disclosures about market risk .............................................. 48
Reconciliations to amounts reported under generally accepted accounting principles ................... 48
8. Financial statements and supplementary data................................................................... 54
9. Changes in and disagreements with accountants on accounting and financial
disclosure ...................................................................................................................... 87
9A. Controls and procedures ................................................................................................... 87
9B. Other information ............................................................................................................. 87
PART III
10. Directors, executive officers and corporate governance................................................... 87
11. Executive compensation ................................................................................................... 87
12. Security ownership of certain beneficial owners and management and related
stockholder matters ....................................................................................................... 88
13. Certain relationships, related transactions and director independence ............................. 88
14. Principal accountant fees and services.............................................................................. 88
PART IV
15. Exhibits and financial statement schedules....................................................................... 89
Signatures ....................................................................................................................................... 90
Index to exhibits.............................................................................................................................. 92
-2-
9. PART I
FORWARD-LOOKING STATEMENTS
This Annual Report on Form 10-K contains certain “forward-looking statements” within the meaning of the federal
securities laws. All statements, other than statements of historical fact included in this Form 10-K, including, but
not limited to, those under “Business and Properties” in Items 1 and 2, “Risk Factors” in Item 1A, “Legal
Proceedings” in Item 3 and “Management’s Discussion and Analysis of Financial Condition and Results of
Operations” in Item 7, are forward-looking statements. These statements are based on management’s belief and
assumptions using currently available information and expectations as of the date hereof, are not guarantees of
future performance and involve certain risks and uncertainties. Although we believe that the expectations reflected
in these forward-looking statements are reasonable, we cannot assure you that our expectations will prove to be
correct. Therefore, actual outcomes and results could materially differ from what is expressed, implied or forecast
in these statements. Any differences could be caused by a number of factors including, but not limited to:
• risks and uncertainties with respect to the actions of actual or potential competitive suppliers of refined
petroleum products in our markets;
• the demand for and supply of crude oil and refined products;
• the spread between market prices for refined products and market prices for crude oil;
• the possibility of constraints on the transportation of refined products;
• the possibility of inefficiencies, curtailments or shutdowns in refinery operations or pipelines;
• effects of governmental regulations and policies;
• the availability and cost of our financing;
• the effectiveness of our capital investments and marketing strategies;
• our efficiency in carrying out construction projects;
• our ability to acquire refined product operations on acceptable terms and to integrate any future acquired
operations;
• the possibility of terrorist attacks and the consequences of any such attacks;
• general economic conditions; and
• other financial, operational and legal risks and uncertainties detailed from time to time in our Securities and
Exchange Commission filings.
Cautionary statements identifying important factors that could cause actual results to differ materially from our
expectations are set forth in this Form 10-K, including without limitation in conjunction with the forward-looking
statements included in this Form 10-K that are referred to above. When considering forward-looking statements,
you should keep in mind the risk factors and other cautionary statements set forth in this Form 10-K under “Risk
Factors” in Item 1A. All forward-looking statements included in this Form 10-K and all subsequent written or oral
forward-looking statements attributable to us or persons acting on our behalf are expressly qualified in their entirety
by these cautionary statements. The forward-looking statements speak only as of the date made and, other than as
required by law, we undertake no obligation to publicly update or revise any forward-looking statements, whether as
a result of new information, future events or otherwise.
-3-
10. DEFINITIONS
Within this report, the following terms have these specific meanings:
“Alkylation” means the reaction of propylene or butylene (olefins) with isobutane to form an iso-paraffinic
gasoline (inverse of cracking).
“BPD” means the number of barrels per calendar day of crude oil or petroleum products.
“BPSD” means the number of barrels per stream day (barrels of capacity in a 24 hour period) of crude oil or
petroleum products.
“Catalytic reforming” means a refinery process which uses a precious metal (such as platinum) based catalyst
to convert low octane naphtha to high octane gasoline blendstock and hydrogen. The hydrogen produced from the
reforming process is used to desulfurize other refinery oils and is the primary source of hydrogen for the refinery.
“Cracking” means the process of breaking down larger, heavier and more complex hydrocarbon molecules into
simpler and lighter molecules.
“Crude distillation” means the process of distilling vapor from liquid crudes, usually by heating, and
condensing slightly above atmospheric pressure the vapor back to liquid in order to purify, fractionate or form the
desired products.
“Ethanol” means a high octane gasoline blend stock that is used to make various grades of gasoline.
“FCC,” or fluid catalytic cracking, means a refinery process that breaks down large complex hydrocarbon
molecules into smaller more useful ones using a circulating bed of catalyst at relatively high temperatures.
“Hydrocracker” means a refinery unit that breaks down large complex hydrocarbon molecules into smaller
more useful ones using a fixed bed of catalyst at high pressure and temperature with hydrogen.
“Hydrodesulfurization” means to remove sulfur and nitrogen compounds from oil or gas in the presence of
hydrogen and a catalyst at relatively high temperatures.
“Hydrogen plant” means a refinery unit that converts natural gas and steam to high purity hydrogen, which is
then used in the hydrodesulfurization, hydrocracking and isomerization processes.
“HF alkylation,” or hydrofluoric alkylation, means a refinery process which combines isobutane and C3/C4
olefins using HF acid as a catalyst to make high octane gasoline blend stock.
“Isomerization” means a refinery process for rearranging the structure of C5/C6 molecules without changing
their size or chemical composition and is used to improve the octane of C5/C6 gasoline blendstocks.
“LPG” means liquid petroleum gases.
“LSG,” or low sulfur gasoline, means gasoline that contains less than 30 PPM of total sulfur.
“MMBtu” or one million British thermal units, means for each unit, the amount of heat required to raise one
pound of water one degree Fahrenheit at one atmosphere pressure.
“MMSCFD” means one million standard cubic feet per day.
“MTBE” means methyl tertiary butyl ether, a high octane gasoline blend stock that is used to make various
grades of gasoline.
-4-
11. “Natural gasoline” means a low octane gasoline blend stock that is purchased and used to blend with other
high octane stocks produced to make various grades of gasoline.
“PPM” means parts-per-million.
“Refinery gross margin” means the difference between average net sales price and average costs of products
per barrel of produced refined products. This does not include the associated depreciation, depletion and
amortization costs.
“Reforming” means the process of converting gasoline type molecules into aromatic, higher octane gasoline
blend stocks while producing hydrogen in the process.
“ROSE”, or “Solvent deasphalter / residuum oil supercritical extraction,” means a refinery unit that uses a light
hydrocarbon like propane or butane to extract non asphaltene heavy oils from asphalt or atmospheric reduced crude.
These deasphalted oils are then further converted to gasoline and diesel in the FCC process. The remaining
asphaltenes are either sold, blended to fuel oil or blended with other asphalt as a hardener.
“Sour crude oil” means crude oil containing quantities of sulfur greater than 0.4 percent by weight, while
“sweet crude oil” means crude oil containing quantities of sulfur equal to or less than 0.4 percent by weight.
“ULSD,” or ultra low sulfur diesel, means diesel fuel that contains less than 15 PPM of total sulfur.
“Vacuum distillation” means the process of distilling vapor from liquid crudes, usually by heating, and
condensing below atmospheric pressure the vapor back to liquid in order to purify, fractionate or form the desired
products.
-5-
12. INDEX TO DEFINED TERMS AND NAMES
The following other terms and names that appear in this form 10-K are defined on the following pages:
Page
Reference
CAA........................................................................................................................... 19
CERCLA ................................................................................................................... 20
Connacher.................................................................................................................. 8
Consent Agreement ................................................................................................... 19
CWA.......................................................................................................................... 20
DESC......................................................................................................................... 13
EBITDA..................................................................................................................... 32
EPA............................................................................................................................ 13
Exchange Act............................................................................................................. 86
FASB ......................................................................................................................... 7
FERC ......................................................................................................................... 26
FIN 46........................................................................................................................ 7
HEP............................................................................................................................ 7
HEP IPA .................................................................................................................... 17
HEP PTA ................................................................................................................... 17
HEP Senior Notes ...................................................................................................... 38
Leased Pipeline.......................................................................................................... 7
LIFO .......................................................................................................................... 34
MDEQ ....................................................................................................................... 27
Montana Refinery ...................................................................................................... 8
MRC .......................................................................................................................... 27
Navajo Refinery......................................................................................................... 7
NPDES....................................................................................................................... 20
PEMEX...................................................................................................................... 9
Plains ......................................................................................................................... 11
Rio Grande................................................................................................................. 7
SEC............................................................................................................................ 7
SDWA ....................................................................................................................... 20
SFAS.......................................................................................................................... 44
SFPP .......................................................................................................................... 11
VIE ............................................................................................................................ 44
VRDN........................................................................................................................ 37
Woods Cross Refinery............................................................................................... 7
Terms used in the financial statements and footnotes are as defined therein.
-6-
13. Items 1 and 2. Business and Properties
COMPANY OVERVIEW
References herein to Holly Corporation include Holly Corporation and its consolidated subsidiaries. In accordance
with the Securities and Exchange Commission’s (“SEC”) “Plain English” guidelines, this Annual Report on Form
10-K has been written in the first person. In this document, the words “we”, “our”, “ours” and “us” refer only to
Holly Corporation and its consolidated subsidiaries or to Holly Corporation or an individual subsidiary and not to
any other person.
We are principally an independent petroleum refiner which produces high value light products such as gasoline,
diesel fuel and jet fuel. We were incorporated in Delaware in 1947 and maintain our principal corporate offices at
100 Crescent Court, Suite 1600, Dallas, Texas 75201-6915. Our telephone number is 214-871-3555 and our
internet website address is www.hollycorp.com. The information contained on our website does not constitute part
of this Annual Report on Form 10-K. A print copy of this Annual Report on Form 10-K will be provided without
charge upon written request to the Vice President, Investor Relations at the above address. A direct link to our
filings at the SEC web site is available on our website on the Investors page. Also available on our website are
copies of our Corporate Governance Guidelines, Audit Committee Charter, Compensation Committee Charter,
Nominating / Corporate Governance Committee Charter and Code of Business Conduct and Ethics, all of which will
be provided without charge upon written request to the Vice President, Investor Relations at the above address. Our
Code of Business Conduct and Ethics applies to all of our officers, employees and directors, including our principal
executive officer, principal financial officer and principal accounting officer. On April 26, 2004, our stock began
trading on the New York Stock Exchange under the trading symbol “HOC”. Our stock formerly traded on the
American Stock Exchange.
In July 2004, we completed the initial public offering of limited partnership interests in Holly Energy Partners, L.P.
(“HEP”), a Delaware limited partnership that also trades on the New York Stock Exchange under the trading symbol
“HEP”. HEP was formed to acquire, own and operate substantially all of the refined product pipeline and
terminalling assets that support our refining and marketing operations in west Texas, New Mexico, Utah and
Arizona and a 70% interest in Rio Grande Pipeline Company (“Rio Grande”). We initially consolidated the results
of HEP and showed the interest we did not own as a minority interest in ownership and earnings. On July 8, 2005,
we closed on a transaction for HEP to acquire our two 65-mile parallel intermediate feedstock pipelines which
connect our Lovington and Artesia, New Mexico facilities, which reduced our ownership interest in HEP to 45.0%.
Under the provision of the Financial Accounting Standards Board (“FASB”) Interpretation No. 46 (revised),
“Consolidation of Variable Interest Entities,” (“FIN 46”) we deconsolidated HEP effective July 1, 2005. The
deconsolidation has been presented from July 1, 2005 forward, and our share of the earnings of HEP from July 1,
2005 is reported using the equity method of accounting.
As of December 31, 2007, we:
• owned and operated two refineries consisting of a petroleum refinery in Artesia, New Mexico that is
operated in conjunction with crude oil distillation and vacuum distillation and other facilities situated 65
miles away in Lovington, New Mexico (collectively known as the “Navajo Refinery”), and a refinery in
Woods Cross, Utah (“Woods Cross Refinery”);
• owned approximately 900 miles of crude oil pipelines located principally in west Texas and New Mexico;
• owned and operated Holly Asphalt Company (formerly, NK Asphalt Partners) which manufactures and
markets asphalt products from various terminals in Arizona and New Mexico; and
• owned a 45% interest in HEP (which includes our 2% general partnership interest), which has logistics
assets including approximately 1,700 miles of petroleum product pipelines located in Texas, New Mexico
and Oklahoma (including 340 miles of leased pipeline); ten refined product terminals; two refinery truck
rack facilities; a refined products tank farm facility; and a 70% interest in Rio Grande.
On February 26, 2008, we announced an agreement for the sale of certain pipeline and tankage assets to HEP for
$180.0 million. The agreement provides for consideration to us of $171.0 million in cash and HEP common units
valued at approximately $9.0 million. The assets include 136 miles of crude oil trunk lines that deliver crude to our
Navajo Refinery in southeast New Mexico, approximately 725 miles of gathering and connection pipelines located
in west Texas and New Mexico, on-site crude tankage having a combined 600,000 barrels of storage capacity
-7-
14. located within the Navajo and Woods Cross Refinery complexes, a jet fuel products pipeline and terminal (terminal
leased through September 2011) between Artesia and Roswell, New Mexico, and 10 miles of crude oil and product
pipelines that support our Woods Cross Refinery. In connection with the closing of this transaction, we will enter
into a 15-year pipelines and tankage agreement with HEP that will contain a minimum annual revenue commitment
to HEP from us. This transaction is expected to close on February 29, 2008. We expect the consummation of this
proposed transaction to result in our owning a beneficial variable interest in HEP in excess of 50%. In accordance
with provisions under FIN 46, we expect to reconsolidate HEP effective March 1, 2008.
Navajo Refining Company, L.L.C., one of our wholly-owned subsidiaries, owns the Navajo Refinery. The Navajo
Refinery has a crude capacity of 85,000 BPSD of sour and sweet crude oils, can process up to approximately 90%
sour crude oils, and serves markets in the southwestern United States and northern Mexico. Our Woods Cross
Refinery, located just north of Salt Lake City, Utah has a crude capacity of 26,000 BPSD and is operated by Holly
Refining & Marketing Company – Woods Cross, one of our wholly-owned subsidiaries. This facility is a high
conversion refinery that processes regional sweet and Canadian sour crude oils. In conjunction with the refining
operations, we own approximately 900 miles of crude oil pipelines that serve primarily as the supply network for our
New Mexico refinery operations that we have agreed to sell to HEP as discussed above.
On March 31, 2006 we sold our petroleum refinery in Great Falls, Montana (the “Montana Refinery”) to a
subsidiary of Connacher Oil and Gas Limited (“Connacher”). Accordingly, the results of operations of the Montana
Refinery and a net gain of $14.0 million on the sale are shown in discontinued operations.
Our operations are currently organized into one business segment, Refining. The Refining business segment
includes the Navajo Refinery, Woods Cross Refinery and Holly Asphalt Company. Prior to our deconsolidation of
HEP on July 1, 2005 our operations were organized into two business segments, which were Refining and HEP.
Our operations that are not included in either the Refining or HEP (prior to its deconsolidation) business segments
include the operations of Holly Corporation, the parent company, a small-scale oil and gas exploration and
production program, and prior to the deconsolidation of HEP, the elimination of the revenue and costs associated
with HEP’s pipeline transportation services for us as well as the recognition of the minority interests’ income of
HEP.
REFINERY OPERATIONS
Our refinery operations include the Navajo Refinery and the Woods Cross Refinery. The following table sets forth
information, including performance measures about our refinery operations that are not calculations based upon U.S.
generally accepted accounting principles (“GAAP”). The cost of products and refinery gross margin do not include
the effect of depreciation, depletion and amortization. Reconciliations to amounts reported under GAAP are
provided under “Reconciliations to Amounts Under Generally Accepted Accounting Principles” following Item 7A
of Part II of this Form 10-K. Information regarding our individual refineries is provided later under this section of
“Refinery Operations.”
Years Ended December 31,
2007 2006 2005
Consolidated (7)
Crude charge (BPD) (1) .................................................................................... 103,490 96,570 95,950
Refinery production (BPD) (2) ......................................................................... 113,270 105,730 106,040
Sales of produced refined products (BPD) ...................................................... 115,050 105,090 106,500
Sales of refined products (BPD) (3) .................................................................. 126,800 119,870 117,110
Refinery utilization (4) ...................................................................................... 94.1% 92.4% 95.0%
Average per produced barrel (5)
Net sales ...................................................................................................... $ 89.77 $ 80.21 $ 69.12
Cost of products .......................................................................................... 73.03 64.43 56.50
Refinery gross margin ................................................................................. 16.74 15.78 12.62
Refinery operating expenses (6) ................................................................... 4.43 4.83 4.11
Net operating margin................................................................................... $ 12.31 $ 10.95 $ 8.51
-8-
15. Years Ended December 31,
2007 2006 2005
Feedstocks:
Sour crude oil .............................................................................................. 62% 61% 67%
Sweet crude oil............................................................................................ 26% 28% 21%
Other feedstocks and blends........................................................................ 12% 11% 12%
Total ............................................................................................................ 100% 100% 100%
(1) Crude charge represents the barrels per day of crude oil processed at the crude units at our refineries.
(2) Refinery production represents the barrels per day of refined products yielded from processing crude and other refinery
feedstocks through the crude units and other conversion units at our refineries.
(3) Includes refined products purchased for resale.
(4) Represents crude charge divided by total crude capacity (BPSD). Our consolidated crude capacity was increased from
101,000 BPSD to 109,000 BPSD during 2006 and by an additional 2,000 BPSD in mid-year 2007, increasing our
consolidated crude capacity to 111,000 BPSD.
(5) Represents average per barrel amount for produced refined products sold, which is a non-GAAP measure.
Reconciliations to amounts reported under GAAP are provided under “Reconciliations to Amounts Reported Under
Generally Accepted Accounting Principles” following Item 7A of Part II of this Form 10-K.
(6) Represents operating expenses of our refineries, exclusive of depreciation, depletion and amortization.
(7) The Montana Refinery was sold on March 31, 2006. Amounts reported are for the Navajo and Woods Cross Refineries.
The petroleum refining business is highly competitive. Among our competitors are some of the world’s largest
integrated petroleum companies, which have their own crude oil supplies and distribution and marketing systems.
We also compete with other independent refiners. Competition in a particular geographic area is affected primarily
by the amount of refined products produced by refineries located in that area and by the availability of refined
products and the cost of transportation to that area from refineries located outside the area. Projects have been
explored from time to time by refiners and other entities which projects, if completed, could result in further
increases in the supply of products to some or all of our markets. In recent years, there have been several refining
and marketing consolidations or acquisitions between competitors in our geographic markets. These transactions
could increase future competitive pressures on us.
Set forth below is information regarding our principal products.
Years Ended December 31,
2007 2006 2005
Consolidated
Sales of produced refined products:
Gasolines ..................................................................................................... 60% 61% 59%
Diesel fuels.................................................................................................. 29% 28% 27%
Jet fuels........................................................................................................ 2% 3% 4%
Fuel oil ........................................................................................................ 4% 3% 2%
Asphalt ........................................................................................................ 2% 2% 4%
LPG and other ............................................................................................. 3% 3% 4%
Total ............................................................................................................ 100% 100% 100%
We have several significant customers, none of which accounts for more than 10% of our business. Our principal
customers for gasoline include other refiners, convenience store chains, independent marketers, an affiliate of
Petróleos Mexicanos (“PEMEX”), the government-owned energy company of Mexico, and retailers. Diesel fuel is
sold to other refiners, truck stop chains, wholesalers and railroads. Jet fuel is sold for military and domestic airline
use. Asphalt is sold to governmental entities or contractors. LPG’s are sold to LPG wholesalers and LPG retailers
and carbon black oil is sold for further processing or blended into fuel oil. Loss of, or reduction in amounts
purchased by, our major customers that purchase for their retail operations could have an adverse effect on us to the
extent that, because of market limitations or transportation constraints, we are not able to correspondingly increase
sales to other purchasers.
In order to maintain or increase production levels at our refineries, we must continually enter into contracts for new
crude oil supplies. The primary factors affecting our ability to contract for new crude oil supplies are our ability to
connect new supplies of crude oil to our gathering systems or to our other crude oil receiving lines, our success in
-9-
16. contracting for and receiving existing crude oil supplies that are currently being purchased by other refineries and
the level of drilling activity near our gathering systems or our other crude oil receiving lines.
Navajo Refinery
Facilities
The Navajo Refinery has a crude oil capacity of 85,000 BPSD and has the ability to process sour crude oils into high
value light products (such as gasoline, diesel fuel and jet fuel). The Navajo Refinery converts approximately 92% of
its raw materials throughput into high value light products. For 2007, gasoline, diesel fuel and jet fuel (excluding
volumes purchased for resale) represented 59%, 30% and 3%, respectively, of the Navajo Refinery’s sales volumes.
The following table sets forth information about the Navajo Refinery operations, including non-GAAP performance
measures. The cost of products and refinery gross margin do not include the effect of depreciation, depletion and
amortization. Reconciliations to amounts reported under GAAP are provided under “Reconciliations to Amounts
Reported Under Generally Accepted Accounting Principles” following Item 7A of Part II of this Form 10-K.
Years Ended December 31,
2007 2006 2005
Navajo Refinery
Crude Charge (BPD) (1) ................................................................................... 79,460 72,930 71,850
Refinery production (BPD) (2) ........................................................................ 87,930 80,540 80,190
Sales of produced refined products (BPD) ...................................................... 88,920 79,940 80,110
Sales of refined products (BPD) (3) .................................................................. 100,460 93,660 89,400
Refinery utilization (4) ...................................................................................... 94.6% 92.9% 95.8%
Average per produced barrel (5)
Net sales ...................................................................................................... $ 89.68 $ 79.62 $ 69.11
Cost of products........................................................................................... 74.10 64.25 55.50
Refinery gross margin ................................................................................. 15.58 15.37 13.61
Refinery operating expenses (6).................................................................... 4.30 4.74 3.94
Net operating margin................................................................................... $ 11.28 $ 10.63 $ 9.67
Feedstocks:
Sour crude oil............................................................................................... 82% 80% 85%
Sweet crude oil ............................................................................................ 9% 8% 2%
Other feedstocks and blends ........................................................................ 9% 12% 13%
Total............................................................................................................. 100% 100% 100%
(1) Crude charge represents the barrels per day of crude oil processed at the crude units at our refinery.
(2) Refinery production represents the barrels per day of refined products yielded from processing crude and other refinery
feedstocks through the crude units and other conversion units at the refinery.
(3) Includes refined products purchased for resale.
(4) Represents crude charge divided by total crude capacity (BPSD). The crude capacity was increased from 75,000 BPSD
to 83,000 BPSD during 2006 and by an additional 2,000 BPSD in mid-year 2007, increasing crude capacity to 85,000
BPSD.
(5) Represents average per barrel amount for produced refined products sold, which is a non-GAAP measure.
Reconciliations to amounts reported under GAAP are provided under “Reconciliations to Amounts Reported Under
Generally Accepted Accounting Principles” following Item 7A of Part II of this Form 10-K.
(6) Represents operating expenses of the refinery, exclusive of depreciation, depletion and amortization.
The Navajo Refinery’s Artesia, New Mexico facility is located on a 561 acre site and is a fully integrated refinery
with crude distillation, vacuum distillation, FCC, ROSE (solvent deasphalter), HF alkylation, catalytic reforming,
hydrodesulfurization, isomerization, sulfur recovery and product blending units. Other supporting infrastructure
includes approximately 2.0 million barrels of feedstock and product tankage at the site, maintenance shops,
warehouses and office buildings. The operating units at the Artesia facility include newly constructed units, older
units that have been relocated from other facilities and upgraded and re-erected in Artesia, and units that have been
operating as part of the Artesia facility (with periodic major maintenance) for many years, in some very limited
cases since before 1970. The Artesia facility is operated in conjunction with an integrated refining facility located in
-10-
17. Lovington, New Mexico, approximately 65 miles east of Artesia. The principal equipment at the Lovington facility
consists of a crude distillation and associated vacuum distillation units which were originally constructed after 1970.
The facility also has an additional 1.1 million barrels of feedstock and product tankage. The Lovington facility
processes crude oil into intermediate products, which are transported to Artesia by means of two intermediate
pipelines owned by HEP and which are then upgraded into finished products at the Artesia facility. The combined
crude oil capacity of the two facilities is 85,000 BPSD and typically processes or blends an additional 10,000 BPSD
of natural gasoline, butane, gas oil and naphtha.
We have approximately 900 miles of crude gathering pipelines transporting crude oil to the Artesia and Lovington
facilities from various points in southeastern New Mexico and west Texas, 67 crude oil trucks and 67 trailers in
addition to over 600,000 barrels of related tankage.
We distribute refined products from the Navajo Refinery to markets in Arizona, New Mexico and west Texas
primarily through two of HEP’s owned pipelines that extend from Artesia, New Mexico to El Paso, Texas. In
addition, we use pipelines owned and leased by HEP to transport petroleum products to markets in central and
northwest New Mexico. We have refined product storage through our pipelines and terminals agreement with HEP
at terminals in El Paso, Texas; Tucson, Arizona; and Artesia, Moriarty and Bloomfield, New Mexico.
We manufacture and market commodity and modified asphalt products in Arizona, New Mexico, Texas and
northern Mexico under Holly Asphalt Company (“Holly Asphalt”). We have three manufacturing facilities located
in Glendale, Arizona, Albuquerque, New Mexico and Artesia, New Mexico. Our Albuquerque and Artesia facilities
manufacture modified hot asphalt products and commodity emulsions from base asphalt materials provided by our
Navajo refinery and third party suppliers. Our Glendale facility manufactures modified hot asphalt products from
base asphalt materials provided by our Navajo and Woods Cross Refineries and third party suppliers. Our products
are shipped via third party trucking companies to commercial customers that provide asphalt based materials for
commercial and government projects.
Markets and Competition
The Navajo Refinery primarily serves the growing southwestern United States market, including El Paso, Texas;
Albuquerque, Moriarty and Bloomfield, New Mexico; Phoenix and Tucson, Arizona; and the northern Mexico
market. Our products are shipped through HEP’s pipelines from Artesia, New Mexico to El Paso, Texas and from
El Paso to Albuquerque and to Mexico via products pipeline systems owned by Plains All American Pipeline, L.P.
(“Plains”) and from El Paso to Tucson and Phoenix via a products pipeline system owned by Kinder Morgan’s
SFPP, L.P. (“SFPP”). In addition, the Navajo Refinery transports petroleum products to markets in northwest New
Mexico and to Moriarty, New Mexico, near Albuquerque, via HEP’s pipelines running from Artesia to San Juan
County, New Mexico.
El Paso Market
The El Paso market for refined products is currently supplied by a number of area refiners, gulf coast refiners and
pipelines. Area refiners include Navajo, ConocoPhillips, Valero, Alon, and Western Refining. Pipelines serving
this market include Longhorn, Magellan, NuStar and HEP pipelines. Refined products from the gulf coast are
transported via the Longhorn and Magellan pipelines. We currently supply approximately 11,000 BPD to the El
Paso market, which accounts for approximately 18% of the refined products consumed in that market.
Arizona Market
The Arizona market for refined products is currently supplied by a number of refiners via pipelines and trucks.
Refiners include companies located in west Texas, eastern New Mexico, northern New Mexico, the gulf coast and
west coast. We currently supply approximately 47,000 BPD of refined products into the Arizona market, comprised
primarily of Phoenix and Tucson, which accounts for approximately 16% of the refined products consumed in that
market.
We use Kinder Morgan’s SFPP pipeline to serve the Arizona market. In December 2007, Kinder Morgan completed
an expansion of its El Paso, Texas to Tucson and Phoenix, Arizona pipeline, increasing its capacity to approximately
200,000 BPD. Although we expect that we and other refiners will ship additional volumes of refined product via
this pipeline, we cannot presently predict the ultimate effects on us.
-11-
18. New Mexico Markets
The Artesia, Albuquerque, Moriarty and Bloomfield markets are supplied by a number of refiners via pipelines and
trucks. Refiners include Navajo, Valero, Western, Alon and ConocoPhillips. We currently supply approximately
21,000 BPD of refined products to the New Mexico market, which accounts for approximately 20% of the refined
products consumed in that market.
The common carrier pipeline we use to serve the Albuquerque market out of El Paso currently operates at near
capacity. In addition, HEP leases from Mid-America Pipeline Company, L.L.C., a pipeline between White Lakes,
New Mexico and the Albuquerque vicinity and Bloomfield, New Mexico (the “Leased Pipeline”). The lease
agreement currently runs through 2017, and HEP has options to renew for two ten-year periods. HEP owns and
operates a 12-inch pipeline from the Navajo Refinery to the Leased Pipeline as well as terminalling facilities in
Bloomfield, New Mexico, which is located in the northwest corner of New Mexico, and in Moriarty, which is 40
miles east of Albuquerque. These facilities permit us to provide a total of up to 45,000 BPD of light products to the
growing Albuquerque and Santa Fe, New Mexico areas. If needed, additional pump stations could further increase
the Leased Pipeline’s capabilities.
The Longhorn Pipeline is a 72,000 BPD common carrier pipeline that delivers refined products utilizing a direct
route from the Texas Gulf Coast to El Paso and, through interconnections with third-party common carrier pipelines,
into the Arizona market. Deliveries of refined products shipped on the Longhorn Pipeline increased significantly
during 2007, and we believe the Longhorn Pipeline is currently operating at near full capacity. Longhorn Partners
Pipeline, L.P., owner of the Longhorn Pipeline, has also announced a planned expansion of its pipeline throughput
capacity from 72,000 BPD to 125,000 BPD.
An additional factor that could affect some of our markets is the presence of pipeline capacity from El Paso and the
West Coast into our Arizona markets. Additional increases in shipments of refined products from El Paso and the
West Coast into our Arizona markets could result in additional downward pressure on refined product prices in these
markets.
Crude Oil and Feedstock Supplies
The Navajo Refinery is situated near the Permian Basin in an area which historically has had abundant supplies of
crude oil available both for regional users, such as us, and for export to other areas. We purchase crude oil from
producers in nearby southeastern New Mexico and west Texas and from major oil companies. Crude oil is gathered
both through our pipelines and tank trucks and through third party crude oil pipeline systems. Crude oil acquired in
locations distant from the refinery is exchanged for crude oil that is transportable to the refinery.
We also purchase isobutane, natural gasoline, and other feedstocks to supply the Navajo Refinery. In 2007,
approximately 4,500 BPD of isobutane and 4,100 BPD of natural gasoline used in the Navajo Refinery’s operations
were purchased from a newly operational fractionation facility in Hobbs, New Mexico, that is owned by Enterprise
Products, L.P. as well as volumes purchased from the mid-continent area and delivered to our region on a common
carrier pipeline owned by Enterprise Products, L.P. Ultimately all volumes of these products are shipped to the
Artesia refining facilities on HEP’s two parallel 65-mile pipelines running from Lovington to Artesia. From time to
time, we also purchase gas oil, naphtha and light cycle oil from other oil companies for use as feedstock.
Principal Products and Customers
Set forth below is information regarding the principal products produced at the Navajo Refinery:
Years Ended December 31,
2007 2006 2005
Navajo Refinery
Sales of produced refined products:
Gasolines ..................................................................................................... 59% 60% 59%
Diesel fuels .................................................................................................. 30% 28% 27%
Jet fuels........................................................................................................ 3% 4% 4%
Fuel oil......................................................................................................... 3% 2% -%
Asphalt......................................................................................................... 2% 3% 6%
LPG and other.............................................................................................. 3% 3% 4%
Total............................................................................................................. 100% 100% 100%
-12-
19. Light products are shipped by product pipelines or are made available at various points by exchanges with others.
Light products are also made available to customers through truck loading facilities at the refinery and at terminals.
Our principal customers for gasoline include other refiners, convenience store chains, independent marketers, an
affiliate of PEMEX and retailers. Our gasoline produced at the Navajo Refinery is marketed in the southwestern
United States, including the metropolitan areas of El Paso, Phoenix, Albuquerque, Bloomfield, and Tucson, and in
portions of northern Mexico. The composition of gasoline differs, because of local regulatory requirements,
depending on the area in which gasoline is to be sold. Diesel fuel is sold to other refiners, truck stop chains,
wholesalers, and railroads. Jet fuel is sold for military use. All asphalt produced at the Navajo Refinery and third-
party purchased asphalt is marketed through Holly Asphalt to governmental entities or contractors. LPG’s are sold
to LPG wholesalers and LPG retailers and carbon black oil is sold for further processing.
Military jet fuel is sold to the Defense Energy Support Center, a part of the United States Department of Defense
(the “DESC”), under a series of one-year contracts that can vary significantly from year to year. We sold
approximately 800 BPD of jet fuel to the DESC in 2007. We have had a military jet fuel supply contract with the
United States Government for each of the last 38 years. Our size in terms of employees and refining capacity allows
us to bid for military jet fuel sales contracts under a small business set-aside program. In September 2007, the
DESC awarded us contracts for sales of military jet fuel for the period from October 1, 2007 through September 30,
2008. Our total contract award, which is subject to adjustment based on actual needs of the DESC for military jet
fuel, is approximately 22 million gallons as compared to the total award for the 2006-2007 contract year of
approximately 52 million gallons. The loss of or further reduction of quantities of jet fuel provided under our
military jet fuel contract with the United States Government could have an adverse effect on our results of
operations if alternate commercial jet fuel or additional diesel fuel sales could not be secured.
Capital Improvement Projects
We have invested significant amounts in capital expenditures in recent years to expand and enhance the Navajo
Refinery and expand our supply and distribution network.
Our Board of Directors approved a capital budget for 2008 of $21.0 million for refining improvement projects for
the Navajo Refinery, not including the capital projects approved in prior years or our expansion and feedstock
flexibility projects described below.
As announced in December 2006 we will be installing a new 15,000 BPD hydrocracker and a new 28 MMSCFD
hydrogen plant at a budgeted cost of approximately $125.0 million. The addition of these units is expected to
increase liquid volume recovery, increase the refinery’s capacity to process outside feedstocks, and increase yields
of high valued products, as well as enabling the refinery to meet new low sulfur gasoline specifications required by
the Environmental Protection Agency (“EPA”). The hydrocracker and hydrogen plant projects will provide
improved heavy crude oil processing flexibility.
As announced in February 2007, we are revamping an existing crude unit which will increase the crude capacity at
the Navajo Refinery to approximately 100,000 BPD. Additionally, our Board of Directors has approved a revamp
of its second crude unit and a new solvent de-asphalter unit. The approved components, combined with the above
described components approved in 2006, bring the total budgeted amount for this expansion and heavy crude oil
processing project to $245.0 million. It is currently anticipated that the expansion portion of the overall project
consisting of the initial crude unit revamp, the new hydrocracker and the new hydrogen plant will be completed and
operational by the first quarter of 2009. The completion of the heavy crude oil processing portion of the overall
project, including the second crude unit revamp and the installation of the new solvent de-asphalter, will be targeted
to coincide with the development of future pipeline access to the Navajo Refinery for heavy Canadian crude oil and
other foreign heavy crude oils transported from the Cushing, Oklahoma area. We plan to explore with HEP the most
economical manner to obtain this needed pipeline access.
Also at the Navajo Refinery, a project to install an additional 100 ton per day sulfur recovery unit included in the
2006 capital budget is currently underway at an estimated cost of $26.0 million, of which we have spent
approximately $10.0 million to date. This new sulfur recovery unit will permit our Navajo Refinery to process
100% sour crude and is planned for start-up in the third quarter of 2008. It is anticipated that the projects that will
-13-
20. be completed by the fourth quarter of 2008 will also enable the Navajo Refinery, without significant additional
investment, to comply with LSG specifications required by the end of 2010.
Woods Cross Refinery
Facilities
The Woods Cross Refinery has a crude oil capacity of 26,000 BPSD and is operated by Holly Refining & Marketing
Company – Woods Cross, one of our wholly owned subsidiaries. The Woods Cross Refinery is located in Woods
Cross, Utah and processes regional sweet and black wax crude as well as Canadian sour crude oils into high value
light products. For 2007, gasoline, diesel and jet fuel (excluding volumes purchased for resale) represented 63%,
27% and 2%, respectively, of the Woods Cross Refinery’s sales volumes.
The following table sets forth information about the Woods Cross Refinery operations, including non-GAAP
performance measures about our refinery operations. The cost of products and refinery gross margin do not include
the effect of depreciation, depletion and amortization. Reconciliations to amounts reported under GAAP are
provided under “Reconciliations to Amounts Under Generally Accepted Accounting Principles” following Item 7A
of Part II of this Form 10-K.
Years Ended December 31,
2007 2006 2005
Woods Cross Refinery
Crude Charge (BPD) (1).................................................................................... 24,030 23,640 24,100
Refinery production (BPD) (2) ........................................................................ 25,340 25,190 25,850
Sales of produced refined products (BPD) ...................................................... 26,130 25,150 26,390
Sales of refined products (BPD) (3) .................................................................. 26,340 26,210 27,710
Refinery utilization (4) ...................................................................................... 92.4% 90.9% 92.7%
Average per produced barrel (5)
Net sales..................................................................................................... $ 90.09 $ 82.09 $ 69.13
Cost of products ......................................................................................... 69.40 64.99 59.51
Refinery gross margin................................................................................ 20.69 17.10 9.62
Refinery operating expenses (6) .................................................................. 4.86 5.13 4.61
Net operating margin ................................................................................. $ 15.83 $ 11.97 $ 5.01
Feedstocks:
Sour crude oil............................................................................................. 3% 2% 8%
Sweet crude oil .......................................................................................... 89% 89% 82%
Other feedstocks and blends ...................................................................... 8% 9% 10%
Total........................................................................................................... 100% 100% 100%
(1) Crude charge represents the barrels per day of crude oil processed at the crude units at our refinery.
(2) Refinery production represents the barrels per day of refined products yielded from processing crude and other
feedstocks through the crude units and other conversion units at the refinery.
(3) Includes refined products purchased for resale.
(4) Represents crude charge divided by total crude capacity (BPSD).
(5) Represents average per barrel amount for produced refined products sold, which is a non-GAAP measure.
Reconciliations to amounts reported under GAAP are provided under “Reconciliations to Amounts Reported Under
Generally Accepted Accounting Principles” following Item 7A of Part II of this Form 10-K.
(6) Represents operating expenses of the refinery, exclusive of depreciation, depletion and amortization.
The Woods Cross Refinery facility is located on a 200 acre site and is a fully integrated refinery with crude
distillation, solvent deasphalter, FCC, HF alkylation, catalytic reforming, hydrodesulfurization, isomerization, sulfur
recovery, and product blending units. Other supporting infrastructure includes approximately 1.5 million barrels of
feedstock and product tankage, maintenance shops, warehouses and office buildings. The operating units at the
Woods Cross facility include newly constructed units, older units that have been relocated from other facilities,
upgraded and re-erected in Woods Cross, and units that have been operating as part of the Woods Cross facility
(with periodic major maintenance) for many years, in some very limited cases since before 1950. The crude oil
-14-
21. capacity of the Woods Cross facility is 26,000 BPSD and the facility typically processes or blends an additional
2,000 BPSD of natural gasoline, butane, and gas oil.
We operate 14 miles of crude, refined products and hydrogen pipelines that allow us to connect our Woods Cross
Refinery to common carrier pipeline systems and to a hydrogen plant located at Chevron’s Salt Lake City Refinery.
Markets and Competition
The Woods Cross Refinery is one of five refineries located in Utah. We estimate that the four refineries that
compete with our Woods Cross Refinery have a combined capacity to process approximately 146,000 BPD of crude
oil. The five Utah refineries collectively supply an estimated 70% of the gasoline and distillate products consumed
in the states of Utah and Idaho, with the remainder imported from refineries in Wyoming and Montana via the
Pioneer Pipeline owned jointly by Sinclair and ConocoPhillips (the Pioneer Pipeline”). The Woods Cross
Refinery’s primary markets include Utah, Idaho, Nevada and Wyoming. Approximately 60% of the gasoline and
diesel fuel produced by our Woods Cross Refinery is sold through a network of Phillip 66 branded marketers under
a long-term supply agreement.
Utah Market
The Utah market for refined products is currently supplied primarily by a number of local refiners and the Pioneer
Pipeline. Local area refiners include Woods Cross, Chevron, Tesoro, Big West and Silver Eagle. Other refiners that
ship via the Pioneer Pipeline include Sinclair, ExxonMobil and ConocoPhillips. We currently supply approximately
18,000 BPD of refined products into the Utah market, which represents approximately 15% of the refined products
consumed in that market, to branded and unbranded customers.
Idaho, Wyoming, Eastern Washington and Nevada Markets
We currently supply approximately 7,500 BPD of refined products into the Idaho, Wyoming, Eastern Washington
and Nevada markets, which represents approximately 2% of the refined products consumed in those markets.
Woods Cross ships refined products over Chevron’s common carrier pipeline system to numerous terminals,
including HEP’s terminals at Boise and Burley, Idaho and Spokane, Washington and to terminals at Pocatello and
Boise, Idaho and Pasco, Washington which are owned by Northwest Terminalling Pipeline Company. We sell to
branded and unbranded customers in these markets. We also truck refined products to Las Vegas, Nevada.
The Idaho market for refined products is primarily supplied via Chevron’s common carrier pipeline system from
refiners located in the Salt Lake City area and products supplied from the Pioneer Pipeline system. Refiners that
could potentially supply the Chevron and Pioneer pipeline systems include Woods Cross, Chevron, Tesoro, Big
West, Silver Eagle, Sinclair, ConocoPhillips and ExxonMobil.
We market refined products in the Wyoming market on a limited basis. Refiners that supply Wyoming include
Sinclair, ConocoPhillips, ExxonMobil and Frontier.
The Eastern Washington market is supplied by two common carrier pipelines, Chevron and Yellowstone. Product is
also shipped into the area via rail from various points in the United States and Canada. Refined products shipped on
Chevron’s pipeline system are supplied by refiners and other pipelines located in the Salt Lake City area and from
refiners located in the Pacific Northwest. Pacific Northwest refiners include BP, Tesoro, Shell, ConocoPhillips and
US Oil. Products supplied from the sources located in the Pacific Northwest area are generally shipped over the
Columbia River via barge at Pasco, Washington.
The majority of the Las Vegas, Nevada market for refined products is supplied by various West Coast refiners and
suppliers via Kinder Morgan’s CalNev common carrier pipeline system.
-15-
22. Principal Products and Customers
Set forth below is information regarding the principal products produced at the Woods Cross Refinery:
Years Ended December 31,
2007 2006 2005
Woods Cross Refinery
Sales of produced refined products:
Gasolines ...................................................................................................... 63% 63% 60%
Diesel fuels ................................................................................................... 27% 28% 29%
Jet fuels ......................................................................................................... 2% 2% 2%
Fuel oil.......................................................................................................... 5% 5% 7%
Asphalt.......................................................................................................... 1% -% -%
LPG and other............................................................................................... 2% 2% 2%
Total.............................................................................................................. 100% 100% 100%
Light products are shipped by product pipelines or are made available at various points by exchanges with others.
Light products are also made available to customers through truck loading facilities at the refinery and at terminals.
Our principal customers for gasoline include other refiners, convenience store chains, independent marketers and
retailers. The composition of gasoline differs, due to local regulatory requirements, depending on the area in which
gasoline is to be sold. Diesel fuel is sold to other refiners, truck stop chains, and wholesalers. Jet fuel is sold for
military and domestic airline use. All asphalt produced is blended to fuel oil and sold locally, railed to the gulf
coast, railed directly to our customers or marketed through Holly Asphalt Company to governmental entities or
contractors. LPG’s are sold to LPG wholesalers and LPG retailers.
Military jet fuel is sold to the DESC under a series of one-year contracts that can vary significantly from year to
year. We sold approximately 100 BPD of jet fuel to the DESC in 2007. Our size in terms of employees and refining
capacity allows us to bid for military jet fuel sales contracts under a small business set-aside program. We did not
obtain a contract with the DESC for the October 1, 2007 through September 30, 2008 period. Our total contract
award for the 2006-2007 contract year was approximately 8 million gallons.
Crude Oil and Feedstock Supplies
The Woods Cross Refinery currently obtains its supply of crude oil primarily from suppliers in Canada, Wyoming,
Utah and Colorado via common carrier pipelines, which originate in Canada, Wyoming and Colorado. Supplies of
black wax crude oil are shipped via truck.
Capital Improvement Projects
Our approved capital budget for 2008 capital projects at the Woods Cross Refinery is $7.7 million not including the
major projects described below or other capital projects approved in prior years. As announced in December 2006,
we will be adding a new 15,000 BPD hydrocracker along with sulfur recovery and desalting equipment at our
Woods Cross Refinery. The budgeted cost of these additions is approximately $105.0 million. These additions will
expand the Woods Cross Refinery’s crude processing capabilities from 26,000 BPD to 31,000 BPD while enabling
the refinery to process up to 10,000 BPD of high-value low-priced black wax crude oil and up to 5,000 BPD of low-
priced heavy Canadian crude oils. This expansion project as approved involves a higher capital investment than had
originally been estimated, principally because of the substitution of a complex hydrocracker in place of certain
desulfurization and expanded bottoms-processing modifications that had been included in preliminary planning.
The substitution of the complex hydrocracker is expected to provide increased capabilities to process significantly
more black wax crude oils, which have recently been priced at substantial discounts to West Texas Intermediate
crude oil while yielding substantially higher value products than the discounted heavy Canadian crudes that were a
more significant part of the original plan. These additions would also increase the refinery’s capacity to process
low-cost feedstocks and provide the necessary infrastructure for future expansions of crude oil refining capacity at
the Woods Cross Refinery. The approved projects for the Woods Cross refinery are expected to be completed
during the fourth quarter of 2008.
To fully take advantage of the economics on the Woods Cross expansion project, additional crude pipeline capacity
will be required to move Canadian crude to the Woods Cross Refinery. In November 2007, HEP entered into an
-16-