Call US 📞 9892124323 ✅ Kurla Call Girls In Kurla ( Mumbai ) secure service
allstate Quarter Information 2007 2nd
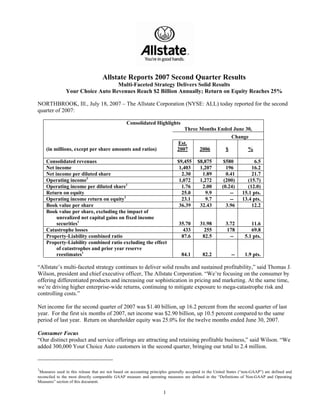
1. Allstate Reports 2007 Second Quarter Results
Multi-Faceted Strategy Delivers Solid Results
Your Choice Auto Revenues Reach $2 Billion Annually; Return on Equity Reaches 25%
NORTHBROOK, Ill., July 18, 2007 – The Allstate Corporation (NYSE: ALL) today reported for the second
quarter of 2007:
Consolidated Highlights
Three Months Ended June 30,
Change
Est.
(in millions, except per share amounts and ratios) 2007 2006 $ %
Consolidated revenues $9,455 $8,875 $580 6.5
Net income 1,403 1,207 196 16.2
Net income per diluted share 2.30 1.89 0.41 21.7
Operating income1 1,072 1,272 (200) (15.7)
Operating income per diluted share1 1.76 2.00 (0.24) (12.0)
Return on equity 25.0 9.9 -- 15.1 pts.
Operating income return on equity1 23.1 9.7 -- 13.4 pts.
Book value per share 36.39 32.43 3.96 12.2
Book value per share, excluding the impact of
unrealized net capital gains on fixed income
securities1 35.70 31.98 3.72 11.6
Catastrophe losses 433 255 178 69.8
Property-Liability combined ratio 87.6 82.5 -- 5.1 pts.
Property-Liability combined ratio excluding the effect
of catastrophes and prior year reserve
reestimates1 -- 1.9 pts.
84.1 82.2
“Allstate’s multi-faceted strategy continues to deliver solid results and sustained profitability,” said Thomas J.
Wilson, president and chief executive officer, The Allstate Corporation. “We’re focusing on the consumer by
offering differentiated products and increasing our sophistication in pricing and marketing. At the same time,
we’re driving higher enterprise-wide returns, continuing to mitigate exposure to mega-catastrophe risk and
controlling costs.”
Net income for the second quarter of 2007 was $1.40 billion, up 16.2 percent from the second quarter of last
year. For the first six months of 2007, net income was $2.90 billion, up 10.5 percent compared to the same
period of last year. Return on shareholder equity was 25.0% for the twelve months ended June 30, 2007.
Consumer Focus
“Our distinct product and service offerings are attracting and retaining profitable business,” said Wilson. “We
added 300,000 Your Choice Auto customers in the second quarter, bringing our total to 2.4 million.
1
Measures used in this release that are not based on accounting principles generally accepted in the United States (“non-GAAP”) are defined and
reconciled to the most directly comparable GAAP measure and operating measures are defined in the “Definitions of Non-GAAP and Operating
Measures” section of this document.
1
2. Revenues for Your Choice Auto reached $2 billion annually. Overall, Allstate standard auto showed positive
growth in the quarter and the renewal ratio remains at nearly 90 percent.”
Profitability
“We are driving profitable growth in the competitive auto insurance business, while mitigating our exposure
to mega-catastrophes in higher-risk geographic areas. While operating income declined due largely to
increased reinsurance and catastrophe costs, the underlying run-rate of our business continues in line with our
expectations.”
Allstate’s Property-Liability combined ratio, excluding the effect of catastrophes and prior year reserve
reestimates, in the second quarter of 2007 was 84.1, which was at the favorable end of our expectations for
2007.
Allstate Financial net income reached a record $200 million for the quarter. The business unit generated $154
million of operating income for the quarter and continues to make steady progress in elevating returns.
Allstate’s investment portfolios generated strong results, with net investment income up 5.6% over the prior
year quarter. In total, investments generated capital gains of $545 million for the quarter and more than $1
billion for the first six months of 2007.
Capital Management
“Attractive capital management is an important component of our strategy,” said Wilson. “During the second
quarter of 2007, we completed an offering of hybrid securities and expanded our stock repurchase program.
We also continued to mitigate exposure to mega-catastrophes by completing our reinsurance program in
Florida and acquiring reinsurance protection for several Northeast states through the issuance of a catastrophe
bond.”
During the quarter, Allstate repurchased $1.5 billion of outstanding common stock representing 24.3 million
shares, including shares as part of a $500 million accelerated stock repurchase agreement. As of June 30,
2007, $1.6 billion remains under the repurchase program’s current $4 billion authorization. The program is
expected to be completed by the end of the first quarter of 2008.
People
“Our people are our most important resource. We continue to invest in initiatives designed to increase
employee talent, engagement and commitment. In fact, nearly 20,000 employees have voluntarily enrolled in
Well & Fit, our new program to enhance health, well-being and productivity.”
Outlook
“Allstate’s multi-faceted, competitive business strategy continues to deliver market-leading products and
services to our customers and strong returns for our shareholders. We expect that the Property-Liability
combined ratio, excluding the effect of catastrophes and assuming no prior year reserve reestimates, will be
within the range of 84.0 and 86.0 in 2007,” concluded Wilson.
BUSINESS HIGHLIGHTS
Property-Liability
• Property-Liability premiums written1 declined 1.9% from the second quarter of 2006, reflecting the increased
cost of the Allstate Protection catastrophe reinsurance program and other catastrophe management actions.
The cost of the catastrophe reinsurance program was $231 million in the second quarter of 2007 compared to
$114 million in the second quarter of last year. Excluding the cost of the catastrophe reinsurance program,
premiums written decreased 0.3% in the second quarter of 2007 when compared to the prior year quarter, as
higher standard auto premiums were offset by lower homeowner premiums.
2
3. • Allstate brand standard auto premiums written grew 2.1% in the second quarter of 2007 compared to the prior
year quarter. Contributing to the overall change were the following:
- 2.0% increase in policies in force (“PIF”)
- 0.3 point decline in the renewal ratio to 89.9%
- 0.2% increase in six month average premium to $421
- 4.8% decrease in new issued applications
For the three months For the six months
(in thousands) ended June 30, ended June 30,
Est. % Est. %
2007 2006 Change 2007 2006 Change
Hurricane Exposure States2 252 265 (4.9) 521 520 0.2
California 75 81 (7.4) 161 162 (0.6)
All other states 152 157 (3.2) 323 311 3.9
479 503 (4.8) 1,005 993 1.2
Standard auto new issued applications
2
Hurricane exposure states are Alabama, Connecticut, Delaware, Florida, Georgia, Louisiana, Maine, Maryland,
Mississippi, New Hampshire, New Jersey, New York, North Carolina, Pennsylvania, Rhode Island, South Carolina,
Texas, Virginia and Washington D.C.
• Allstate brand homeowners premiums written declined 4.8% in the second quarter of 2007 compared to the
prior year quarter due to our catastrophe risk management actions. Excluding the cost of the catastrophe
reinsurance program, Allstate brand homeowners premiums written increased 0.6% in the second quarter of
2007 when compared to the prior year quarter. Contributing to the overall change were the following:
- 1.4% decrease in PIF
- 0.2 point increase in the renewal ratio to 87.3%
- 2.8% increase in twelve month average premium to $851. Average premium is calculated using
premiums written before reinsurance
- 16.5% decrease in new issued applications
For the three months For the six months
(in thousands) ended June 30, ended June 30,
Est. % Est. %
2007 2006 Change 2007 2006 Change
Hurricane Exposure States2 101 127 (20.5) 198 241 (17.8)
California 11 14 (21.4) 22 30 (26.7)
All other states 110 125 (12.0) 211 232 (9.1)
222 266 (16.5) 431 503 (14.3)
Homeowners new issued applications
• We completed our 2007 catastrophe reinsurance program during the second quarter with the acquisition of
additional coverage for hurricane catastrophe losses in New York, New Jersey and Connecticut and four new
agreements for our exposure in Florida.
For detailed information on our Allstate Protection catastrophe reinsurance program see:
http://media.corporate-ir.net/media_files/IROL/93/93125/reports/ALL_Q207reinsurance.pdf
• Standard auto property damage gross claim frequency increased 2.3% compared to the second quarter of
2006, while bodily injury gross claim frequency decreased 2.2%. Auto property damage and bodily injury
paid severities increased 1.1% and 6.2%, respectively. The Allstate brand standard auto loss ratio increased
0.4 points compared to the second quarter of last year to 63.5 in the second quarter of 2007.
• Homeowner gross claim frequency excluding catastrophes increased 12.9% compared to the second quarter of
2006. Homeowners severity excluding catastrophes increased 9.8% compared to the second quarter of 2006.
3
4. The Allstate brand homeowners loss ratio increased 20.5 points to 67.7 in the second quarter of 2007.
Approximately half of the increase was due to higher catastrophes and the remainder was primarily related to
the increased cost of the catastrophe reinsurance program.
• Property-Liability prior year favorable reserve reestimates for the quarter totaled $143 million, compared to
$355 million in the second quarter of 2006. The favorable prior year reserve reestimates in the quarter
resulted primarily from auto claim severity development that was better than anticipated in previous estimates
in Allstate Protection. The decline in favorable prior year reserve reestimates in the quarter compared to the
second quarter of 2006 was primarily due to catastrophe reserve reestimates as discussed below.
• Catastrophe losses for the quarter totaled $433 million, compared to $255 million in the second quarter of
2006. This increase was partially attributable to unfavorable prior year reserve reestimates related to
catastrophes totaling $50 million in the quarter compared to favorable reserve reestimates in the second
quarter of 2006 totaling $123 million. Accordingly, excluding prior year reserve reestimates, catastrophe
losses were $383 million in the quarter compared to $378 million in the second quarter of 2006, impacting the
combined ratio by 5.6 points in the quarter and 5.5 points in the second quarter of 2006. In the quarter,
approximately half of the prior year reserve reestimates related to catastrophes was attributable to 2006 events
and the remainder was split almost equally between the hurricanes from 2005 and 2004.
• Underwriting income was $845 million during the second quarter of 2007 compared to $1.20 billion in the
same period of 2006. The decrease was primarily due to lower premiums earned resulting from a $115
million net increase in the cost of the expanded catastrophe reinsurance program, and a net change in prior
year catastrophe reserve reestimates totaling $173 million.
• The Property-Liability combined ratio was impacted by catastrophe losses and prior year reserve reestimates.
The impacts for the three months and six months ended June 30, are shown in the table below.
For the three months For the six months
ended June 30, ended June 30,
Est. Est.
2007 2006 2007 2006
Combined ratio excluding the effect of catastrophes
and prior year reserve reestimates1 84.1 82.2 84.1 82.3
Effect of catastrophe losses 6.3 3.7 4.4 2.6
(2.1) (5.2) (2.0) (4.1)
Effect of prior year reserve reestimates
Catastrophe losses included in prior year reserve
(0.7) 1.8 (0.4) 1.4
reestimates
87.6 82.5 86.1 82.2
Combined ratio (GAAP)
Allstate Financial
• Net income for the second quarter of 2007 was a record $200 million, an increase of $127 million compared
to the prior year quarter. The increase was primarily due to realized capital gains and the absence of the prior
year’s loss on disposition related to the sale of our variable annuity business.
• Operating income for the second quarter of 2007 was $154 million, a decrease of $6 million compared to
$160 million in the 2006 second quarter. The decline reflects less favorable life insurance mortality compared
to an exceptionally favorable prior year quarter which was partially offset by increased investment margin and
lower expenses.
• Deferred fixed annuity deposits in the second quarter of 2007 were $828 million (including indexed
annuities), a decrease of 57.4% from the prior year quarter but 33.3% above the first quarter of 2007. The
decrease compared to the prior year quarter is indicative of lower industry-wide fixed annuity sales and our
strategy to raise new business returns on capital for these products.
4
5. Investments
• Net investment income and realized capital gains for the second quarter of 2007 reflect the benefits of an
ongoing strategic asset allocation process, part of which has favored alternative investments in recent years.
These now comprise approximately $2.0 billion of total invested assets or 1.7% of the portfolio, an increase
of 19.9% since December 31, 2006.
• Allstate’s investment portfolios reached $122 billion as of June 30, 2007. Our investment portfolios
continued to provide strong investment results for both Property-Liability and Allstate Financial during the
second quarter as net investment income totaled $1.6 billion, a 5.6% increase over the prior year quarter.
Both business units benefited from growth in assets under management and increased portfolio yields, driven
in part by favorable experience in our limited partnership investment portfolio.
• Property-Liability net investment income increased 12.1% to $517 million, compared to the prior year
quarter. Property-Liability benefited from growth in assets under management, increased partnership income
and improving portfolio yields.
• Allstate Financial net investment income rose 2.7% to $1.08 billion, compared to the prior year quarter.
Allstate Financial benefited from growth in assets under management and increased portfolio yields,
including a favorable impact related to floating rate instruments.
• Realized capital gains were $545 million on a pre-tax basis for the quarter, primarily related to a tactical
reallocation of equity securities in the Property-Liability portfolio and favorable valuations of certain
derivatives instruments that are marked to market based on changes in equity indices.
5
6. THE ALLSTATE CORPORATION
CONSOLIDATED AND SEGMENT HIGHLIGHTS
Three Months Ended Six Months Ended
June 30, June 30,
($ in millions, except per share amounts, Est. Percent Est. Percent
return data and ratios) 2007 2006 Change Change 2007 2006 Change Change
Consolidated Highlights
Revenues $ 9,455 $ 8,875 580 6.5 $ 18,786 $ 17,956 830 4.6
Net income 1,403 1,207 196 16.2 2,898 2,622 276 10.5
Operating income 1,072 1,272 (200) (15.7) 2,269 2,576 (307) (11.9)
Income per diluted share
Net 2.30 1.89 0.41 21.7 4.71 4.08 0.63 15.4
Operating 1.76 2.00 (0.24) (12.0) 3.69 4.01 (0.32) (8.0)
Net shares outstanding 587.7 630.9 (43.2) (6.8)
Weighted average shares outstanding (diluted) 608.8 638.5 (29.7) (4.7) 615.2 642.9 (27.7) (4.3)
Return on equity
Net income 25.0 9.9 - 15.1 pts
Operating income 23.1 9.7 - 13.4 pts
Book value per diluted share 36.39 32.43 3.96 12.2
Book value per diluted share, excluding the
impact of unrealized net capital gains on
fixed income securities 35.70 31.98 3.72 11.6
Property-Liability Highlights
Property-Liability premiums written $ 6,939 $ 7,074 (135) (1.9) $ 13,548 $ 13,799 (251) (1.8)
Property-Liability revenues 7,776 7,364 412 5.6 15,517 14,930 587 3.9
Net income 1,230 1,164 66 5.7 2,579 2,485 94 3.8
Underwriting income 845 1,199 (354) (29.5) 1,891 2,441 (550) (22.5)
Net investment income 517 461 56 12.1 1,008 927 81 8.7
Operating income 947 1,135 (188) (16.6) 2,009 2,311 (302) (13.1)
Catastrophe losses 433 255 178 69.8 594 362 232 64.1
Ratios:
Allstate Protection loss ratio 63.2 58.1 - 5.1 pts. 62.2 57.2 - 5.0 pts
Allstate Protection expense ratio 24.3 24.3 - - pts. 24.2 24.9 - (0.7) pts
Allstate Protection combined ratio 87.5 82.4 - 5.1 pts. 86.4 82.1 - 4.3 pts
Effect of Discontinued Lines and Coverages on
combined ratio 0.1 0.1 - - pts. (0.3) 0.1 - (0.4) pts
Property-Liability combined ratio 87.6 82.5 - 5.1 pts. 86.1 82.2 - 3.9 pts
Effect of catastrophe losses on combined ratio 6.3 3.7 - 2.6 pts. 4.4 2.6 - 1.8 pts
Property-Liability combined ratio excluding
effect of catastrophes 81.3 78.8 - 2.5 pts. 81.7 79.6 - 2.1 pts
Effect of prior year reserve reestimates on
combined ratio (2.1) (5.2) - 3.1 pts. (2.0) (4.1) - 2.1 pts
Catastrophe losses included in prior year
reserve reestimates (0.7) 1.8 - (2.5) pts. (0.4) 1.4 - (1.8) pts
Property-Liability combined ratio excluding
effect of catastrophes and prior year
reserve reestimates 84.1 82.2 - 1.9 pts. 84.1 82.3 - 1.8 pts
Allstate Financial Highlights
Premiums and deposits $ 2,887 $ 4,228 (1,341) (31.7) $ 5,515 $ 6,904 (1,389) (20.1)
Allstate Financial revenues 1,634 1,483 151 10.2 3,190 2,954 236 8.0
Net income 200 73 127 174.0 364 181 183 101.1
Operating income 154 160 (6) (3.8) 310 304 6 2.0
Gross margin analysis
Investment margin 295 292 3 1.0 581 567 14 2.5
Benefit margin 122 152 (30) (19.7) 232 267 (35) (13.1)
Contract charges and fees 85 123 (38) (30.9) 167 262 (95) (36.3)
Gross margin $ 502 $ 567 (65) (11.5) $ 980 $ 1,096 (116) (10.6)
6
7. THE ALLSTATE CORPORATION
CONSOLIDATED STATEMENTS OF OPERATIONS
Three Months Ended Six Months Ended
June 30, June 30,
Est. Percent Est. Percent
($ in millions, except per share data) 2007 2006 Change 2007 2006 Change
Revenues
Property-liability insurance premiums $ 6,822 $ 6,860 (0.6) $ 13,628 $ 13,736 (0.8)
Life and annuity premiums
and contract charges 454 515 (11.8) 937 1,010 (7.2)
Net investment income 1,634 1,548 5.6 3,205 3,059 4.8
Realized capital gains and losses 545 (48) - 1,016 151 -
Total revenues 9,455 8,875 6.5 18,786 17,956 4.6
Costs and expenses
Property-liability insurance
claims and claims expense 4,317 3,994 8.1 8,434 7,867 7.2
Life and annuity contract benefits 386 374 3.2 814 747 9.0
Interest credited to contractholder funds 673 652 3.2 1,322 1,272 3.9
Amortization of deferred policy
acquisition costs 1,216 1,223 (0.6) 2,369 2,362 0.3
Operating costs and expenses 734 747 (1.7) 1,461 1,526 (4.3)
Restructuring and related charges 4 12 (66.7) 3 119 (97.5)
Interest expense 83 90 (7.8) 155 171 (9.4)
Total costs and expenses 7,413 7,092 4.5 14,558 14,064 3.5
Gain (loss) on disposition of operations 2 (35) 105.7 2 (88) 102.3
Income from operations before income
tax expense 2,044 1,748 16.9 4,230 3,804 11.2
Income tax expense 641 541 18.5 1,332 1,182 12.7
Net income $ 1,403 $ 1,207 16.2 $ 2,898 $ 2,622 10.5
Net income per share - Basic $ 2.33 $ 1.91 $ 4.75 $ 4.11
Weighted average shares - Basic 604.1 634.1 610.4 638.6
Net income per share - Diluted $ 2.30 $ 1.89 $ 4.71 $ 4.08
Weighted average shares - Diluted 608.8 638.5 615.2 642.9
Cash dividends declared per share $ 0.38 $ 0.35 $ 0.76 $ 0.70
7
8. THE ALLSTATE CORPORATION
CONTRIBUTION TO INCOME
Three Months Ended Six Months Ended
June 30, June 30,
Est. Percent Est. Percent
($ in millions, except per share data) 2007 2006 Change 2007 2006 Change
Contribution to income
Operating income before the impact of
restructuring and related charges $ 1,075 $ 1,279 (15.9) $ 2,271 $ 2,653 (14.4)
Restructuring and related charges,
after-tax 3 7 (57.1) 2 77 (97.4)
Operating income 1,072 1,272 (15.7) 2,269 2,576 (11.9)
Realized capital gains and losses, after-tax 352 (29) - 657 100 -
DAC and DSI amortization relating to realized capital
gains and losses, after-tax (15) (3) - (15) 24 (162.5)
Reclassification of periodic settlements
and accruals on non-hedge derivative
instruments, after-tax (7) (9) 22.2 (15) (19) 21.1
Gain (loss) on disposition of operations, after-tax 1 (24) 104.2 2 (59) 103.4
Net income $ 1,403 $ 1,207 16.2 $ 2,898 $ 2,622 10.5
Income per share - Diluted
Operating income before the impact of
restructuring and related charges $ 1.76 $ 2.01 (12.4) $ 3.69 $ 4.13 (10.7)
Restructuring and related charges,
after-tax - 0.01 (100.0) - 0.12 (100.0)
Operating income 1.76 2.00 (12.0) 3.69 4.01 (8.0)
Realized capital gains and losses, after-tax 0.58 (0.05) - 1.07 0.15 -
DAC and DSI amortization relating to realized capital
gains and losses, after-tax (0.02) - - (0.02) 0.04 (150.0)
Reclassification of periodic settlements
and accruals on non-hedge derivative
instruments, after-tax (0.02) (0.02) - (0.03) (0.03) -
Gain (loss) on disposition of operations, after-tax - (0.04) 100.0 - (0.09) 100.0
Net income $ 2.30 $ 1.89 21.7 $ 4.71 $ 4.08 15.4
8
9. THE ALLSTATE CORPORATION
COMPONENTS OF REALIZED CAPITAL GAINS AND LOSSES (PRETAX)
Three Months Ended June 30, 2007 (Est.)
($ in millions) Property- Allstate Corporate
Liability Financial and Other Total
Investment write-downs $ (4) $ (4) $ - $ (8)
Dispositions (1) (2) 352 (49) 4 307
Valuation of derivative instruments (3) 64 135 - 199
Settlements of derivative instruments 25 22 - 47
Total $ 437 $ 104 $ 4 $ 545
Six Months Ended June 30, 2007 (Est.)
($ in millions) Property- Allstate Corporate
Liability Financial and Other Total
Investment write-downs $ (8) $ (5) $ - $ (13)
Dispositions 763 (14) 8 757
Valuation of derivative instruments 72 115 - 187
Settlements of derivative instruments 54 31 - 85
Total $ 881 $ 127 $ 8 $ 1,016
Three Months Ended June 30, 2006
($ in millions) Property- Allstate Corporate
Liability Financial and Other Total
Investment write-downs $ (10) $ (4) $ - $ (14)
Dispositions 54 (75) (11) (32)
Valuation of derivative instruments (29) (22) - (51)
Settlements of derivative instruments 28 21 - 49
Total $ 43 $ (80) $ (11) $ (48)
Six Months Ended June 30, 2006
($ in millions) Property- Allstate Corporate
Liability Financial and Other Total
Investment write-downs $ (14) $ (9) $ - $ (23)
Dispositions 248 (151) (8) 89
Valuation of derivative instruments 3 14 - 17
Settlements of derivative instruments 30 38 - 68
Total $ 267 $ (108) $ (8) $ 151
(1) In the second quarter of 2007, the Company recognized $71 million of losses related to a change in our intent to
hold certain securities with unrealized losses until they recover in value. The change in our intent was due to
strategic asset allocation strategies for Property-Liability and Allstate Financial, as well as ongoing
comprehensive reviews of the Property-Liability and Allstate Financial portfolios. The Company identified $2.82
billion of securities which we did not have the intent to hold until recovery to achieve these objectives.
(2) Realized gains on dispositions in the second quarter of 2007 primarily related to a reallocation of equity
securities in the Property-Liability portfolio totaling $365 million.
(3) The improvement in realized capital gains and losses relating to the valuation of derivative instruments in the
second quarter of 2007 compared to the same period in the prior year was primarily the result of equity market
fluctuations.
9
10. THE ALLSTATE CORPORATION
SEGMENT RESULTS
Three Months Ended Six Months Ended
June 30, June 30,
($ in millions) Est. Est.
2007 2006 2007 2006
Property-Liability
Premiums written $ 6,939 $ 7,074 $ 13,548 $ 13,799
Premiums earned $ 6,822 $ 6,860 $ 13,628 $ 13,736
Claims and claims expense 4,317 3,994 8,434 7,867
Amortization of deferred policy acquisition costs 1,032 1,030 2,056 2,049
Operating costs and expenses 623 628 1,243 1,280
Restructuring and related charges 5 9 4 99
Underwriting income 845 1,199 1,891 2,441
Net investment income 517 461 1,008 927
Income tax expense on operations 415 525 890 1,057
Operating income 947 1,135 2,009 2,311
Realized capital gains and losses, after-tax 283 30 570 175
Gain (loss) on disposition of operations, after-tax - (1) - (1)
Net income $ 1,230 $ 1,164 $ 2,579 $ 2,485
Catastrophe losses $ 433 $ 255 $ 594 $ 362
Operating ratios
Claims and claims expense ratio 63.3 58.2 61.9 57.3
Expense ratio 24.3 24.3 24.2 24.9
Combined ratio 87.6 82.5 86.1 82.2
Effect of catastrophe losses on combined ratio 6.3 3.7 4.4 2.6
Effect of prior year reserve reestimates on combined ratio (2.1) (5.2) (2.0) (4.1)
Effect of restructuring and related charges on combined ratio 0.1 0.1 - 0.7
Effect of Discontinued Lines and Coverages on combined ratio 0.1 0.1 (0.3) 0.1
Allstate Financial
Premiums and deposits $ 2,887 $ 4,228 $ 5,515 $ 6,904
Investments $ 77,113 $ 75,803 $ 77,113 $ 75,803
Premiums and contract charges $ 454 $ 515 $ 937 $ 1,010
Net investment income 1,076 1,048 2,126 2,052
Periodic settlements and accruals on non-hedge derivative instruments 12 14 24 30
Contract benefits 386 374 814 747
Interest credited to contractholder funds 670 651 1,319 1,274
Amortization of deferred policy acquisition costs 164 190 293 349
Operating costs and expenses 95 119 200 247
Restructuring and related charges (1) 3 (1) 19
Income tax expense on operations 74 80 152 152
Operating income 154 160 310 304
Realized capital gains and losses, after-tax 67 (52) 82 (70)
DAC and DSI amortization relating to realized capital gains and losses, after-tax (15) (3) (15) 24
Reclassification of periodic settlements and accruals on non-hedge
derivative instruments, after-tax (7) (9) (15) (19)
Gain (loss) on disposition of operations, after-tax 1 (23) 2 (58)
Net income $ 200 $ 73 $ 364 $ 181
Corporate and Other
Net investment income $ 41 $ 39 $ 71 $ 80
Operating costs and expenses 99 90 173 170
Restructuring and related charges - - - 1
Income tax benefit on operations (29) (28) (52) (52)
Operating loss (29) (23) (50) (39)
Realized capital gains and losses, after-tax 2 (7) 5 (5)
Net loss $ (27) $ (30) $ (45) $ (44)
Consolidated net income $ 1,403 $ 1,207 $ 2,898 $ 2,622
10
11. THE ALLSTATE CORPORATION
UNDERWRITING RESULTS BY AREA OF BUSINESS
Three Months Ended Six Months Ended
June 30, June 30,
Est. Percent Est. Percent
($ in millions) 2007 2006 Change 2007 2006 Change
Property-Liability Underwriting Summary
Allstate Protection $ 850 $ 1,207 (29.6) $ 1,856 $ 2,456 (24.4)
Discontinued Lines and Coverages (5) (8) 37.5 35 (15) -
Underwriting income $ 845 $ 1,199 (29.5) $ 1,891 $ 2,441 (22.5)
Allstate Protection Underwriting Summary
Premiums written $ 6,939 $ 7,073 (1.9) $ 13,548 $ 13,798 (1.8)
Premiums earned $ 6,822 $ 6,859 (0.5) $ 13,628 $ 13,734 (0.8)
Claims and claims expense 4,314 3,987 8.2 8,473 7,855 7.9
Amortization of deferred policy acquisition costs 1,032 1,030 0.2 2,056 2,049 0.3
Operating costs and expenses 621 626 (0.8) 1,239 1,275 (2.8)
Restructuring and related charges 5 9 (44.4) 4 99 (96.0)
Underwriting income $ 850 $ 1,207 (29.6) $ 1,856 $ 2,456 (24.4)
Catastrophe losses $ 433 $ 255 69.8 $ 594 $ 362 64.1
Operating ratios
Claims and claims expense ratio 63.2 58.1 62.2 57.2
Expense ratio 24.3 24.3 24.2 24.9
Combined ratio 87.5 82.4 86.4 82.1
Effect of catastrophe losses
on combined ratio 6.3 3.7 4.4 2.6
Effect of restructuring and related
charges on combined ratio 0.1 0.1 - 0.7
Discontinued Lines and Coverages
Underwriting Summary
Premiums written $ - $ 1 (100.0) $ - $ 1 (100.0)
Premiums earned $ - $ 1 (100.0) $ - $ 2 (100.0)
Claims and claims expense 3 7 (57.1) (39) 12 -
Operating costs and expenses 2 2 - 4 5 (20.0)
Underwriting (loss) income $ (5) $ (8) 37.5 $ 35 $ (15) -
Effect of Discontinued Lines and Coverages
on the Property-Liability combined ratio 0.1 0.1 (0.3) 0.1
11
12. THE ALLSTATE CORPORATION
PROPERTY-LIABILITY PREMIUMS WRITTEN BY MARKET SEGMENT
Three Months Ended Six Months Ended
June 30, June 30,
Est. Percent Est. Percent
($ in millions) 2007 2006 Change 2007 2006 Change
Allstate brand
Standard auto $ 3,956 $ 3,873 2.1 $ 8,007 $ 7,825 2.3
Non-standard auto 300 355 (15.5) 621 730 (14.9)
Auto 4,256 4,228 0.7 8,628 8,555 0.9
Involuntary auto 22 34 (35.3) 44 71 (38.0)
Commercial lines 199 230 (13.5) 393 449 (12.5)
Homeowners 1,543 1,620 (4.8) 2,756 2,908 (5.2)
Other personal lines 422 433 (2.5) 787 814 (3.3)
6,442 6,545 (1.6) 12,608 12,797 (1.5)
Encompass brand
Standard auto 297 303 (2.0) 563 576 (2.3)
Non-standard auto (Deerbrook) 18 24 (25.0) 39 49 (20.4)
Auto 315 327 (3.7) 602 625 (3.7)
Involuntary auto 5 6 (16.7) 11 14 (21.4)
Homeowners 147 163 (9.8) 270 302 (10.6)
Other personal lines 30 32 (6.3) 57 60 (5.0)
497 528 (5.9) 940 1,001 (6.1)
Allstate Protection 6,939 7,073 (1.9) 13,548 13,798 (1.8)
Discontinued Lines
and Coverages - 1 (100.0) - 1 (100.0)
Property-Liability $ 6,939 $ 7,074 (1.9) $ 13,548 $ 13,799 (1.8)
Allstate Protection
Standard auto $ 4,253 $ 4,176 1.8 $ 8,570 $ 8,401 2.0
Non-standard auto 318 379 (16.1) 660 779 (15.3)
Auto 4,571 4,555 0.4 9,230 9,180 0.5
Involuntary auto 27 40 (32.5) 55 85 (35.3)
Commercial lines 199 230 (13.5) 393 449 (12.5)
Homeowners 1,690 1,783 (5.2) 3,026 3,210 (5.7)
Other personal lines 452 465 (2.8) 844 874 (3.4)
$ 6,939 $ 7,073 (1.9) $ 13,548 $ 13,798 (1.8)
12
13. THE ALLSTATE CORPORATION
PROPERTY-LIABILITY
ANNUAL IMPACT OF NET RATE CHANGES APPROVED ON PREMIUMS WRITTEN (1)
Three Months Ended
June 30, 2007 (Est.)
Number of
States Countrywide (%) (2) State Specific (%) (3)
Allstate brand
Standard auto 9 0.4 5.9
Non-standard auto 1 - -
Auto 10 0.4 5.9
Homeowners 20 1.3 2.3
Encompass brand
Standard auto 6 (0.2) (0.8)
Non-standard auto (Deerbrook) 7 8.1 14.6
Auto 10 0.5 1.6
Homeowners 17 (0.1) (0.3)
Six Months Ended
June 30, 2007 (Est.)
Number of
States Countrywide (%) (2) State Specific (%) (3)
Allstate brand
Standard auto 15 0.8 3.8
Non-standard auto 4 1.3 8.7
Auto 16 0.8 4.1
Homeowners 21 2.8 3.8
Encompass brand
Standard auto 9 0.1 0.2
Non-standard auto (Deerbrook) 7 8.1 14.6
Auto 13 0.7 2.1
Homeowners 21 1.8 3.7
(1) Rate increases that are indicated based on a loss trend analysis to achieve a targeted return will
continue to be pursued in all locations and for all products. Rate changes include changes approved
based on our net cost of reinsurance. These rate changes do not reflect initial rates filed for
insurance subsidiaries initially writing new business.
(2) Represents the impact in the states where rate changes were approved during 2007 as a percentage
of total countrywide prior year-end premiums written.
(3) Represents the impact in the states where rate changes were approved during 2007 as a percentage
of total prior year-end premiums written in those states.
13
14. THE ALLSTATE CORPORATION
ALLSTATE PROTECTION MARKET SEGMENT ANALYSIS
Three Months Ended June 30,
($ in millions) Est. 2007 2006 Est. 2007 2006 Est. 2007 2006 Est. 2007 2006
Effect of
Catastrophe Losses
Premiums Earned Loss Ratio (2) on the Loss Ratio Expense Ratio
Allstate brand
Standard auto $ 3,986 $ 3,880 63.5 63.1 1.3 1.6 24.2 23.8
Non-standard auto 316 371 59.2 55.0 0.6 0.8 23.7 21.8
Auto 4,302 4,251 63.2 62.4 1.3 1.6 24.1 23.7
Homeowners 1,437 1,460 67.7 47.2 21.6 12.3 23.3 24.1
Other (1) 606 646 57.4 50.5 6.6 (2.3) 25.1 25.2
Total Allstate brand 6,345 6,357 63.6 57.7 6.4 3.6 24.1 23.9
Encompass brand
Standard auto 283 290 57.2 63.1 0.7 (2.1) 26.9 27.2
Non-standard auto (Deerbrook) 20 24 80.0 87.5 - - 25.0 29.2
Auto 303 314 58.8 65.0 0.7 (1.9) 26.7 27.4
Homeowners 139 150 55.4 57.3 16.5 18.7 30.2 30.7
Other (1) 35 38 62.9 78.9 5.7 7.9 25.7 31.6
Total Encompass brand 477 502 58.0 63.7 5.7 5.0 27.7 28.7
Allstate Protection $ 6,822 $ 6,859 63.2 58.1 6.3 3.7 24.3 24.3
Six Months Ended June 30,
($ in millions) Est. 2007 2006 Est. 2007 2006 Est. 2007 2006 Est. 2007 2006
Effect of
Catastrophe Losses
Premiums Earned Loss Ratio (2) on the Loss Ratio Expense Ratio
Allstate brand
Standard auto $ 7,937 $ 7,718 63.6 60.6 0.8 0.8 23.8 24.7
Non-standard auto 638 749 59.7 56.9 0.3 0.3 22.7 22.3
Auto 8,575 8,467 63.3 60.2 0.8 0.8 23.7 24.5
Homeowners 2,875 2,951 61.4 49.6 15.0 9.7 24.1 24.3
Other (1) 1,217 1,302 58.7 49.5 5.1 (2.3) 25.6 26.2
Total Allstate brand 12,667 12,720 62.4 56.7 4.4 2.5 24.0 24.6
Encompass brand
Standard auto 567 581 61.0 64.2 0.5 (0.9) 26.7 27.5
Non-standard auto (Deerbrook) 42 51 78.6 80.4 - - 23.8 31.4
Auto 609 632 62.2 65.5 0.5 (0.8) 26.5 27.9
Homeowners 281 303 52.3 56.8 10.7 13.9 29.6 30.0
Other (1) 71 79 57.7 77.2 4.2 6.3 25.4 30.4
Total Encompass brand 961 1,014 59.0 63.8 3.7 4.1 27.3 28.7
Allstate Protection $ 13,628 $ 13,734 62.2 57.2 4.4 2.6 24.2 24.9
(1) Other includes involuntary auto, commercial lines, condominium, renters and other personal lines.
(2) Loss Ratio comparisons are impacted by the relative level of prior year reserve reestimates. Please refer to the quot;Effect of Pretax
Prior Year Reserve Reestimates on the Combined Ratioquot; table for detailed reserve reestimate information.
14
15. THE ALLSTATE CORPORATION
PROPERTY-LIABILITY
EFFECT OF PRETAX PRIOR YEAR RESERVE REESTIMATES ON THE COMBINED RATIO
Three Months Ended June 30,
Effect of Pretax Reserve
Pretax Reestimates on the
Reserve Reestimates (1) Combined Ratio
Est. Est.
($ in millions) 2007 2006 2007 2006
Auto $ (146) $ (196) (2.2) (2.9)
Homeowners 25 (100) 0.4 (1.5)
Other (26) (65) (0.4) (0.9)
Allstate Protection (2) (147) (361) (2.2) (5.3)
Discontinued Lines and Coverages 4 6 0.1 0.1
Property-Liability $ (143) $ (355) (2.1) (5.2)
Allstate brand $ (113) $ (360) (1.7) (5.3)
Encompass brand (34) (1) (0.5) -
Allstate Protection (2) $ (147) $ (361) (2.2) (5.3)
Six Months Ended June 30,
Effect of Pretax Reserve
Pretax Reestimates on the
Reserve Reestimates (1) Combined Ratio
Est. Est.
($ in millions) 2007 2006 2007 2006
Auto $ (212) $ (359) (1.6) (2.6)
Homeowners 22 (130) 0.2 (0.9)
Other (44) (89) (0.3) (0.7)
Allstate Protection (3) (234) (578) (1.7) (4.2)
Discontinued Lines and Coverages (38) 12 (0.3) 0.1
Property-Liability $ (272) $ (566) (2.0) (4.1)
Allstate brand $ (192) $ (580) (1.4) (4.2)
Encompass brand (42) 2 (0.3) -
Allstate Protection (3) $ (234) $ (578) (1.7) (4.2)
(1) Favorable reserve reestimates are shown in parentheses.
(2) Unfavorable reserve reestimates included in catastrophe losses totaled $50 million in the three months
ended June 30, 2007 and favorable reserve reestimates included in catastrophe losses totaled $123
million in the three months ended June 30, 2006.
(3) Unfavorable reserve reestimates included in catastrophe losses totaled $44 million in the six months
ended June 30, 2007 and favorable reserve reestimates included in catastrophe losses totaled $187
million in the six months ended June 30, 2006.
15
16. THE ALLSTATE CORPORATION
ALLSTATE FINANCIAL PREMIUMS AND DEPOSITS
Three Months Ended Six Months Ended
June 30, June 30,
Est. Percent Est. Percent
($ in millions) 2007 2006 Change 2007 2006 Change
Life Products
Interest-sensitive life $ 356 $ 377 (5.6) $ 718 $ 739 (2.8)
Traditional 90 86 4.7 182 158 15.2
Other 92 83 10.8 181 167 8.4
538 546 (1.5) 1,081 1,064 1.6
Annuities
Indexed annuities 171 207 (17.4) 312 394 (20.8)
Fixed deferred annuities 657 1,736 (62.2) 1,137 2,642 (57.0)
Fixed immediate annuities 101 143 (29.4) 253 299 (15.4)
Variable annuities - 243 (100.0) - 678 (100.0)
929 2,329 (60.1) 1,702 4,013 (57.6)
Institutional Products
Funding agreements backing
medium-term notes 1,300 1,250 4.0 2,500 1,600 56.3
Bank Deposits 120 103 16.5 232 227 2.2
Total $ 2,887 $ 4,228 (31.7) $ 5,515 $ 6,904 (20.1)
Total excluding variable annuities $ 2,887 $ 3,985 (27.6) $ 5,515 $ 6,226 (11.4)
16
17. THE ALLSTATE CORPORATION
CONSOLIDATED STATEMENTS OF FINANCIAL POSITION
June 30, December 31,
($ in millions, except par value data) 2007 (Est.) 2006
Assets
Investments
Fixed income securities, at fair value
(amortized cost $96,866 and $95,780) $ 97,906 $ 98,320
Equity securities, at fair value (cost $6,131 and $6,026) 7,726 7,777
Mortgage loans 9,933 9,467
Short-term 4,775 2,430
Other 1,927 1,763
Total investments (1) 122,267 119,757
Cash 385 443
Premium installment receivables, net 4,864 4,789
Deferred policy acquisition costs 5,561 5,332
Reinsurance recoverables, net 5,827 5,827
Accrued investment income 1,091 1,062
Deferred income taxes 443 224
Property and equipment, net 1,055 1,010
Goodwill 825 825
Other assets 1,994 2,111
Separate Accounts 16,225 16,174
Total assets $ 160,537 $ 157,554
Liabilities
Reserve for property-liability insurance
claims and claims expense $ 18,714 $ 18,866
Reserve for life-contingent contract benefits 12,675 12,786
Contractholder funds 62,616 62,031
Unearned premiums 10,346 10,427
Claim payments outstanding 746 717
Other liabilities and accrued expenses 12,014 10,045
Short-term debt - 12
Long-term debt 5,641 4,650
Separate Accounts 16,225 16,174
Total liabilities 138,977 135,708
Shareholders' equity
Preferred stock, $1 par value, 25 million
shares authorized, none issued - -
Common stock, $.01 par value, 2.0 billion shares
authorized and 900 million issued, 588 million
and 622 million shares outstanding 9 9
Additional capital paid-in 2,938 2,939
Retained income 31,495 29,070
Deferred ESOP expense (68) (72)
Treasury stock, at cost (312 million and 278 million shares) (13,241) (11,091)
Accumulated other comprehensive income:
Unrealized net capital gains and losses 1,430 2,074
Unrealized foreign currency translation adjustments 51 26
Net funded status of pension and other postretirement benefit obligation (1,054) (1,109)
Total accumulated other comprehensive income 427 991
Total shareholders' equity 21,560 21,846
Total liabilities and shareholders' equity $ 160,537 $ 157,554
(1) Total investments include $42,162 for Property-Liability, $77,113 for Allstate Financial and $2,992 for Corporate
and Other investments at June 30, 2007. Total investments include $41,663 for Property-Liability, $75,951 for
Allstate Financial and $2,143 for Corporate and Other investments at December 31, 2006.
17
18. Definitions of GAAP Operating Ratios
and Impacts of Specific Items on the GAAP Operating Ratios
Claims and claims expense (“loss”) ratio is the ratio of claims and claims expense to premiums earned.
Loss ratios include the impact of catastrophe losses.
Expense ratio is the ratio of amortization of deferred acquisition costs (“DAC”), operating costs and
expenses and restructuring and related charges to premiums earned.
Combined ratio is the ratio of claims and claims expense, amortization of DAC, operating costs and expenses
and restructuring and related charges to premiums earned. The combined ratio is the sum of the loss ratio and
the expense ratio. The difference between 100% and the combined ratio represents underwriting income (loss) 1
as a percentage of premiums earned.
Effect of Discontinued Lines and Coverages on combined ratio is the ratio of claims and claims expense
and other costs and expenses in the Discontinued Lines and Coverages segment to Property-Liability
premiums earned. The sum of the effect of Discontinued Lines and Coverages on the combined ratio and the
Allstate Protection combined ratio is equal to the Property-Liability combined ratio.
Effect of catastrophe losses on combined ratio is the percentage of catastrophe losses included in claims
and claims expenses to premiums earned. This ratio includes prior year reserve reestimates.
Effect of prior year reserve reestimates on combined ratio is the percentage of prior year reserve
reestimates included in claims and claims expense to premiums earned. This ratio includes prior year reserve
reestimates of catastrophe losses.
Effect of restructuring and related charges on combined ratio is the percentage of restructuring and
related charges to premiums earned.
Definitions of Non-GAAP and Operating Measures
We believe that investors’ understanding of Allstate’s performance is enhanced by our disclosure of the
following non-GAAP financial measures. Our methods of calculating these measures may differ from those
used by other companies and therefore comparability may be limited.
Operating income is net income, excluding:
• realized capital gains and losses, after-tax, except for periodic settlements and accruals on non-hedge
derivative instruments, which are reported with realized capital gains and losses but included in operating
income,
• amortization of DAC and deferred sales inducements (“DSI”), to the extent they resulted from the
recognition of certain realized capital gains and losses,
• (loss) gain on disposition of operations, after-tax, and
• adjustments for other significant non-recurring, infrequent or unusual items, when (a) the nature of the
charge or gain is such that it is reasonably unlikely to recur within two years, or (b) there has been no
similar charge or gain within the prior two years.
Net income is the GAAP measure that is most directly comparable to operating income.
We use operating income to evaluate our results of operations. It reveals trends in our insurance and financial
services business that may be obscured by the net effect of realized capital gains and losses, (loss) gain on
disposition of operations and adjustments for other significant non-recurring, infrequent or unusual items.
Realized capital gains and losses and (loss) gain on disposition of operations may vary significantly between
periods and are generally driven by business decisions and economic developments such as capital market
18
19. conditions, the timing of which is unrelated to the insurance underwriting process. Consistent with our intent
to protect results or earn additional income, including to enhance or maintain investment margin, operating
income includes periodic settlements and accruals on certain derivative instruments that are reported in
realized capital gains and losses because they do not qualify for hedge accounting or are not designated as
hedges for accounting purposes. These instruments are used for economic hedges and to replicate fixed
income securities, and by including them in operating income, we are appropriately reflecting their trends in
our performance and in a manner consistent with the economically hedged investments, product attributes
(e.g. net investment income and interest credited to contractholder funds) or replicated investments. Non-
recurring items are excluded because, by their nature, they are not indicative of our business or economic
trends. Therefore, we believe it is useful for investors to evaluate these components separately and in the
aggregate when reviewing our performance. We note that the price to earnings multiple commonly used by
insurance investors as a forward-looking valuation technique uses operating income as the denominator. We
use adjusted measures of operating income and operating income per diluted share in incentive compensation.
Operating income should not be considered as a substitute for net income and does not reflect the overall
profitability of our business.
The following tables reconcile operating income and net income for the three months and six months ended
June 30, 2007 and 2006.
For the three months ended June 30, Property-Liability Allstate Financial Consolidated Per diluted share
Est. Est. Est. Est.
($ in millions, except per share data) 2007 2006 2007 2006 2007 2006 2007 2006
$ 947 $ 1,135 $ 154 $ 160 $ 1,072 $ 1,272 $ 1.76 $ 2.00
Operating income
Realized capital gains and losses 437 43 104 (80) 545 (48)
Income tax (expense) benefit (154) (13) (37) 28 (193) 19
Realized capital gains and losses,
after-tax 283 30 67 (52) 352 (29) 0.58 (0.05)
DAC and DSI amortization relating to
realized capital gains and losses,
after-tax -- -- (15) (3) (15) (3) (0.02) --
Reclassification of periodic
settlements and accruals on non-
hedge derivative instruments, after-
tax -- -- (7) (9) (7) (9) (0.02) (0.02)
Gain (loss) on disposition of operations,
after-tax -- (1) 1 (23) 1 (24) -- (0.04)
$ 1,230 $ 1,164 $ 200 $ 73 $ 1,403 $ 1,207 $ 2.30 $ 1.89
Net income
For the six months ended June 30, Property-Liability Allstate Financial Consolidated Per diluted share
Est. Est. Est. Est.
($ in millions, except per share data) 2007 2006 2007 2006 2007 2006 2007 2006
$ 2,009 $ 2,311 $ 310 $ 304 $ 2,269 $ 2,576 $ 3.69 $ 4.01
Operating income
Realized capital gains and losses 881 267 127 (108) 1,016 151
Income tax (expense) benefit (311) (92) (45) 38 (359) (51)
Realized capital gains and losses,
after-tax 570 175 82 (70) 657 100 1.07 0.15
DAC and DSI amortization relating to
realized capital gains and losses,
after-tax -- -- (15) 24 (15) 24 (0.02) 0.04
Reclassification of periodic
settlements and accruals on non-
hedge derivative instruments, after-
tax -- -- (15) (19) (15) (19) (0.03) (0.03)
Gain (loss) on disposition of operations,
after-tax -- (1) 2 (58) 2 (59) -- (0.09)
$ 2,579 $ 2,485 $ 364 $ 181 $ 2,898 $ 2,622 $ 4.71 $ 4.08
Net income
19
20. Underwriting income (loss) is calculated as premiums earned, less claims and claims expense (“losses”),
amortization of DAC, operating costs and expenses and restructuring and related charges as determined using
GAAP. Management uses this measure in its evaluation of results of operations to analyze the profitability of
our Property-Liability insurance operations separately from investment results. It is also an integral
component of incentive compensation. It is useful for investors to evaluate the components of income
separately and in the aggregate when reviewing performance. Net income is the most directly comparable
GAAP measure. Underwriting income (loss) should not be considered as a substitute for net income and does
not reflect the overall profitability of our business. A reconciliation of Property-Liability underwriting
income (loss) to net income is provided in the Segment Results table.
Combined ratio excluding the effect of catastrophes is a non-GAAP ratio, which is computed as the
difference between two GAAP operating ratios: the combined ratio and the effect of catastrophes on the
combined ratio. The most directly comparable GAAP measure is the combined ratio. We believe that this
ratio is useful to investors and it is used by management to reveal the trends in our property-liability business
that may be obscured by catastrophe losses. These catastrophe losses cause our loss trends to vary
significantly between periods as a result of their incidence of occurrence and magnitude and can have a
significant impact on the combined ratio. We believe it is useful for investors to evaluate these components
separately and in the aggregate when reviewing our underwriting performance. The combined ratio excluding
the effect of catastrophes should not be considered a substitute for the combined ratio and does not reflect the
overall underwriting profitability of our business. A reconciliation of combined ratio excluding the effect of
catastrophes to combined ratio is provided in the Property-Liability Highlights section of the Consolidated
and Segments Highlights table.
Combined ratio excluding the effect of catastrophes and prior year reserve reestimates is a non-GAAP
ratio, which is computed as the difference between three GAAP operating ratios: the combined ratio, the
effect of catastrophes on the combined ratio and the effect of prior year reserve reestimates on the combined
ratio. The most directly comparable GAAP measure is the combined ratio. We believe that this ratio is useful
to investors and it is used by management to reveal the trends in our property-liability business that may be
obscured by catastrophe losses and prior year reserve reestimates. These catastrophe losses cause our loss
trends to vary significantly between periods as a result of their incidence of occurrence and magnitude and
can have a significant impact on the combined ratio. Prior year reserve reestimates are caused by unexpected
loss development on historical reserves. We believe it is useful for investors to evaluate these components
separately and in the aggregate when reviewing our underwriting performance. We also provide it to
facilitate a comparison to our outlook on the 2007 combined ratio excluding the effect of catastrophe losses
and assuming no prior year reserve reestimates. The combined ratio excluding the effect of catastrophes and
prior year reserve reestimates should not be considered a substitute for the combined ratio and does not reflect
the overall underwriting profitability of our business. A reconciliation of combined ratio excluding the effect
of catastrophes and prior year reserve reestimates to combined ratio is provided in the Property-Liability
Highlights section of the Consolidated and Segments Highlights table.
In this press release, we provide our outlook on the 2007 combined ratio excluding the effect of catastrophe
losses and assuming no prior year reserve reestimates. A reconciliation of this measure to the combined ratio
is not possible on a forward-looking basis because it is not possible to provide a reliable forecast of
catastrophes. Prior year reserve reestimates are expected to be zero because reserves are determined based on
our best estimate of ultimate loss reserves as of the reporting date.
Operating income return on equity is a ratio that uses a non-GAAP measure. It is calculated by dividing the
rolling 12-month operating income by the average of shareholders’ equity at the beginning and at the end of
the 12-month period, after excluding the effect of unrealized net capital gains. We use it to supplement our
evaluation of net income and return on equity. We believe that this measure is useful to investors because it
eliminates the effect of items that can fluctuate significantly from period to period and that are driven by
economic developments, the magnitude and timing of which are generally not influenced by management:
20
21. the after-tax effects of realized and unrealized capital gains and losses and the cumulative effect of change in
accounting principle. In addition, it eliminates non-recurring items that are not indicative of our business or
economic trends. Return on equity is the most directly comparable GAAP measure. The following table
shows the reconciliation.
For the twelve months ended
($ in millions) June 30,
Est. 2007 2006
Return on equity
Numerator:
Net income $ 5,269 $ 2,115
Denominator:
Beginning shareholders’ equity 20,605 22,324
3
Ending shareholders’ equity 21,560 20,605
Average shareholders’ equity $ 21,083 $ 21,465
3
Return on equity 25.0% 9.9%
For the twelve months ended
June 30,
Est. 2007 2006
Operating income return on equity
Numerator:
Operating income $ 4,581 $ 1,901
Denominator:
Beginning shareholders’ equity 20,605 22,324
Unrealized net capital gains 1,093 2,836
Adjusted beginning shareholders’ equity 19,512 19,488
Ending shareholders’ equity 21,560 20,605
Unrealized net capital gains 1,430 1,093
Adjusted ending shareholders’ equity 20,130 19,512
Average adjusted shareholders’ equity $ 19,821 $ 19,500
Operating income return on equity 23.1% 9.7%
3
The net funded status of our pension and other postretirement benefit plans increased return on equity by
0.6 points as of June 30, 2007.
Book value per share, excluding the impact of unrealized net capital gains on fixed income securities, is
a ratio that uses a non-GAAP measure. It is calculated by dividing shareholders’ equity after excluding the
impact of unrealized net capital gains on fixed income securities and related DAC and life insurance reserves
by total shares outstanding plus dilutive potential shares outstanding. Book value per share is the most
directly comparable GAAP measure.
We use the trend in book value per share, excluding unrealized net capital gains on fixed income securities, in
conjunction with book value per share to identify and analyze the change in net worth attributable to
management efforts between periods. We believe the non-GAAP ratio is useful to investors because it
eliminates the effect of items that can fluctuate significantly from period to period and are generally driven by
economic developments, primarily capital market conditions, the magnitude and timing of which are
generally not influenced by management, and we believe it enhances understanding and comparability of
21
22. performance by highlighting underlying business activity and profitability drivers. We note that book value
per share, excluding unrealized net capital gains on fixed income securities, is a measure commonly used by
insurance investors as a valuation technique. Book value per share, excluding unrealized net capital gains on
fixed income securities, should not be considered as a substitute for book value per share, and does not reflect
the recorded net worth of our business. The following table shows the reconciliation.
As of
June 30,
Est.
2007 2006
(in millions, except per share data)
Book value per share
Numerator:
4
Shareholders’ equity $ 21,560 $ 20,605
Denominator:
Shares outstanding and dilutive potential shares outstanding 592.4 635.4
4
Book value per share $ 36.39 $ 32.43
Book value per share, excluding the impact of unrealized
net capital gains on fixed income securities
Numerator:
Shareholders’ equity $ 21,560 $ 20,605
Unrealized net capital gains on fixed income securities 414 288
Adjusted shareholders’ equity $ 21,146 $ 20,317
Denominator:
Shares outstanding and dilutive potential shares outstanding 592.4 635.4
Book value per share, excluding unrealized net capital gains
on fixed income securities $ 35.70 $ 31.98
4
The net funded status of our pension and other postretirement benefit plans reduced book value per share by $1.78
as of June 30, 2007.
Gross margin1 is comprised of life and annuity premiums and contract charges, and net investment income,
less contract benefits and interest credited to contractholder funds excluding amortization of DSI. Gross
margin also includes periodic settlements and accruals on certain non-hedge derivative instruments (see
additional discussion below under “investment margin”). Gross margin is a component of our evaluation of
the profitability of Allstate Financial’s life insurance and financial product portfolio. Gross margin is
comprised of three components that are utilized to further analyze the business: investment margin1, benefit
margin1, and contract charges and fees. We use gross margin to evaluate the performance of the business.
We believe gross margin and its components are also useful to investors because they allow for the evaluation
of income components separately and in the aggregate when reviewing performance. This actuarial analysis,
which is commonly employed throughout the life insurance industry, measures the difference between
product premiums and accrued policy benefits and net investment income and interest credited to
contractholder funds and insurance reserves. It reveals the integrity and propriety of the pricing assumptions
and financial performance. Additionally, for many of our products, including fixed annuities, variable life,
and interest-sensitive life insurance, the amortization of DAC and DSI is determined based on actual and
expected gross margin. Variability of our results may be caused by this amortization which may be the result
of gross margin variability. The analysis of gross margin and its components separately and in the aggregate
provide transparency to our results of operations. Gross margin, investment margin and benefit margin
should not be considered as a substitute for net income and do not reflect the overall profitability of the
business. Net income is the GAAP measure that is most directly comparable to these margins. Gross margin
is best considered in its context as a component of net income and is presented as such and is reconciled to
Allstate Financial’s GAAP net income in the following table.
22