
Recomendados
Recomendados
Más contenido relacionado
Más de finance7
Más de finance7 (20)
Último
Último (20)
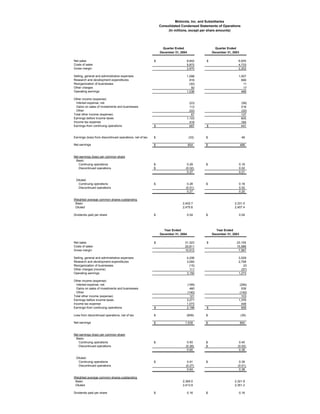
Q4 2004 Earnings Release Financial Tables
- 1. Motorola, Inc. and Subsidiaries Consolidated Condensed Statements of Operations (In millions, except per share amounts) Quarter Ended Quarter Ended December 31, 2004 December 31, 2003 Net sales $ 8,842 $ 6,935 Costs of sales 5,872 4,733 Gross margin 2,970 2,202 Selling, general and administrative expenses 1,098 1,007 Research and development expenditures 816 699 Reorganization of businesses (30) 11 Other charges 50 17 Operating earnings 1,036 468 Other income (expense): Interest expense, net (23) (59) Gains on sales of investments and businesses 112 218 Other (22) (22) Total other income (expense) 67 137 Earnings before income taxes 1,103 605 Income tax expense 416 164 Earnings from continuing operations $ 687 $ 441 Earnings (loss) from discontinued operations, net of tax $ (33) $ 48 Net earnings $ 654 $ 489 Net earnings (loss) per common share Basic: Continuing operations $ 0.29 $ 0.19 Discontinued operations $ (0.02) 0.02 0.27 0.21 Diluted: Continuing operations $ 0.28 $ 0.18 Discontinued operations (0.01) 0.02 0.27 0.20 Weighted average common shares outstanding Basic 2,402.7 2,331.5 Diluted 2,475.6 2,457.4 Dividends paid per share $ 0.04 $ 0.04 Year Ended Year Ended December 31, 2004 December 31, 2003 Net sales $ 31,323 $ 23,155 Costs of sales 20,811 15,588 Gross margin 10,512 7,567 Selling, general and administrative expenses 4,206 3,529 Research and development expenditures 3,060 2,799 Reorganization of businesses (15) 23 Other charges (income) 111 (57) Operating earnings 3,150 1,273 Other income (expense): Interest expense, net (199) (294) Gains on sales of investments and businesses 460 539 Other (140) (142) Total other income (expense) 121 103 Earnings before income taxes 3,271 1,376 Income tax expense 1,073 448 Earnings from continuing operations $ 2,198 $ 928 Loss from discontinued operations, net of tax $ (659) $ (35) Net earnings $ 1,539 $ 893 Net earnings (loss) per common share Basic: Continuing operations $ 0.93 $ 0.40 Discontinued operations (0.28) $ (0.02) 0.65 0.38 Diluted: Continuing operations $ 0.91 $ 0.39 Discontinued operations (0.27) (0.01) 0.64 0.38 Weighted average common shares outstanding Basic 2,365.0 2,321.9 Diluted 2,413.9 2,351.2 Dividends paid per share $ 0.16 $ 0.16
- 2. Motorola, Inc. and Subsidiaries Condensed Consolidated Balance Sheets (In millions) ASSETS December 31, December 31, 2004 2003 Cash and cash equivalents $ 10,556 $ 7,790 Short-term investments 152 139 Accounts receivable, net 4,407 3,822 Inventories, net 2,556 2,099 Deferred income taxes 1,540 1,310 Other current assets 1,700 874 Current assets of discontinued operations - 1,741 Total current assets 20,911 17,775 Property, plant and equipment, net 2,332 2,455 Investments 3,241 3,278 Deferred income taxes 2,349 3,218 Other assets 1,880 2,086 Non-current assets of discontinued operations - 3,154 Total assets $ 30,713 $ 31,966 LIABILITIES AND STOCKHOLDERS' EQUITY Notes payable and current portion of long-term debt $ 717 $ 869 Accounts payable 3,325 2,458 Accrued liabilities 6,352 5,218 Current liabilities of discontinued operations - 756 Total current liabilities 10,394 9,301 Long-term debt 4,578 6,673 Other liabilities 2,407 2,582 Non-current liabilities of discontinued operations - 235 Company-obligated mandatorily redeemable preferred securities of subsidiary trust holding solely company- guaranteed debentures - 486 Stockholders' equity 13,334 12,689 Total liabilities and stockholders' equity $ 30,713 $ 31,966
- 3. Motorola, Inc. and Subsidiaries Segment Information (In millions) Summarized below are the Company's net sales from continuing operations by reportable segment for the quarters and years ended December 31, 2004 and December 31, 2003. Segment Net Sales Quarter Ended Quarter Ended % Change December 31, 2004 December 31, 2003 from 2003 Personal Communications Segment $ 4,947 $ 3,276 51% Global Telecom Solutions Segment 1,389 1,365 2% Commercial, Govt, and Industrial Solutions Segment 1,280 1,237 3% Integrated Electronic Systems Segment 703 669 5% Broadband Communications Segment 691 555 25% Other Products Segment 122 87 40% Adjustments & Eliminations (290) (254) 14% Segment Totals $ 8,842 $ 6,935 27% Segment Net Sales Year Ended Year Ended % Change December 31, 2004 December 31, 2003 from 2003 Personal Communications Segment $ 16,823 $ 10,978 53% Global Telecom Solutions Segment 5,457 4,417 24% Commercial, Govt, and Industrial Solutions Segment 4,588 4,131 11% Integrated Electronic Systems Segment 2,696 2,265 19% Broadband Communications Segment 2,335 1,857 26% Other Products Segment 387 323 20% Adjustments & Eliminations (963) (816) 18% Segment Totals $ 31,323 $ 23,155 35%
- 4. Motorola, Inc. and Subsidiaries Segment Information (In millions) Summarized below are the Company's operating earnings (loss) from continuing operations by reportable segment for the quarters and years ended December 31, 2004 and December 31, 2003. Segment Operating Earnings (Loss) GAAP Results Quarter Ended Quarter Ended December 31, 2004 December 31, 2003 Personal Communications Segment $ 526 $ 127 Global Telecom Solutions Segment 281 138 Commercial, Govt, and Industrial Solutions Segment 207 240 Integrated Electronic Systems Segment 42 66 Broadband Communications Segment 47 (52) Other Products Segment (95) (13) Adjustments & Eliminations 51 (4) Segment Totals 1,059 502 General Corporate (23) (34) Operating Earnings $ 1,036 $ 468 Segment Operating Earnings (Loss) GAAP Results Year Ended Year Ended December 31, 2004 December 31, 2003 Personal Communications Segment $ 1,708 $ 479 Global Telecom Solutions Segment 761 247 Commercial, Govt, and Industrial Solutions Segment 753 562 Integrated Electronic Systems Segment 147 161 Broadband Communications Segment 125 (38) Other Products Segment (229) (44) Adjustments & Eliminations 47 3 Segment Totals 3,312 1,370 General Corporate (162) (97) Operating Earnings $ 3,150 $ 1,273