SlideShare una empresa de Scribd logo
1 de 4
Descargar para leer sin conexión
Pro Forma Cable Customer Metrics
(Customers and boxes in thousands, except per customer data; unaudited)
                                                                                            2007                                                   2008
                                                                        1Q        2Q         3Q         4Q         FY         1Q         2Q         3Q         4Q         FY
                 1
Homes Passed                                                            48,977    49,232     49,457     49,701     49,701     49,902     50,096     50,329     50,575     50,575
Total Video
  Total Video Customers                                                 25,015    24,914     24,858     24,758     24,758     24,701     24,563     24,415     24,182     24,182
  Total Video Penetration of Homes Passed2                               51.1%     50.6%      50.3%      49.8%      49.8%      49.5%      49.0%      48.5%      47.8%      47.8%
  Total Video Net Additions (Losses)                                        83      (101)       (56)      (100)      (174)       (57)      (138)      (148)      (233)      (575)
  Digital Video Customers                                               13,671    14,494     14,997     15,527     15,527     16,021     16,341     16,758     17,004     17,004
  Digital Penetration of Total Video                                     54.7%     58.2%      60.3%      62.7%      62.7%      64.9%      66.5%      68.6%      70.3%      70.3%
  Digital Video Additions                                                  658       823        503        530      2,514        494        320        417        247      1,478
  Digital Set-Top Boxes                                                 21,128    23,192     24,124     24,964     24,964     25,863     26,352     27,068     27,544     27,544
  Boxes per Digital Customer                                               1.5       1.6        1.6        1.6        1.6        1.6        1.6        1.6        1.6        1.6
  Advanced Services Customers3                                           5,199     5,648      5,986      6,458      6,458      6,909      6,982      7,293      7,725      7,725
  Advanced Services Penetration of Total Video                           20.8%     22.7%      24.1%      26.1%      26.1%      28.0%      28.4%      29.9%      31.9%      31.9%
  Advanced Services Penetration of Digital Video                         38.0%     39.0%      39.9%      41.6%      41.6%      43.1%      42.7%      43.5%      45.4%      45.4%

High-Speed Internet (HSI)
  HSI Customers                                                         12,439    12,778     13,252     13,593     13,593     14,085     14,364     14,745     14,929     14,929
                        4
  HSI quot;Availablequot; Homes                                                 48,503    48,767     49,081     49,327     49,327     49,548     49,745     49,982     50,283     50,283
                                      2
  HSI Penetration of quot;Availablequot; Homes                                   25.6%     26.2%      27.0%      27.6%      27.6%      28.4%      28.9%      29.5%      29.7%      29.7%
  HSI Net Additions                                                        586       339        474        341      1,740        492        279        382        184      1,336

Voice
  Comcast Digital Voice (CDV) Customers                                  2,459     3,150      3,831      4,449      4,449      5,088      5,643      6,127      6,470      6,470
  Circuit-Switched Voice Customers                                         560       443        304        176        176         66         10          7          3          3
  Total Voice Customers                                                  3,018     3,593      4,135      4,625      4,625      5,154      5,654      6,133      6,473      6,473
  CDV quot;Availablequot; Homes4                                                36,069    38,873     41,395     43,032     43,032     44,082     45,143     46,083     46,687     46,687
                                      2
  CDV Penetration of quot;Availablequot; Homes                                    6.8%      8.1%       9.3%      10.3%      10.3%      11.5%      12.5%      13.3%      13.9%      13.9%
  CDV Net Additions                                                        587       692        681        618      2,577        639        555        483        344      2,021

Combined Video, HSI and Voice Customers                                 40,472    41,284     42,244     42,976     42,976     43,940     44,580     45,294     45,584     45,584
  Combined Video, HSI and Voice Net Additions                            1,163       812        960        732      3,667        964        640        714        290      2,609

Total Revenue Generating Units (includes Digital Video Customers)5      54,142    55,778     57,241     58,502     58,502     59,961     60,921     62,051     62,588     62,588
  RGU Net Adds                                                           1,821     1,636      1,462      1,262      6,181      1,459        960      1,131        537      4,086

Average Monthly Revenue per Video Customer                              $96.27   $100.90    $101.70    $104.25    $101.03    $106.70    $109.61    $110.67    $113.80    $110.48


    See notes on page 4. Minor differences may exist due to rounding.                                                                                                       1
Pro Forma Revenue and Pro Forma Expenses
($ in millions; unaudited)
                                                                                           2007                                               2008
                                                                     1Q         2Q          3Q       4Q         FY        1Q        2Q         3Q       4Q         FY
Revenue
  Video6                                                             $4,491     $4,597     $4,519    $4,578    $18,185    $4,706    $4,726    $4,681    $4,736    $18,849
  High-Speed Internet                                                $1,569     $1,632     $1,666    $1,703     $6,570    $1,750    $1,792    $1,822    $1,861     $7,225
  Voice                                                                $356       $425       $479      $533     $1,793      $587      $640      $690      $732     $2,649
  Advertising                                                          $322       $410       $417      $429     $1,578      $344      $399      $374      $409     $1,526
  Other7                                                               $268       $281       $299      $299     $1,147      $305      $316      $336      $326     $1,283
  Franchise Fees                                                       $206       $212       $213      $216       $847      $224      $227      $228      $232       $911
Total Cable Segment *                                                $7,212     $7,557     $7,593    $7,758    $30,120    $7,916    $8,100    $8,131    $8,296    $32,443
  Advertising                                                         $125       $157        $156     $139        $577     $154      $170       $146     $143        $613
  Affiliate                                                           $148       $145        $139     $165        $597     $156      $155       $158     $163        $632
  Other8                                                               $29        $32         $35      $44        $140      $53       $41        $43      $44        $181
Total Programming Segment                                             $302       $334        $330     $348      $1,314     $363      $366       $347     $350      $1,426
Corporate & Other                                                      $88        $48         $51      $89       $276      $110       $87        $71     $119       $387
Total Consolidated Revenue                                           $7,602     $7,939     $7,974    $8,195    $31,710    $8,389    $8,553    $8,549    $8,765    $34,256
Operating Expense
  Video Programming                                                  $1,495     $1,507     $1,455    $1,530     $5,987    $1,619    $1,611    $1,617    $1,632     $6,479
  High-Speed Internet                                                  $142       $148       $148      $148       $586      $138      $136      $131      $118       $523
  Voice                                                                $168       $158       $191      $180       $697      $200      $182      $179      $169       $730
  Technical Labor                                                      $469       $475       $512      $479     $1,935      $523      $516      $559      $540     $2,138
  Other (includes Franchise Fees)                                      $613       $622       $639      $664     $2,538      $683      $696      $696      $719     $2,794
Total Cable Operating Expense 9                                      $2,887     $2,910     $2,945    $3,001    $11,743    $3,163    $3,141    $3,182    $3,178    $12,664
  Customer Service                                                     $417       $426       $445      $420     $1,708      $442      $434      $443      $454     $1,773
  Marketing                                                            $322       $365       $387      $358     $1,432      $399      $411      $426      $389     $1,625
  Administrative and Other 10                                          $710       $732       $766      $783     $2,991      $770      $752      $829      $860     $3,211
Total Cable SG&A                                                     $1,449     $1,523     $1,598    $1,561     $6,131    $1,611    $1,597    $1,698    $1,703     $6,609
Total Cable Segment                                                  $4,336     $4,433     $4,543    $4,562    $17,874    $4,774    $4,738    $4,880    $4,881    $19,273
Total Programming Segment                                             $237       $259        $233     $299      $1,028     $250      $277       $242     $295      $1,064
Corporate and Other                                                   $184       $141        $194     $180       $699      $191      $187       $190     $219       $787
Total Consolidated Operating Expense                                 $4,757     $4,833     $4,970    $5,041    $19,601    $5,215    $5,202    $5,312    $5,395    $21,124
Operating Cash Flow (OCF)                 11

  Cable                                                              $2,876     $3,124     $3,050    $3,196    $12,246    $3,142    $3,362    $3,251    $3,415    $13,170
  Programming                                                           $65        $75        $97       $49       $286      $113       $89      $105       $55       $362
  Corporate & Other                                                    ($96)      ($93)     ($143)     ($91)     ($423)     ($81)    ($100)    ($119)    ($100)     ($400)
Total Consolidated OCF                                               $2,845     $3,106     $3,004    $3,154    $12,109    $3,174    $3,351    $3,237    $3,370    $13,132
  Cable                                                               39.9%      41.3%      40.2%     41.2%      40.7%     39.7%     41.5%     40.0%     41.2%      40.6%
  Programming                                                         21.3%      22.7%      29.3%     14.3%      21.8%     31.2%     24.2%     30.3%     15.7%      25.4%
Total Consolidated OCF Margin                                         37.4%      39.1%      37.7%     38.5%      38.2%     37.8%     39.2%     37.9%     38.5%      38.3%
* Business Services Revenue (included in Cable service revenues)          $87        $95      $102     $110       $394      $120      $131       $145     $162       $558

 See notes on page 4. Minor differences may exist due to rounding.                                                                                                      2
Pro Forma Capital Expenditures and Free Cash Flow
($ and shares in millions, except per share data; unaudited)
                                                                                                                      2007                                                                            2008
                                                                                         1Q             2Q             3Q              4Q             FY                1Q             2Q              3Q             4Q         FY
Capital Expenditures
Growth Capital
  Customer Premise Equipment (CPE)                                                        $751           $804           $701            $660          $2,916             $819            $687            $590          $775      $2,871
  Scalable Infrastructure                                                                 $109           $113             $98             $91          $411                $59            $55             $61            $80      $255
  Line Extensions                                                                           $88          $100             $99             $78          $365                $48            $52             $54            $58      $212
  Support Capital                                                                           $70          $110             $99             $89          $368                $54            $57             $65          $102       $278
  Upgrades (Capacity Expansion)                                                             $22            $27            $28             $42          $119                $21            $25             $13             $8        $67
  Business Services                                                                         $17            $21            $22             $50          $110                $50            $48             $61            $72      $231
Total Growth Capital                                                                     $1,057         $1,175         $1,047          $1,010         $4,289            $1,051           $924            $844         $1,095     $3,914
Maintenance Capital
  CPE                                                                                       $66            $77            $84             $77          $304                $58            $73             $76            $69      $276
  Scalable Infrastructure                                                                  $175           $151           $140            $172          $638               $103           $115            $194           $269      $681
  Support Capital                                                                           $63            $99            $99             $69          $330                $43            $58             $54            $72      $227
  Upgrades                                                                                 $109            $90           $129            $138          $466                $60            $58             $81           $141      $340
Total Maintenance Capital                                                                  $413           $417           $452            $456         $1,738 #            $264           $304            $405           $551     $1,524
Strategic/Discretionary Capital                                                             $10             $23            $29            $27            $89                $40            $26            $19             $22     $107
                        12
Total Cable Segment                                                                      $1,480         $1,615         $1,528          $1,493         $6,116            $1,355         $1,254          $1,268         $1,668     $5,545
Total Programming Segment                                                                     $4            $10              $8           $13              $35               $4             $6            $12             $22         $44
Corporate and Other                                                                           $7             $8            $26            $89           $130                $72            $40            $26             $23     $161
Total Consolidated Capital Expenditures                                                  $1,491         $1,633         $1,562          $1,595         $6,281            $1,431         $1,300          $1,306         $1,713     $5,750
  Percent of Total Consolidated Revenue                                                   19.6%          20.6%          19.6%           19.5%          19.8%             17.1%          15.2%           15.3%          19.5%      16.8%

Free Cash Flow13
Net Cash Provided by Operating Activities                                                $1,965         $1,942         $1,598          $2,684         $8,189            $2,259         $2,669          $2,445         $2,858    $10,231
Capital Expenditures                                                                    ($1,454)       ($1,604)       ($1,526)        ($1,574)       ($6,158)          ($1,431)       ($1,300)        ($1,306)       ($1,713)   ($5,750)
Cash Paid for Capitalized Software                                                         ($88)          ($86)          ($60)           ($77)         ($311)             ($99)          ($88)          ($100)         ($123)     ($410)
Cash Paid for Other Intangible Assets                                                      ($30)          ($25)          ($24)           ($16)          ($95)             ($27)          ($31)           ($31)          ($28)     ($117)
Adjustments for Payment of Tax on Nonoperating Items14                                      $49           $141           $536             ($9)         $717                 $0           $228             $88           ($13)      $303
Free Cash Flow (Including 2008 Economic Stimulus Package)                                  $442           $368           $524          $1,008         $2,342              $702         $1,478          $1,096           $981     $4,257
  2008 Economic Stimulus Package *                                                           $0             $0             $0              $0             $0                $0          ($315)          ($168)         ($117)     ($600)
Free Cash Flow                                                                             $442           $368           $524          $1,008         $2,342              $702         $1,163            $928           $864     $3,657
Free Cash Flow per Share                                                                  $0.14          $0.12           $0.17          $0.33          $0.75             $0.23           $0.39          $0.32          $0.30      $1.24
Diluted weighted-average number of common shares                                          3,161          3,147           3,118          3,078          3,129             3,017           2,970          2,920          2,888      2,952


*Our definition of Free Cash Flow remains unchanged and specifically excludes any impact from the 2008 Economic Stimulus package. These amounts have been excluded from Free Cash Flow to provide an appropriate comparison.


   See notes on page 4. Minor differences may exist due to rounding.                                                                                                                                                                  3
Notes

Basis of Presentation:
       All data, except Free Cash Flow, is presented on a pro forma basis. Pro forma data is adjusted only for timing of acquisitions or dispositions and does not include adjustments for costs related to integration activities, cost savings or synergies that have been or may be achieved by
       the combined businesses. Pro forma financial data includes the results of Comcast SportsNet Bay Area and Comcast SportsNet New England acquired on June 30, 2007, the cable system acquired from Patriot Media Holdings, LLC on August 31, 2007, and the cable systems
       resulting from the dissolution of the Insight Midwest Partnership on January 1, 2008. Pro forma results are presented as if the acquisitions and dispositions were effective on January 1, 2007. The net impact of these transactions was an increase of 765,000 video customers. Pro
       forma customer data also includes 7,000 video customers acquired through an acquisition on November 21, 2008. The impact of this acquisition on our segment operating results was not material. Please refer to our earnings release for a reconciliation of pro forma financial data.


         All percentages are calculated on whole numbers.

Notes:
    1) Homes are considered passed (“homes passed”) if we can connect them to our distribution system without further extending the transmission lines. In the case of certain multiple dwelling units (“MDUs”), such as apartment buildings and condominium complexes, homes passed are
       counted on an adjusted basis. Homes passed are an estimate based on the best available information. Homes passed and quot;availablequot; homes do not include the number of small and medium sized businesses passed which cannot be reasonably estimated at this time.


    2) Penetration is calculated by dividing the number of customers by the number of homes passed or available homes, as appropriate. The number of customers includes our small and medium-sized business customers.

    3) Advanced Services Customers subscribe to DVR and/or HDTV services.

    4) Homes are considered available (“available” homes) if we can connect them to our distribution system without further upgrading the transmission lines and if we offer the service in that area.

    5) Revenue Generating Units (RGUs) represents the sum of video and digital video, high-speed Internet and net voice customers, excluding additional outlets. Subscriptions to DVR and/or HDTV services do not result in additional RGUs.

    6) Cable Video Revenue consists of our limited analog, expanded analog service, digital, premium, pay-per-view and equipment services.

    7) Other Cable Revenue includes regional sports programming networks, residential video installation revenue, guide revenue, commissions from electronic retailing networks, other product offerings and revenue of our digital media center.

    8) Other Programming Revenue primarily consists of international and Internet revenue.

    9) Total Cable Operating Expense consists of video programming expense, technical labor costs, high-speed Internet and voice expense and other operating expense.

         Video Programming Expense, our largest operating expense, is the fees we pay to programming networks to license the programming we package, offer and distribute to our video customers.

         High-speed Internet Expense and Voice Expense include certain direct costs identified by us for providing these services. Other related costs associated with providing these services are generally shared among all our cable services and are not allocated to these captions.


         Technical Labor Costs include the internal and external labor to complete service call and installation activities in the home, network operations, fulfillment and provisioning costs.

         Other Operating Expense includes franchise fees, pole rentals, plant maintenance and vehicle-related costs, including fuel, as well as expenses related to our regional sports networks.

   10) Cable Administrative and Other Expense consists of administrative personnel expense, bad debt expense, building and office expense, billing costs, insurance expense, property taxes, and severance costs of approximately $39 million in 3Q08, $63 million in 4Q08, and $126 million
       for the full year 2008 related to staff reductions and a divisional reorganization.

   11) See Exhibit 99.2, Explanation of Non-GAAP and Other Financial Measures, to Comcast's Form 8-K (Quarterly Earnings Release), for the definition of Operating Cash Flow.

   12) Management evaluates Cable capital expenditures by categorizing investments into three groups: Growth, Maintenance and Strategic/Discretionary. Growth is directly tied to revenue generation and represents the costs required to secure new customers, revenue units or
       additional bandwidth revenues. Maintenance includes investments that allow the company to maintain its competitive position and provide a foundation for growth. Strategic/Discretionary includes investments that lay the groundwork for future products and services, such as our
       investments in interactive advertising, cross-platform product development or switched digital video.

         CPE includes costs incurred at the customer residence to secure new customers, revenue units and additional bandwidth revenues (e.g. digital converters).

         Scalable infrastructures includes costs, not CPE or network related to secure growth of new customers, revenue units and additional bandwidth revenues or provide service enhancements (e.g. headend equipment).

         Line extensions include network costs associated with entering new service areas (e.g. fiber/coaxial cable).

         Support capital includes costs associated with the replacement or enhancement of non-network assets due to obsolescence and wear out (e.g. non-network equipment, land, buildings and vehicles).

         Upgrades include costs to enhance or replace existing fiber/coaxial cable networks, including network improvements.

         Business Services includes fiber/coax extension, electronics, CPE and costs to secure new customers.

         To be consistent with our current management reporting presentation, certain capital expenditures within the cable segment have been reclassified.

   13) Free Cash Flow is not presented on a pro forma basis. See Exhibit 99.2, Explanation of Non-GAAP and Other Financial Measures, to Comcast's Form 8-K (Quarterly Earnings Release), for the definition of Free Cash Flow.

   14) Payment of Tax on Nonoperating Items in 3Q07 includes $320 million payment of tax on prior year audits, $160 million payment of tax on nonoperating items and $56 million payment of tax related to acquired companies.

Más contenido relacionado

Destacado

GMAC Executive Vice President and Chief Financial Officer Sanjiv Khattri.
GMAC Executive Vice President and Chief Financial Officer Sanjiv Khattri.GMAC Executive Vice President and Chief Financial Officer Sanjiv Khattri.
GMAC Executive Vice President and Chief Financial Officer Sanjiv Khattri.finance8
 
comcast Financial Highlights 2006
comcast Financial Highlights  2006comcast Financial Highlights  2006
comcast Financial Highlights 2006finance8
 
Como Nace Un Paradigmajb
Como Nace Un ParadigmajbComo Nace Un Paradigmajb
Como Nace Un ParadigmajbMireia Buchaca
 
Peer to Peer Catuxa
Peer to Peer CatuxaPeer to Peer Catuxa
Peer to Peer Catuxacatuxart
 
Wonderland - e15
Wonderland - e15Wonderland - e15
Wonderland - e15jitze
 

Destacado (7)

GMAC Executive Vice President and Chief Financial Officer Sanjiv Khattri.
GMAC Executive Vice President and Chief Financial Officer Sanjiv Khattri.GMAC Executive Vice President and Chief Financial Officer Sanjiv Khattri.
GMAC Executive Vice President and Chief Financial Officer Sanjiv Khattri.
 
comcast Financial Highlights 2006
comcast Financial Highlights  2006comcast Financial Highlights  2006
comcast Financial Highlights 2006
 
Consejosdeamor
ConsejosdeamorConsejosdeamor
Consejosdeamor
 
Como Nace Un Paradigmajb
Como Nace Un ParadigmajbComo Nace Un Paradigmajb
Como Nace Un Paradigmajb
 
Df Los Incas
Df Los IncasDf Los Incas
Df Los Incas
 
Peer to Peer Catuxa
Peer to Peer CatuxaPeer to Peer Catuxa
Peer to Peer Catuxa
 
Wonderland - e15
Wonderland - e15Wonderland - e15
Wonderland - e15
 

Similar a comcast Trending Schedules

virgin media. FINAL_VM_Q208_Press_Release
virgin media. FINAL_VM_Q208_Press_Releasevirgin media. FINAL_VM_Q208_Press_Release
virgin media. FINAL_VM_Q208_Press_Releasefinance28
 
virgin media. FINAL_VM_Q208_Press_Release
virgin media. FINAL_VM_Q208_Press_Releasevirgin media. FINAL_VM_Q208_Press_Release
virgin media. FINAL_VM_Q208_Press_Releasefinance28
 
virgin media. Q3_07_PressRelease
virgin media. Q3_07_PressReleasevirgin media. Q3_07_PressRelease
virgin media. Q3_07_PressReleasefinance28
 
virgin media. 5F9EF289-C398-4329-BA49-891BADC51F1D_FINAL_VM_Q4-08_Press_Release
virgin media. 5F9EF289-C398-4329-BA49-891BADC51F1D_FINAL_VM_Q4-08_Press_Releasevirgin media. 5F9EF289-C398-4329-BA49-891BADC51F1D_FINAL_VM_Q4-08_Press_Release
virgin media. 5F9EF289-C398-4329-BA49-891BADC51F1D_FINAL_VM_Q4-08_Press_Releasefinance28
 
virgin media. FINAL_VM_Q308_Press_Release
virgin media. FINAL_VM_Q308_Press_Releasevirgin media. FINAL_VM_Q308_Press_Release
virgin media. FINAL_VM_Q308_Press_Releasefinance28
 
virgin media. FINAL_VM_Q308_Press_Release
virgin media. FINAL_VM_Q308_Press_Releasevirgin media. FINAL_VM_Q308_Press_Release
virgin media. FINAL_VM_Q308_Press_Releasefinance28
 
virgin media. q42007_final
virgin media. q42007_finalvirgin media. q42007_final
virgin media. q42007_finalfinance28
 
virgin media. _q42007_final
virgin media. _q42007_finalvirgin media. _q42007_final
virgin media. _q42007_finalfinance28
 
national oilwell varco Fourth Quarter 2008 Segmented Financial Data
national oilwell varco Fourth Quarter 2008 Segmented Financial Datanational oilwell varco Fourth Quarter 2008 Segmented Financial Data
national oilwell varco Fourth Quarter 2008 Segmented Financial Datafinance40
 
virgin media._Q2-07_Press_Release
 virgin media._Q2-07_Press_Release virgin media._Q2-07_Press_Release
virgin media._Q2-07_Press_Releasefinance28
 
virgin media.FINAL_VM_Q2-07_Press_Release
virgin media.FINAL_VM_Q2-07_Press_Releasevirgin media.FINAL_VM_Q2-07_Press_Release
virgin media.FINAL_VM_Q2-07_Press_Releasefinance28
 
Cr2 apimec final eng
Cr2 apimec final engCr2 apimec final eng
Cr2 apimec final engSiteriCR2
 
virgin media. _q12008_final
virgin media. _q12008_finalvirgin media. _q12008_final
virgin media. _q12008_finalfinance28
 
virgin media. _q12008_final
virgin media. _q12008_finalvirgin media. _q12008_final
virgin media. _q12008_finalfinance28
 
Erin Parker Atvidcf V1
Erin Parker Atvidcf V1Erin Parker Atvidcf V1
Erin Parker Atvidcf V1Caneskid05
 
CHRSA P&L
CHRSA P&LCHRSA P&L
CHRSA P&Lmmazner
 
Cr2 out 2010-eng
Cr2 out 2010-engCr2 out 2010-eng
Cr2 out 2010-engSiteriCR2
 
Cr2 presentation jan-11
Cr2 presentation   jan-11Cr2 presentation   jan-11
Cr2 presentation jan-11SiteriCR2
 
virgin media.FINAL_VM_Q1_07_Press_Release
virgin media.FINAL_VM_Q1_07_Press_Releasevirgin media.FINAL_VM_Q1_07_Press_Release
virgin media.FINAL_VM_Q1_07_Press_Releasefinance28
 

Similar a comcast Trending Schedules (20)

virgin media. FINAL_VM_Q208_Press_Release
virgin media. FINAL_VM_Q208_Press_Releasevirgin media. FINAL_VM_Q208_Press_Release
virgin media. FINAL_VM_Q208_Press_Release
 
virgin media. FINAL_VM_Q208_Press_Release
virgin media. FINAL_VM_Q208_Press_Releasevirgin media. FINAL_VM_Q208_Press_Release
virgin media. FINAL_VM_Q208_Press_Release
 
virgin media. Q3_07_PressRelease
virgin media. Q3_07_PressReleasevirgin media. Q3_07_PressRelease
virgin media. Q3_07_PressRelease
 
virgin media. 5F9EF289-C398-4329-BA49-891BADC51F1D_FINAL_VM_Q4-08_Press_Release
virgin media. 5F9EF289-C398-4329-BA49-891BADC51F1D_FINAL_VM_Q4-08_Press_Releasevirgin media. 5F9EF289-C398-4329-BA49-891BADC51F1D_FINAL_VM_Q4-08_Press_Release
virgin media. 5F9EF289-C398-4329-BA49-891BADC51F1D_FINAL_VM_Q4-08_Press_Release
 
virgin media. 5F9EF289-C398-4329-BA49-891BADC51F1D_FINAL_VM_Q4-08_Press_Release
virgin media. 5F9EF289-C398-4329-BA49-891BADC51F1D_FINAL_VM_Q4-08_Press_Releasevirgin media. 5F9EF289-C398-4329-BA49-891BADC51F1D_FINAL_VM_Q4-08_Press_Release
virgin media. 5F9EF289-C398-4329-BA49-891BADC51F1D_FINAL_VM_Q4-08_Press_Release
 
virgin media. FINAL_VM_Q308_Press_Release
virgin media. FINAL_VM_Q308_Press_Releasevirgin media. FINAL_VM_Q308_Press_Release
virgin media. FINAL_VM_Q308_Press_Release
 
virgin media. FINAL_VM_Q308_Press_Release
virgin media. FINAL_VM_Q308_Press_Releasevirgin media. FINAL_VM_Q308_Press_Release
virgin media. FINAL_VM_Q308_Press_Release
 
virgin media. q42007_final
virgin media. q42007_finalvirgin media. q42007_final
virgin media. q42007_final
 
virgin media. _q42007_final
virgin media. _q42007_finalvirgin media. _q42007_final
virgin media. _q42007_final
 
national oilwell varco Fourth Quarter 2008 Segmented Financial Data
national oilwell varco Fourth Quarter 2008 Segmented Financial Datanational oilwell varco Fourth Quarter 2008 Segmented Financial Data
national oilwell varco Fourth Quarter 2008 Segmented Financial Data
 
virgin media._Q2-07_Press_Release
 virgin media._Q2-07_Press_Release virgin media._Q2-07_Press_Release
virgin media._Q2-07_Press_Release
 
virgin media.FINAL_VM_Q2-07_Press_Release
virgin media.FINAL_VM_Q2-07_Press_Releasevirgin media.FINAL_VM_Q2-07_Press_Release
virgin media.FINAL_VM_Q2-07_Press_Release
 
Cr2 apimec final eng
Cr2 apimec final engCr2 apimec final eng
Cr2 apimec final eng
 
virgin media. _q12008_final
virgin media. _q12008_finalvirgin media. _q12008_final
virgin media. _q12008_final
 
virgin media. _q12008_final
virgin media. _q12008_finalvirgin media. _q12008_final
virgin media. _q12008_final
 
Erin Parker Atvidcf V1
Erin Parker Atvidcf V1Erin Parker Atvidcf V1
Erin Parker Atvidcf V1
 
CHRSA P&L
CHRSA P&LCHRSA P&L
CHRSA P&L
 
Cr2 out 2010-eng
Cr2 out 2010-engCr2 out 2010-eng
Cr2 out 2010-eng
 
Cr2 presentation jan-11
Cr2 presentation   jan-11Cr2 presentation   jan-11
Cr2 presentation jan-11
 
virgin media.FINAL_VM_Q1_07_Press_Release
virgin media.FINAL_VM_Q1_07_Press_Releasevirgin media.FINAL_VM_Q1_07_Press_Release
virgin media.FINAL_VM_Q1_07_Press_Release
 

Más de finance8

alcoa 1Q08 Analyst Presentation
alcoa 1Q08 Analyst Presentation alcoa 1Q08 Analyst Presentation
alcoa 1Q08 Analyst Presentation finance8
 
alcoa 2Q08 Analyst Presentation
alcoa  	2Q08 Analyst Presentationalcoa  	2Q08 Analyst Presentation
alcoa 2Q08 Analyst Presentationfinance8
 
alcoa 3Q08 Analyst Presentation
alcoa 3Q08 Analyst Presentation alcoa 3Q08 Analyst Presentation
alcoa 3Q08 Analyst Presentation finance8
 
alcoa 4Q08 Analyst Presentation
alcoa  	4Q08 Analyst Presentation alcoa  	4Q08 Analyst Presentation
alcoa 4Q08 Analyst Presentation finance8
 
alcoa 2008 meeting presentation
alcoa 2008 meeting presentationalcoa 2008 meeting presentation
alcoa 2008 meeting presentationfinance8
 
Alcoa endorses The Business Roundtable Principles of Corporate
Alcoa endorses The Business Roundtable Principles of Corporate Alcoa endorses The Business Roundtable Principles of Corporate
Alcoa endorses The Business Roundtable Principles of Corporate finance8
 
alcoa Annual Reports 1996
alcoa Annual Reports 1996alcoa Annual Reports 1996
alcoa Annual Reports 1996finance8
 
alcoa Annual Reports 1997
alcoa Annual Reports 1997alcoa Annual Reports 1997
alcoa Annual Reports 1997finance8
 
alcoa Annual Reports 1998
alcoa Annual Reports 1998alcoa Annual Reports 1998
alcoa Annual Reports 1998finance8
 
alcoa Annual Reports 1999
alcoa Annual Reports 1999alcoa Annual Reports 1999
alcoa Annual Reports 1999finance8
 
alcoa Annual Reports 2000
alcoa Annual Reports 2000alcoa Annual Reports 2000
alcoa Annual Reports 2000finance8
 
alcoa Annual Reports 2001
alcoa Annual Reports 2001alcoa Annual Reports 2001
alcoa Annual Reports 2001finance8
 
alcoa Annual Reports 2002
alcoa Annual Reports 2002alcoa Annual Reports 2002
alcoa Annual Reports 2002finance8
 
alcoa Annual Reports 2003
alcoa Annual Reports 2003alcoa Annual Reports 2003
alcoa Annual Reports 2003finance8
 
alcoa Annual Reports 2004
alcoa Annual Reports 2004alcoa Annual Reports 2004
alcoa Annual Reports 2004finance8
 
alcoa Annual Reports 2005
alcoa Annual Reports 2005alcoa Annual Reports 2005
alcoa Annual Reports 2005finance8
 
alcoa Annual Reports 2006
alcoa Annual Reports 2006alcoa Annual Reports 2006
alcoa Annual Reports 2006finance8
 
alcoa Annual Reports 2007
alcoa Annual Reports 2007alcoa Annual Reports 2007
alcoa Annual Reports 2007finance8
 
comcast Annual Report on Form 10-K
 comcast Annual Report on Form 10-K   comcast Annual Report on Form 10-K
comcast Annual Report on Form 10-K finance8
 
comcast Annual Report to Shareholders
 comcast Annual Report to Shareholders  comcast Annual Report to Shareholders
comcast Annual Report to Shareholders finance8
 

Más de finance8 (20)

alcoa 1Q08 Analyst Presentation
alcoa 1Q08 Analyst Presentation alcoa 1Q08 Analyst Presentation
alcoa 1Q08 Analyst Presentation
 
alcoa 2Q08 Analyst Presentation
alcoa  	2Q08 Analyst Presentationalcoa  	2Q08 Analyst Presentation
alcoa 2Q08 Analyst Presentation
 
alcoa 3Q08 Analyst Presentation
alcoa 3Q08 Analyst Presentation alcoa 3Q08 Analyst Presentation
alcoa 3Q08 Analyst Presentation
 
alcoa 4Q08 Analyst Presentation
alcoa  	4Q08 Analyst Presentation alcoa  	4Q08 Analyst Presentation
alcoa 4Q08 Analyst Presentation
 
alcoa 2008 meeting presentation
alcoa 2008 meeting presentationalcoa 2008 meeting presentation
alcoa 2008 meeting presentation
 
Alcoa endorses The Business Roundtable Principles of Corporate
Alcoa endorses The Business Roundtable Principles of Corporate Alcoa endorses The Business Roundtable Principles of Corporate
Alcoa endorses The Business Roundtable Principles of Corporate
 
alcoa Annual Reports 1996
alcoa Annual Reports 1996alcoa Annual Reports 1996
alcoa Annual Reports 1996
 
alcoa Annual Reports 1997
alcoa Annual Reports 1997alcoa Annual Reports 1997
alcoa Annual Reports 1997
 
alcoa Annual Reports 1998
alcoa Annual Reports 1998alcoa Annual Reports 1998
alcoa Annual Reports 1998
 
alcoa Annual Reports 1999
alcoa Annual Reports 1999alcoa Annual Reports 1999
alcoa Annual Reports 1999
 
alcoa Annual Reports 2000
alcoa Annual Reports 2000alcoa Annual Reports 2000
alcoa Annual Reports 2000
 
alcoa Annual Reports 2001
alcoa Annual Reports 2001alcoa Annual Reports 2001
alcoa Annual Reports 2001
 
alcoa Annual Reports 2002
alcoa Annual Reports 2002alcoa Annual Reports 2002
alcoa Annual Reports 2002
 
alcoa Annual Reports 2003
alcoa Annual Reports 2003alcoa Annual Reports 2003
alcoa Annual Reports 2003
 
alcoa Annual Reports 2004
alcoa Annual Reports 2004alcoa Annual Reports 2004
alcoa Annual Reports 2004
 
alcoa Annual Reports 2005
alcoa Annual Reports 2005alcoa Annual Reports 2005
alcoa Annual Reports 2005
 
alcoa Annual Reports 2006
alcoa Annual Reports 2006alcoa Annual Reports 2006
alcoa Annual Reports 2006
 
alcoa Annual Reports 2007
alcoa Annual Reports 2007alcoa Annual Reports 2007
alcoa Annual Reports 2007
 
comcast Annual Report on Form 10-K
 comcast Annual Report on Form 10-K   comcast Annual Report on Form 10-K
comcast Annual Report on Form 10-K
 
comcast Annual Report to Shareholders
 comcast Annual Report to Shareholders  comcast Annual Report to Shareholders
comcast Annual Report to Shareholders
 

Último

Call Girls Rajgurunagar Call Me 7737669865 Budget Friendly No Advance Booking
Call Girls Rajgurunagar Call Me 7737669865 Budget Friendly No Advance BookingCall Girls Rajgurunagar Call Me 7737669865 Budget Friendly No Advance Booking
Call Girls Rajgurunagar Call Me 7737669865 Budget Friendly No Advance Bookingroncy bisnoi
 
VIP Independent Call Girls in Mira Bhayandar 🌹 9920725232 ( Call Me ) Mumbai ...
VIP Independent Call Girls in Mira Bhayandar 🌹 9920725232 ( Call Me ) Mumbai ...VIP Independent Call Girls in Mira Bhayandar 🌹 9920725232 ( Call Me ) Mumbai ...
VIP Independent Call Girls in Mira Bhayandar 🌹 9920725232 ( Call Me ) Mumbai ...dipikadinghjn ( Why You Choose Us? ) Escorts
 
Mira Road Awesome 100% Independent Call Girls NUmber-9833754194-Dahisar Inter...
Mira Road Awesome 100% Independent Call Girls NUmber-9833754194-Dahisar Inter...Mira Road Awesome 100% Independent Call Girls NUmber-9833754194-Dahisar Inter...
Mira Road Awesome 100% Independent Call Girls NUmber-9833754194-Dahisar Inter...priyasharma62062
 
Call Girls Service Pune ₹7.5k Pick Up & Drop With Cash Payment 9352852248 Cal...
Call Girls Service Pune ₹7.5k Pick Up & Drop With Cash Payment 9352852248 Cal...Call Girls Service Pune ₹7.5k Pick Up & Drop With Cash Payment 9352852248 Cal...
Call Girls Service Pune ₹7.5k Pick Up & Drop With Cash Payment 9352852248 Cal...roshnidevijkn ( Why You Choose Us? ) Escorts
 
Business Principles, Tools, and Techniques in Participating in Various Types...
Business Principles, Tools, and Techniques  in Participating in Various Types...Business Principles, Tools, and Techniques  in Participating in Various Types...
Business Principles, Tools, and Techniques in Participating in Various Types...jeffreytingson
 
(Sexy Sheela) Call Girl Mumbai Call Now 👉9920725232👈 Mumbai Escorts 24x7
(Sexy Sheela) Call Girl Mumbai Call Now 👉9920725232👈 Mumbai Escorts 24x7(Sexy Sheela) Call Girl Mumbai Call Now 👉9920725232👈 Mumbai Escorts 24x7
(Sexy Sheela) Call Girl Mumbai Call Now 👉9920725232👈 Mumbai Escorts 24x7jayawati511
 
Top Rated Pune Call Girls Dighi ⟟ 6297143586 ⟟ Call Me For Genuine Sex Servi...
Top Rated  Pune Call Girls Dighi ⟟ 6297143586 ⟟ Call Me For Genuine Sex Servi...Top Rated  Pune Call Girls Dighi ⟟ 6297143586 ⟟ Call Me For Genuine Sex Servi...
Top Rated Pune Call Girls Dighi ⟟ 6297143586 ⟟ Call Me For Genuine Sex Servi...Call Girls in Nagpur High Profile
 
VIP Call Girl in Mira Road 💧 9920725232 ( Call Me ) Get A New Crush Everyday ...
VIP Call Girl in Mira Road 💧 9920725232 ( Call Me ) Get A New Crush Everyday ...VIP Call Girl in Mira Road 💧 9920725232 ( Call Me ) Get A New Crush Everyday ...
VIP Call Girl in Mira Road 💧 9920725232 ( Call Me ) Get A New Crush Everyday ...dipikadinghjn ( Why You Choose Us? ) Escorts
 
Vip Call US 📞 7738631006 ✅Call Girls In Sakinaka ( Mumbai )
Vip Call US 📞 7738631006 ✅Call Girls In Sakinaka ( Mumbai )Vip Call US 📞 7738631006 ✅Call Girls In Sakinaka ( Mumbai )
Vip Call US 📞 7738631006 ✅Call Girls In Sakinaka ( Mumbai )Pooja Nehwal
 
Stock Market Brief Deck (Under Pressure).pdf
Stock Market Brief Deck (Under Pressure).pdfStock Market Brief Deck (Under Pressure).pdf
Stock Market Brief Deck (Under Pressure).pdfMichael Silva
 
Mira Road Memorable Call Grls Number-9833754194-Bhayandar Speciallty Call Gir...
Mira Road Memorable Call Grls Number-9833754194-Bhayandar Speciallty Call Gir...Mira Road Memorable Call Grls Number-9833754194-Bhayandar Speciallty Call Gir...
Mira Road Memorable Call Grls Number-9833754194-Bhayandar Speciallty Call Gir...priyasharma62062
 
8377087607, Door Step Call Girls In Kalkaji (Locanto) 24/7 Available
8377087607, Door Step Call Girls In Kalkaji (Locanto) 24/7 Available8377087607, Door Step Call Girls In Kalkaji (Locanto) 24/7 Available
8377087607, Door Step Call Girls In Kalkaji (Locanto) 24/7 Availabledollysharma2066
 
CBD Belapur Expensive Housewife Call Girls Number-📞📞9833754194 No 1 Vipp HIgh...
CBD Belapur Expensive Housewife Call Girls Number-📞📞9833754194 No 1 Vipp HIgh...CBD Belapur Expensive Housewife Call Girls Number-📞📞9833754194 No 1 Vipp HIgh...
CBD Belapur Expensive Housewife Call Girls Number-📞📞9833754194 No 1 Vipp HIgh...priyasharma62062
 
Call Girls in New Friends Colony Delhi 💯 Call Us 🔝9205541914 🔝( Delhi) Escort...
Call Girls in New Friends Colony Delhi 💯 Call Us 🔝9205541914 🔝( Delhi) Escort...Call Girls in New Friends Colony Delhi 💯 Call Us 🔝9205541914 🔝( Delhi) Escort...
Call Girls in New Friends Colony Delhi 💯 Call Us 🔝9205541914 🔝( Delhi) Escort...Delhi Call girls
 
7 tips trading Deriv Accumulator Options
7 tips trading Deriv Accumulator Options7 tips trading Deriv Accumulator Options
7 tips trading Deriv Accumulator OptionsVince Stanzione
 
Top Rated Pune Call Girls Sinhagad Road ⟟ 6297143586 ⟟ Call Me For Genuine S...
Top Rated  Pune Call Girls Sinhagad Road ⟟ 6297143586 ⟟ Call Me For Genuine S...Top Rated  Pune Call Girls Sinhagad Road ⟟ 6297143586 ⟟ Call Me For Genuine S...
Top Rated Pune Call Girls Sinhagad Road ⟟ 6297143586 ⟟ Call Me For Genuine S...Call Girls in Nagpur High Profile
 
Vasai-Virar Fantastic Call Girls-9833754194-Call Girls MUmbai
Vasai-Virar Fantastic Call Girls-9833754194-Call Girls MUmbaiVasai-Virar Fantastic Call Girls-9833754194-Call Girls MUmbai
Vasai-Virar Fantastic Call Girls-9833754194-Call Girls MUmbaipriyasharma62062
 
( Jasmin ) Top VIP Escorts Service Dindigul 💧 7737669865 💧 by Dindigul Call G...
( Jasmin ) Top VIP Escorts Service Dindigul 💧 7737669865 💧 by Dindigul Call G...( Jasmin ) Top VIP Escorts Service Dindigul 💧 7737669865 💧 by Dindigul Call G...
( Jasmin ) Top VIP Escorts Service Dindigul 💧 7737669865 💧 by Dindigul Call G...dipikadinghjn ( Why You Choose Us? ) Escorts
 

Último (20)

Call Girls Rajgurunagar Call Me 7737669865 Budget Friendly No Advance Booking
Call Girls Rajgurunagar Call Me 7737669865 Budget Friendly No Advance BookingCall Girls Rajgurunagar Call Me 7737669865 Budget Friendly No Advance Booking
Call Girls Rajgurunagar Call Me 7737669865 Budget Friendly No Advance Booking
 
VIP Independent Call Girls in Mira Bhayandar 🌹 9920725232 ( Call Me ) Mumbai ...
VIP Independent Call Girls in Mira Bhayandar 🌹 9920725232 ( Call Me ) Mumbai ...VIP Independent Call Girls in Mira Bhayandar 🌹 9920725232 ( Call Me ) Mumbai ...
VIP Independent Call Girls in Mira Bhayandar 🌹 9920725232 ( Call Me ) Mumbai ...
 
Mira Road Awesome 100% Independent Call Girls NUmber-9833754194-Dahisar Inter...
Mira Road Awesome 100% Independent Call Girls NUmber-9833754194-Dahisar Inter...Mira Road Awesome 100% Independent Call Girls NUmber-9833754194-Dahisar Inter...
Mira Road Awesome 100% Independent Call Girls NUmber-9833754194-Dahisar Inter...
 
Call Girls Service Pune ₹7.5k Pick Up & Drop With Cash Payment 9352852248 Cal...
Call Girls Service Pune ₹7.5k Pick Up & Drop With Cash Payment 9352852248 Cal...Call Girls Service Pune ₹7.5k Pick Up & Drop With Cash Payment 9352852248 Cal...
Call Girls Service Pune ₹7.5k Pick Up & Drop With Cash Payment 9352852248 Cal...
 
Business Principles, Tools, and Techniques in Participating in Various Types...
Business Principles, Tools, and Techniques  in Participating in Various Types...Business Principles, Tools, and Techniques  in Participating in Various Types...
Business Principles, Tools, and Techniques in Participating in Various Types...
 
(Sexy Sheela) Call Girl Mumbai Call Now 👉9920725232👈 Mumbai Escorts 24x7
(Sexy Sheela) Call Girl Mumbai Call Now 👉9920725232👈 Mumbai Escorts 24x7(Sexy Sheela) Call Girl Mumbai Call Now 👉9920725232👈 Mumbai Escorts 24x7
(Sexy Sheela) Call Girl Mumbai Call Now 👉9920725232👈 Mumbai Escorts 24x7
 
Top Rated Pune Call Girls Dighi ⟟ 6297143586 ⟟ Call Me For Genuine Sex Servi...
Top Rated  Pune Call Girls Dighi ⟟ 6297143586 ⟟ Call Me For Genuine Sex Servi...Top Rated  Pune Call Girls Dighi ⟟ 6297143586 ⟟ Call Me For Genuine Sex Servi...
Top Rated Pune Call Girls Dighi ⟟ 6297143586 ⟟ Call Me For Genuine Sex Servi...
 
VIP Call Girl in Mira Road 💧 9920725232 ( Call Me ) Get A New Crush Everyday ...
VIP Call Girl in Mira Road 💧 9920725232 ( Call Me ) Get A New Crush Everyday ...VIP Call Girl in Mira Road 💧 9920725232 ( Call Me ) Get A New Crush Everyday ...
VIP Call Girl in Mira Road 💧 9920725232 ( Call Me ) Get A New Crush Everyday ...
 
Vip Call US 📞 7738631006 ✅Call Girls In Sakinaka ( Mumbai )
Vip Call US 📞 7738631006 ✅Call Girls In Sakinaka ( Mumbai )Vip Call US 📞 7738631006 ✅Call Girls In Sakinaka ( Mumbai )
Vip Call US 📞 7738631006 ✅Call Girls In Sakinaka ( Mumbai )
 
Stock Market Brief Deck (Under Pressure).pdf
Stock Market Brief Deck (Under Pressure).pdfStock Market Brief Deck (Under Pressure).pdf
Stock Market Brief Deck (Under Pressure).pdf
 
Mira Road Memorable Call Grls Number-9833754194-Bhayandar Speciallty Call Gir...
Mira Road Memorable Call Grls Number-9833754194-Bhayandar Speciallty Call Gir...Mira Road Memorable Call Grls Number-9833754194-Bhayandar Speciallty Call Gir...
Mira Road Memorable Call Grls Number-9833754194-Bhayandar Speciallty Call Gir...
 
8377087607, Door Step Call Girls In Kalkaji (Locanto) 24/7 Available
8377087607, Door Step Call Girls In Kalkaji (Locanto) 24/7 Available8377087607, Door Step Call Girls In Kalkaji (Locanto) 24/7 Available
8377087607, Door Step Call Girls In Kalkaji (Locanto) 24/7 Available
 
CBD Belapur Expensive Housewife Call Girls Number-📞📞9833754194 No 1 Vipp HIgh...
CBD Belapur Expensive Housewife Call Girls Number-📞📞9833754194 No 1 Vipp HIgh...CBD Belapur Expensive Housewife Call Girls Number-📞📞9833754194 No 1 Vipp HIgh...
CBD Belapur Expensive Housewife Call Girls Number-📞📞9833754194 No 1 Vipp HIgh...
 
Call Girls in New Friends Colony Delhi 💯 Call Us 🔝9205541914 🔝( Delhi) Escort...
Call Girls in New Friends Colony Delhi 💯 Call Us 🔝9205541914 🔝( Delhi) Escort...Call Girls in New Friends Colony Delhi 💯 Call Us 🔝9205541914 🔝( Delhi) Escort...
Call Girls in New Friends Colony Delhi 💯 Call Us 🔝9205541914 🔝( Delhi) Escort...
 
From Luxury Escort Service Kamathipura : 9352852248 Make on-demand Arrangemen...
From Luxury Escort Service Kamathipura : 9352852248 Make on-demand Arrangemen...From Luxury Escort Service Kamathipura : 9352852248 Make on-demand Arrangemen...
From Luxury Escort Service Kamathipura : 9352852248 Make on-demand Arrangemen...
 
7 tips trading Deriv Accumulator Options
7 tips trading Deriv Accumulator Options7 tips trading Deriv Accumulator Options
7 tips trading Deriv Accumulator Options
 
Top Rated Pune Call Girls Sinhagad Road ⟟ 6297143586 ⟟ Call Me For Genuine S...
Top Rated  Pune Call Girls Sinhagad Road ⟟ 6297143586 ⟟ Call Me For Genuine S...Top Rated  Pune Call Girls Sinhagad Road ⟟ 6297143586 ⟟ Call Me For Genuine S...
Top Rated Pune Call Girls Sinhagad Road ⟟ 6297143586 ⟟ Call Me For Genuine S...
 
W.D. Gann Theory Complete Information.pdf
W.D. Gann Theory Complete Information.pdfW.D. Gann Theory Complete Information.pdf
W.D. Gann Theory Complete Information.pdf
 
Vasai-Virar Fantastic Call Girls-9833754194-Call Girls MUmbai
Vasai-Virar Fantastic Call Girls-9833754194-Call Girls MUmbaiVasai-Virar Fantastic Call Girls-9833754194-Call Girls MUmbai
Vasai-Virar Fantastic Call Girls-9833754194-Call Girls MUmbai
 
( Jasmin ) Top VIP Escorts Service Dindigul 💧 7737669865 💧 by Dindigul Call G...
( Jasmin ) Top VIP Escorts Service Dindigul 💧 7737669865 💧 by Dindigul Call G...( Jasmin ) Top VIP Escorts Service Dindigul 💧 7737669865 💧 by Dindigul Call G...
( Jasmin ) Top VIP Escorts Service Dindigul 💧 7737669865 💧 by Dindigul Call G...
 

comcast Trending Schedules

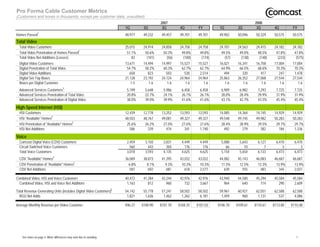
  • 1. Pro Forma Cable Customer Metrics (Customers and boxes in thousands, except per customer data; unaudited) 2007 2008 1Q 2Q 3Q 4Q FY 1Q 2Q 3Q 4Q FY 1 Homes Passed 48,977 49,232 49,457 49,701 49,701 49,902 50,096 50,329 50,575 50,575 Total Video Total Video Customers 25,015 24,914 24,858 24,758 24,758 24,701 24,563 24,415 24,182 24,182 Total Video Penetration of Homes Passed2 51.1% 50.6% 50.3% 49.8% 49.8% 49.5% 49.0% 48.5% 47.8% 47.8% Total Video Net Additions (Losses) 83 (101) (56) (100) (174) (57) (138) (148) (233) (575) Digital Video Customers 13,671 14,494 14,997 15,527 15,527 16,021 16,341 16,758 17,004 17,004 Digital Penetration of Total Video 54.7% 58.2% 60.3% 62.7% 62.7% 64.9% 66.5% 68.6% 70.3% 70.3% Digital Video Additions 658 823 503 530 2,514 494 320 417 247 1,478 Digital Set-Top Boxes 21,128 23,192 24,124 24,964 24,964 25,863 26,352 27,068 27,544 27,544 Boxes per Digital Customer 1.5 1.6 1.6 1.6 1.6 1.6 1.6 1.6 1.6 1.6 Advanced Services Customers3 5,199 5,648 5,986 6,458 6,458 6,909 6,982 7,293 7,725 7,725 Advanced Services Penetration of Total Video 20.8% 22.7% 24.1% 26.1% 26.1% 28.0% 28.4% 29.9% 31.9% 31.9% Advanced Services Penetration of Digital Video 38.0% 39.0% 39.9% 41.6% 41.6% 43.1% 42.7% 43.5% 45.4% 45.4% High-Speed Internet (HSI) HSI Customers 12,439 12,778 13,252 13,593 13,593 14,085 14,364 14,745 14,929 14,929 4 HSI quot;Availablequot; Homes 48,503 48,767 49,081 49,327 49,327 49,548 49,745 49,982 50,283 50,283 2 HSI Penetration of quot;Availablequot; Homes 25.6% 26.2% 27.0% 27.6% 27.6% 28.4% 28.9% 29.5% 29.7% 29.7% HSI Net Additions 586 339 474 341 1,740 492 279 382 184 1,336 Voice Comcast Digital Voice (CDV) Customers 2,459 3,150 3,831 4,449 4,449 5,088 5,643 6,127 6,470 6,470 Circuit-Switched Voice Customers 560 443 304 176 176 66 10 7 3 3 Total Voice Customers 3,018 3,593 4,135 4,625 4,625 5,154 5,654 6,133 6,473 6,473 CDV quot;Availablequot; Homes4 36,069 38,873 41,395 43,032 43,032 44,082 45,143 46,083 46,687 46,687 2 CDV Penetration of quot;Availablequot; Homes 6.8% 8.1% 9.3% 10.3% 10.3% 11.5% 12.5% 13.3% 13.9% 13.9% CDV Net Additions 587 692 681 618 2,577 639 555 483 344 2,021 Combined Video, HSI and Voice Customers 40,472 41,284 42,244 42,976 42,976 43,940 44,580 45,294 45,584 45,584 Combined Video, HSI and Voice Net Additions 1,163 812 960 732 3,667 964 640 714 290 2,609 Total Revenue Generating Units (includes Digital Video Customers)5 54,142 55,778 57,241 58,502 58,502 59,961 60,921 62,051 62,588 62,588 RGU Net Adds 1,821 1,636 1,462 1,262 6,181 1,459 960 1,131 537 4,086 Average Monthly Revenue per Video Customer $96.27 $100.90 $101.70 $104.25 $101.03 $106.70 $109.61 $110.67 $113.80 $110.48 See notes on page 4. Minor differences may exist due to rounding. 1
  • 2. Pro Forma Revenue and Pro Forma Expenses ($ in millions; unaudited) 2007 2008 1Q 2Q 3Q 4Q FY 1Q 2Q 3Q 4Q FY Revenue Video6 $4,491 $4,597 $4,519 $4,578 $18,185 $4,706 $4,726 $4,681 $4,736 $18,849 High-Speed Internet $1,569 $1,632 $1,666 $1,703 $6,570 $1,750 $1,792 $1,822 $1,861 $7,225 Voice $356 $425 $479 $533 $1,793 $587 $640 $690 $732 $2,649 Advertising $322 $410 $417 $429 $1,578 $344 $399 $374 $409 $1,526 Other7 $268 $281 $299 $299 $1,147 $305 $316 $336 $326 $1,283 Franchise Fees $206 $212 $213 $216 $847 $224 $227 $228 $232 $911 Total Cable Segment * $7,212 $7,557 $7,593 $7,758 $30,120 $7,916 $8,100 $8,131 $8,296 $32,443 Advertising $125 $157 $156 $139 $577 $154 $170 $146 $143 $613 Affiliate $148 $145 $139 $165 $597 $156 $155 $158 $163 $632 Other8 $29 $32 $35 $44 $140 $53 $41 $43 $44 $181 Total Programming Segment $302 $334 $330 $348 $1,314 $363 $366 $347 $350 $1,426 Corporate & Other $88 $48 $51 $89 $276 $110 $87 $71 $119 $387 Total Consolidated Revenue $7,602 $7,939 $7,974 $8,195 $31,710 $8,389 $8,553 $8,549 $8,765 $34,256 Operating Expense Video Programming $1,495 $1,507 $1,455 $1,530 $5,987 $1,619 $1,611 $1,617 $1,632 $6,479 High-Speed Internet $142 $148 $148 $148 $586 $138 $136 $131 $118 $523 Voice $168 $158 $191 $180 $697 $200 $182 $179 $169 $730 Technical Labor $469 $475 $512 $479 $1,935 $523 $516 $559 $540 $2,138 Other (includes Franchise Fees) $613 $622 $639 $664 $2,538 $683 $696 $696 $719 $2,794 Total Cable Operating Expense 9 $2,887 $2,910 $2,945 $3,001 $11,743 $3,163 $3,141 $3,182 $3,178 $12,664 Customer Service $417 $426 $445 $420 $1,708 $442 $434 $443 $454 $1,773 Marketing $322 $365 $387 $358 $1,432 $399 $411 $426 $389 $1,625 Administrative and Other 10 $710 $732 $766 $783 $2,991 $770 $752 $829 $860 $3,211 Total Cable SG&A $1,449 $1,523 $1,598 $1,561 $6,131 $1,611 $1,597 $1,698 $1,703 $6,609 Total Cable Segment $4,336 $4,433 $4,543 $4,562 $17,874 $4,774 $4,738 $4,880 $4,881 $19,273 Total Programming Segment $237 $259 $233 $299 $1,028 $250 $277 $242 $295 $1,064 Corporate and Other $184 $141 $194 $180 $699 $191 $187 $190 $219 $787 Total Consolidated Operating Expense $4,757 $4,833 $4,970 $5,041 $19,601 $5,215 $5,202 $5,312 $5,395 $21,124 Operating Cash Flow (OCF) 11 Cable $2,876 $3,124 $3,050 $3,196 $12,246 $3,142 $3,362 $3,251 $3,415 $13,170 Programming $65 $75 $97 $49 $286 $113 $89 $105 $55 $362 Corporate & Other ($96) ($93) ($143) ($91) ($423) ($81) ($100) ($119) ($100) ($400) Total Consolidated OCF $2,845 $3,106 $3,004 $3,154 $12,109 $3,174 $3,351 $3,237 $3,370 $13,132 Cable 39.9% 41.3% 40.2% 41.2% 40.7% 39.7% 41.5% 40.0% 41.2% 40.6% Programming 21.3% 22.7% 29.3% 14.3% 21.8% 31.2% 24.2% 30.3% 15.7% 25.4% Total Consolidated OCF Margin 37.4% 39.1% 37.7% 38.5% 38.2% 37.8% 39.2% 37.9% 38.5% 38.3% * Business Services Revenue (included in Cable service revenues) $87 $95 $102 $110 $394 $120 $131 $145 $162 $558 See notes on page 4. Minor differences may exist due to rounding. 2
  • 3. Pro Forma Capital Expenditures and Free Cash Flow ($ and shares in millions, except per share data; unaudited) 2007 2008 1Q 2Q 3Q 4Q FY 1Q 2Q 3Q 4Q FY Capital Expenditures Growth Capital Customer Premise Equipment (CPE) $751 $804 $701 $660 $2,916 $819 $687 $590 $775 $2,871 Scalable Infrastructure $109 $113 $98 $91 $411 $59 $55 $61 $80 $255 Line Extensions $88 $100 $99 $78 $365 $48 $52 $54 $58 $212 Support Capital $70 $110 $99 $89 $368 $54 $57 $65 $102 $278 Upgrades (Capacity Expansion) $22 $27 $28 $42 $119 $21 $25 $13 $8 $67 Business Services $17 $21 $22 $50 $110 $50 $48 $61 $72 $231 Total Growth Capital $1,057 $1,175 $1,047 $1,010 $4,289 $1,051 $924 $844 $1,095 $3,914 Maintenance Capital CPE $66 $77 $84 $77 $304 $58 $73 $76 $69 $276 Scalable Infrastructure $175 $151 $140 $172 $638 $103 $115 $194 $269 $681 Support Capital $63 $99 $99 $69 $330 $43 $58 $54 $72 $227 Upgrades $109 $90 $129 $138 $466 $60 $58 $81 $141 $340 Total Maintenance Capital $413 $417 $452 $456 $1,738 # $264 $304 $405 $551 $1,524 Strategic/Discretionary Capital $10 $23 $29 $27 $89 $40 $26 $19 $22 $107 12 Total Cable Segment $1,480 $1,615 $1,528 $1,493 $6,116 $1,355 $1,254 $1,268 $1,668 $5,545 Total Programming Segment $4 $10 $8 $13 $35 $4 $6 $12 $22 $44 Corporate and Other $7 $8 $26 $89 $130 $72 $40 $26 $23 $161 Total Consolidated Capital Expenditures $1,491 $1,633 $1,562 $1,595 $6,281 $1,431 $1,300 $1,306 $1,713 $5,750 Percent of Total Consolidated Revenue 19.6% 20.6% 19.6% 19.5% 19.8% 17.1% 15.2% 15.3% 19.5% 16.8% Free Cash Flow13 Net Cash Provided by Operating Activities $1,965 $1,942 $1,598 $2,684 $8,189 $2,259 $2,669 $2,445 $2,858 $10,231 Capital Expenditures ($1,454) ($1,604) ($1,526) ($1,574) ($6,158) ($1,431) ($1,300) ($1,306) ($1,713) ($5,750) Cash Paid for Capitalized Software ($88) ($86) ($60) ($77) ($311) ($99) ($88) ($100) ($123) ($410) Cash Paid for Other Intangible Assets ($30) ($25) ($24) ($16) ($95) ($27) ($31) ($31) ($28) ($117) Adjustments for Payment of Tax on Nonoperating Items14 $49 $141 $536 ($9) $717 $0 $228 $88 ($13) $303 Free Cash Flow (Including 2008 Economic Stimulus Package) $442 $368 $524 $1,008 $2,342 $702 $1,478 $1,096 $981 $4,257 2008 Economic Stimulus Package * $0 $0 $0 $0 $0 $0 ($315) ($168) ($117) ($600) Free Cash Flow $442 $368 $524 $1,008 $2,342 $702 $1,163 $928 $864 $3,657 Free Cash Flow per Share $0.14 $0.12 $0.17 $0.33 $0.75 $0.23 $0.39 $0.32 $0.30 $1.24 Diluted weighted-average number of common shares 3,161 3,147 3,118 3,078 3,129 3,017 2,970 2,920 2,888 2,952 *Our definition of Free Cash Flow remains unchanged and specifically excludes any impact from the 2008 Economic Stimulus package. These amounts have been excluded from Free Cash Flow to provide an appropriate comparison. See notes on page 4. Minor differences may exist due to rounding. 3
  • 4. Notes Basis of Presentation: All data, except Free Cash Flow, is presented on a pro forma basis. Pro forma data is adjusted only for timing of acquisitions or dispositions and does not include adjustments for costs related to integration activities, cost savings or synergies that have been or may be achieved by the combined businesses. Pro forma financial data includes the results of Comcast SportsNet Bay Area and Comcast SportsNet New England acquired on June 30, 2007, the cable system acquired from Patriot Media Holdings, LLC on August 31, 2007, and the cable systems resulting from the dissolution of the Insight Midwest Partnership on January 1, 2008. Pro forma results are presented as if the acquisitions and dispositions were effective on January 1, 2007. The net impact of these transactions was an increase of 765,000 video customers. Pro forma customer data also includes 7,000 video customers acquired through an acquisition on November 21, 2008. The impact of this acquisition on our segment operating results was not material. Please refer to our earnings release for a reconciliation of pro forma financial data. All percentages are calculated on whole numbers. Notes: 1) Homes are considered passed (“homes passed”) if we can connect them to our distribution system without further extending the transmission lines. In the case of certain multiple dwelling units (“MDUs”), such as apartment buildings and condominium complexes, homes passed are counted on an adjusted basis. Homes passed are an estimate based on the best available information. Homes passed and quot;availablequot; homes do not include the number of small and medium sized businesses passed which cannot be reasonably estimated at this time. 2) Penetration is calculated by dividing the number of customers by the number of homes passed or available homes, as appropriate. The number of customers includes our small and medium-sized business customers. 3) Advanced Services Customers subscribe to DVR and/or HDTV services. 4) Homes are considered available (“available” homes) if we can connect them to our distribution system without further upgrading the transmission lines and if we offer the service in that area. 5) Revenue Generating Units (RGUs) represents the sum of video and digital video, high-speed Internet and net voice customers, excluding additional outlets. Subscriptions to DVR and/or HDTV services do not result in additional RGUs. 6) Cable Video Revenue consists of our limited analog, expanded analog service, digital, premium, pay-per-view and equipment services. 7) Other Cable Revenue includes regional sports programming networks, residential video installation revenue, guide revenue, commissions from electronic retailing networks, other product offerings and revenue of our digital media center. 8) Other Programming Revenue primarily consists of international and Internet revenue. 9) Total Cable Operating Expense consists of video programming expense, technical labor costs, high-speed Internet and voice expense and other operating expense. Video Programming Expense, our largest operating expense, is the fees we pay to programming networks to license the programming we package, offer and distribute to our video customers. High-speed Internet Expense and Voice Expense include certain direct costs identified by us for providing these services. Other related costs associated with providing these services are generally shared among all our cable services and are not allocated to these captions. Technical Labor Costs include the internal and external labor to complete service call and installation activities in the home, network operations, fulfillment and provisioning costs. Other Operating Expense includes franchise fees, pole rentals, plant maintenance and vehicle-related costs, including fuel, as well as expenses related to our regional sports networks. 10) Cable Administrative and Other Expense consists of administrative personnel expense, bad debt expense, building and office expense, billing costs, insurance expense, property taxes, and severance costs of approximately $39 million in 3Q08, $63 million in 4Q08, and $126 million for the full year 2008 related to staff reductions and a divisional reorganization. 11) See Exhibit 99.2, Explanation of Non-GAAP and Other Financial Measures, to Comcast's Form 8-K (Quarterly Earnings Release), for the definition of Operating Cash Flow. 12) Management evaluates Cable capital expenditures by categorizing investments into three groups: Growth, Maintenance and Strategic/Discretionary. Growth is directly tied to revenue generation and represents the costs required to secure new customers, revenue units or additional bandwidth revenues. Maintenance includes investments that allow the company to maintain its competitive position and provide a foundation for growth. Strategic/Discretionary includes investments that lay the groundwork for future products and services, such as our investments in interactive advertising, cross-platform product development or switched digital video. CPE includes costs incurred at the customer residence to secure new customers, revenue units and additional bandwidth revenues (e.g. digital converters). Scalable infrastructures includes costs, not CPE or network related to secure growth of new customers, revenue units and additional bandwidth revenues or provide service enhancements (e.g. headend equipment). Line extensions include network costs associated with entering new service areas (e.g. fiber/coaxial cable). Support capital includes costs associated with the replacement or enhancement of non-network assets due to obsolescence and wear out (e.g. non-network equipment, land, buildings and vehicles). Upgrades include costs to enhance or replace existing fiber/coaxial cable networks, including network improvements. Business Services includes fiber/coax extension, electronics, CPE and costs to secure new customers. To be consistent with our current management reporting presentation, certain capital expenditures within the cable segment have been reclassified. 13) Free Cash Flow is not presented on a pro forma basis. See Exhibit 99.2, Explanation of Non-GAAP and Other Financial Measures, to Comcast's Form 8-K (Quarterly Earnings Release), for the definition of Free Cash Flow. 14) Payment of Tax on Nonoperating Items in 3Q07 includes $320 million payment of tax on prior year audits, $160 million payment of tax on nonoperating items and $56 million payment of tax related to acquired companies.