VIP Call Girl in Mira Road 💧 9920725232 ( Call Me ) Get A New Crush Everyday ...
CDO-Squared Demystified
1. Nomura Fixed Income Research
CDOs-Squared Demystified
I. Introduction February 4, 2005
Synthetic CDOs-squared offer investors higher spreads than single-layer CDOs but also may
present additional risks. Their two-layer structures somewhat increase their exposure to certain
risks by creating performance quot;cliffs.quot; That is, seemingly small changes in the performance of
underlying reference credits can cause larger changes in the performance of a CDO-squared. If
the actual performance of the reference credits deviates substantially from the original modeling
assumptions, the CDO-squared can suffer unexpected losses. We perceive four areas where
synthetic CDOs-squared display particular sensitivity to actual performance being worse than
assumed for modeling purposes: (1) frequency of defaults, (2) recovery rates, (3) correlation of
default risk, and (4) distribution of defaults among the quot;inner CDOsquot; included within a CDO-
squared. We address each of those below.
Investors in synthetic CDOs-squared weigh the wider spreads offered by the product against its
incremental risk. We recommend a two-pronged approach for understanding the risk side of the
balance. First, an investor should analyze the distribution of potential outcomes by using an
appropriate computer model. That approach offers a big-picture view of potential performance, but
it relies entirely on the particular model chosen and its underlying assumptions. Second, an
investor should pursue a scenario analysis, examining specific quot;worst casequot; and quot;break evenquot;
scenarios as a reality check on the first approach. By combining both prongs, an investor can
obtain a fair understanding of the incremental risk and select deals that offer the most favorable
balance of risk and return.
II. The quot;ABCsquot; of CDOs-Squared
A CDO-squared, sometimes denoted as CDO^2 or CDO2, is a type of collateralized debt obligation
(CDO) where the underlying portfolio includes tranches of other CDOs. During the last couple of
years, CDOs-squared, particularly of the synthetic type, have become an important segment of the
global CDO market.
A. Types of CDO^2
A cash CDO-squared is a CDO backed by a collateral portfolio consisting of tranches of existing
cash CDOs.1 On the other hand, a synthetic CDO-squared involves a portfolio of credit default
Contacts:
* Authors are grateful to Michael Van Bemmelen for providing valuable insights for this paper.
1 Michiko Whetten
In general, a CDO refers to an arrangement that issues bonds backed by a portfolio of bonds, loans, and other (212) 667-2338
assets. For more basic concepts, please see, CDOs in Plain English, Nomura Fixed Income Research (13 mwhetten@us.nomura.com
September 2004).
Mark Adelson
(212) 667-2337
This report and others are available online at Nomura's new research website. To madelson@us.nomura.com
obtain a user id and password, please contact Diana Berezina at
dberezina@us.nomura.com. Nomura Securities International, Inc.
The web address is http://www.nomura.com/research/s16 Two World Financial Center
New York, NY 10281-1198
www.nomura.com/research/s16
Please read the important disclosures and analyst certifications
appearing on the last page.
2. Nomura Fixed Income Research
swaps (CDS) and has a two-layer structure of credit risk. In most synthetic CDOs-squared, the
underlying CDOs are created for the sole purpose of being included in the CDO-squared. Because
of its synthetic nature, these underlying CDOs are simply conceptual and used to calculate cash
flows and values of the CDO-squared. Therefore, a synthetic CDO-squared may be viewed as a
complex derivative instrument, while its cash counterpart is simply a repackaging of existing CDOs.
More recently, hybrid deals have began to appear in the market. In these deals, a small portion of
the reference portfolio is synthetic CDOs and the rest is cash or synthetic assets, such as ABS,
RMBS or CMBS. However, given the typical high credit quality of those structured finance assets,
most of the risk in hybrid deals stems from the CDO-squared part.
While synthetic CDOs-squared first appeared in Europe, the market segment experienced great
growth in U.S. in 2004. According to S&P, 2 the number of U.S. synthetic CDO-squared deals
jumped from just one in 2003 to 27 through the third quarter of 2004, with issuance volume of $2.6
billion. By volume, CDOs-squared accounted for about 20% of all synthetic issuance and 4% of all
CDO issuance in the U.S.
B. Basic Structure
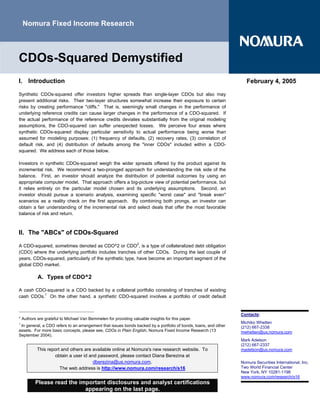
A typical synthetic CDO-squared references a portfolio (sometimes called quot;masterquot; or quot;outerquot; CDO)
consisting of other synthetic CDO tranches (sometimes called quot;innerquot; CDOs). The underlying CDO
tranches may have similar size and subordination, referencing similar portfolios. A CDO-squared
usually comes with a certain amount of subordination, in addition to the subordination in the
underlying CDO tranches. In the chart below, the lower shaded boxes represent the underlying
CDO tranches, which collectively form the quot;masterquot; CDO portfolio. The dotted box is the CDO-
squared tranche. Tranches at the quot;innerquot; and quot;masterquot; CDO levels come with separate attachment
points (AP) and detachment points (DP), which define tranche sizes and subordination. Also, the
inner CDO portfolios often include some of the same reference credits. The degree of this
quot;overlapquot; is a very important factor determining the risk profile of the CDO-squared.
Illustration of a CDO-Squared Structure
“Master” CDO
DP
CDO^2 Tranche
AP
CDO 1 CDO 2 CDO 3 CDO 4 CDO 5
DP
AP
AP: attachment point / DP: detachment point
Source: Nomura
2
Figures are from presentations at S&P’s Annual Global CDO Conference, New York, November 1, 2004.
(2)
3. Nomura Fixed Income Research
C. Rationale for CDOs^2
There are mainly two reasons for using the double-layer structure. One is the higher degree of
diversity achieved by including several underlying CDOs that already reference many corporate
names. While a one-layer CDO typically references 50-100 corporate credits, a CDO-squared
tends to include between five and ten of such one-layer CDOs. Another benefit of a CDO-squared
is relatively larger spreads available for investors.
Given the double-layer structure, CDOs-squared are often perceived as having an added protection
against losses, because tranches in underlying CDOs and the CDO-squared are protected by
subordination at each level. However, higher spread levels achieved in the CDO-squared reflect
the complexity and the unique characteristics of the instrument, which we explain below.
III. CDO^2 Mechanics
In a CDO-squared, losses are filtered through the double-layer of CDOs in the following manner:
(1) Reference credit defaults in the underlying (quot;innerquot;) CDO portfolios;
(2) The corresponding inner CDO tranches suffer losses or lose part of their subordination,
depending on the amount of losses;
(3) If one or more of the inner CDO tranches suffer losses in (2), the losses flow into the
master CDO portfolio;
(4) The tranche of the master CDO suffers losses or loses part of its subordination,
3
depending on the amount of losses in the master CDO portfolio.
As an illustration of the deal structure, let us consider a CDO-squared created from three
underlying CDO tranches. Suppose each underlying CDO includes 10 reference credits, equally
weighted.4 For now, let’s assume there are no overlaps, so the deal as a whole is exposed to 30
individual reference credits. Each underlying CDO tranche can withstand two defaults before
getting hit with losses, but two additional defaults would wipe out the entire tranche.5
Losses at the underlying CDO tranche level would flow into the master CDO portfolio, which in this
example consists of the three underlying CDO tranches. In other words, the master CDO is
exposed to credit risk of up to six defaults. Also, the CDO-squared tranche is typically protected by
its own cushion of subordination. If we assume that the CDO-squared has its own subordination
sufficient to absorb one default, the tranche suffers losses only if more than one default flows into
the CDO-squared portfolio, after one or more of the underlying CDOs has suffered more than two
defaults.
Interestingly, the amount of losses in a CDO-squared tranche depends on not only how many
defaults occur but also where they occur (i.e., location of default in underlying CDOs). In the above
3
Mathematically, this process is expressed in the equation below:
CDO^2 Tranche Loss = Min [tranche size, Max [0, loss to underlying CDOs – subordination]]
where losses to the underlying CDOs are calculated as;
Loss to each Underlying CDO = Min [tranche size, Max [0, (# of defaults)x(1 – recovery) – subordination]]
Note that tranche size and subordination is for the master CDO and the underlying CDO, respectively.
4
Note that the structure we discuss here does not reflect the typical deal structure seen in the market. A typical
CDO-squared tends to include several underlying CDOs each referencing 50-100 names. Tranche thickness
and subordination may vary, but typically range between 2% and 10%.
5
Here, we assume 0% recovery rate.
(3)
4. Nomura Fixed Income Research
example, four defaults that are evenly spread across the three underlying CDOs will NOT cause
any losses to the underlying CDO tranches (See Case 2 in the following chart). In such a case,
one underlying CDO suffers two defaults and the other two suffer one default each, but losses do
not reach any of the three tranches. In contrast, if all four of the defaults occur in just one CDO, it
would wipe out that CDO tranche (Case 1 below). Furthermore, two additional defaults that flow
into the master CDO portfolio exhaust the subordination at the master CDO level, causing losses to
the CDO-squared.
Illustration of Importance of Default Location to a CDO-Squared
Case 1: Loss Case 2: No Loss
CDO 1 CDO 2 CDO 3 CDO 1 CDO 2 CDO 3
DP
AP
Source: Nomura
The scenario we have just described highlights one difference between a CDO-squared and a
regular CDO. In a regular CDO, only the number of defaults in the underlying portfolio determines
tranche losses. In a CDO-squared, however, we need to identify exactly where defaults occur
before we can identify whether or not losses have reached the CDO-squared tranche.
A CDO-squared is very sensitive to the shape of loss distributions of the underlying CDO tranches.
The shape of loss distribution reveals the degree of quot;tail risk,quot; or the likelihood of extreme outcomes.
In a CDO-squared, credit risk in the underlying CDO tranches is already quot;tranchedquot; and another
round of tranching is made at the master CDO level. Accordingly, the double-layer structure
amplifies the sensitivity of a tranche to various parameters, such as default probability,
subordination, etc.
An obvious question for an investor would be, then, whether to stay with a regular CDO, that has a
similar structure to the underlying CDOs we discussed above, or pick a CDO-squared that comes
with a complex structure but offers a larger spread. In the following sections, we illustrate key
characteristics of the CDO-squared.
IV. Examining Loss Distributions
There are many moving pieces in a CDO-squared. In this section, we will discuss each component
of the deal structure that affects the risk profile of a CDO-squared. For illustration, we created a
hypothetical CDO-squared and ran Monte Carlo simulations to generate correlated defaults among
reference credits. We assume that the CDO-squared references a portfolio of five underlying
CDOs, each referencing 50 corporate names. Subordination and tranche size are assumed to be
(4)
5. Nomura Fixed Income Research
5% for both the underlying CDOs and the CDO-squared. Below, we used a 0% correlation and a
40% recovery rate unless otherwise noted. (See the table below.)
Hypothetical CDO^2 Characteristics6
quot;Masterquot; CDO
Tranche size 5%
Subordination 5%
Underlying (quot;Innerquot;) CDOs
# of CDOs 5
Tranche size 5%
Subordination 5%
# of reference credits 50
Simulation
Default probability 1.0% annually
Recovery rate 40%
Time Horizon 5 years
0% uniform correlation for a base case
Correlation
(We also look at 20%.)
Source: Nomura
A. Loss Distribution of an Underlying CDO Tranche
As shown below, an underlying CDO tranche’s loss distribution is mostly concentrated at 0% loss.
It is a mezzanine tranche and does not suffer a loss until more junior tranches have been wiped out.
However, as subordination declines from 5% to 3%, the likelihood of zero-loss declines, while the
probability of incurring larger losses increases.
Graph 1
Inner CDO Tranche: Loss Distribution
(Changing subordination in underlyling CDOs)
100%
90%
Subordination = 5%
80%
Subordination = 4%
70%
Subordination = 3%
Frequency
60%
50%
40%
30%
20%
10%
0%
0% 10% 20% 30% 40% 50% 60% 70% 80% 90% 100%
Tranche Loss
* Base case assumptions: tranche size/subordination of 5% for both the inner CDOs and the CDO-squared;
recovery rate of 40%; annual default rate of 1%; time horizon of 5 years; and 0% correlation. Source: Nomura
6
Although it is often ignored, the CDO-squared structure involves gigantic reference portfolios in notional
amounts. For example, suppose that the CDO-tranche sized at $100 million represents 5% of the master
portfolio and five underlying CDOs each represents 5% of the corresponding portfolio. It follows that the master
CDO portfolio has a notional amount of $2 billion (=100 million / 0.05). Moreover, the notional amount of each
underlying CDO is $8 billion (= 2 billion / 5 /.05)! These underlying CDOs are set up just to calculate the losses
to the master portfolio, from which the CDO-squared tranche is created.
(5)
6. Nomura Fixed Income Research
Tranche size is also an important factor affecting the risk of a tranched form of credit risk. As
shown in the table below, a thinner tranche size increases the expected losses as well as the
likelihood of a tranche wipeout. However, the effects are moderate. Also, note that the likelihood
of non-zero loss (i.e., losses reaching the tranche) is unaffected by varying tranche sizes, as it
depends only on the tranche’s subordination.
Table1: Effects of Changing Thickness of Inner CDOs
(Simulation results)
Tranche Thickness 10% 5% 2%
% of non-zero loss 6.7% 6.7% 6.7%
% of tranche wipe out 0.0% 0.0% 1.4%
Expected losses 0.9% 1.7% 4.0%
Source: Nomura
B. Loss Distribution of the CDO-Squared
Any losses in the underlying CDO tranches flow into the CDO-squared and erode it subordination.
Graph 2 reports the loss distribution of the CDO-squared tranche, with varying degrees of
subordination at the underlying CDO level. Comparing this graph with Graph 1, we can see that
loss distribution of the CDO-squared changes more dramatically as the amount of subordination
changes at the underlying CDO level.
Graph 2
Master CDO Tranche: Loss Distribution
(Changing subordination in underlyling CDOs)
100%
90% Subordination = 5%
80% Subordination = 4%
70% Subordination = 3%
60%
Frequency
50%
40%
30%
20%
10%
0%
0% 10% 20% 30% 40% 50% 60% 70% 80% 90% 100%
Tranche Loss
* Base case assumptions: tranche size/subordination of 5% for both the inner CDOs and the CDO-squared;
recovery rate of 40%; annual default rate of 1%; time horizon of 5 years; and 0% correlation. Source: Nomura
Tranche size of the underlying CDO tranche is an even more important factor for the CDO-squared.
As shown in the table below, the thinner tranche size of the underlying CDO tranches causes the
expected losses and the likelihood of a tranche wipeout of the CDO-squared to increase
significantly. Note also that thinner tranche size also affects the risk of non-zero losses for the
CDO-squared, although it has no such effect on the underlying CDOs.
(6)
7. Nomura Fixed Income Research
Table 2: Effects of Changing Thickness of Inner CDOs
on CDO-Squared
(Simulation results)
Tranche Thickness 10% 5% 2%
% of non-zero loss 0.6% 8.2% 32.2%
% of tranche wipe out 0.0% 0.6% 8.2%
Expected losses 0.2% 6.2% 32.2%
Source: Nomura
V. Other Risk Factors
Above, we showed that the CDO-squared tranche is highly sensitive to the characteristics of the
underlying CDOs. Given such high sensitivity, there are additional factors, such as overlaps and
correlation, which greatly influence the risk profile of a CDO-squared.
A. Effects of quot;Overlapsquot; in Reference Credits
Given the limited universe of actively traded credit default swaps (CDS), most CDO-squared deals
have a structure where two or more underlying CDOs reference some of the same credits. This
quot;overlapquot; tends to significantly alter the risk profile of a CDO-squared. For comparison, we create
another CDO-squared, which is otherwise similar to the one we analyzed in the previous section,
but which has 40% (50 out of 200) of reference credits appearing in two of the underlying CDOs.
For example, CDO 1 and CDO 2 each reference ten overlapping credits that appear in both
portfolios. The table below shows the numbers of reference credits that are commonly referenced
by each pair of the underlying CDOs.
Table3: Example of Overlaps
# of Overlaps CDO 1 CDO 2 CDO 3 CDO 4 CDO 5
CDO 1 50 10 10
CDO 2 10 50 10
CDO 3 10 50 10
CDO 4 10 50 10
CDO 5 10 10 50
Source: Nomura
The next graph reveals that overlaps in the underlying CDOs cause the loss distribution to become
quot;fatter-tailed.quot; This is because overlaps have similar effects to having higher default correlation. In
other words, the situation is similar to having two reference credits with a 100% correlation.
However, unlike correlation, overlaps only affect the CDO-squared, not the underlying CDOs, that
are separate from each other.
(7)
8. Nomura Fixed Income Research
Graph 3
Master CDO Tranche: Loss Distribution
(No overlaps vs. overlaps)
90%
80%
No Overlaps
70%
Overlaps
60%
Frequency
50%
40%
30%
20%
10%
0%
0% 10% 20% 30% 40% 50% 60% 70% 80% 90% 100%
Tranche Loss
* Base case assumptions: tranche size/subordination of 5% for both the inner CDOs and the CDO-squared;
recovery rate of 40%; annual default rate of 1%; time horizon of 5 years; and 0% correlation. Source: Nomura
In the table below, we can see that overlaps significantly increase the tail risk, or the probabilities of
non-zero loss and tranche exhaustion. Expected losses to the CDO-squared also increase
significantly, from 6.2% to 37.4%, with 50 out of 200 names appearing in two underlying CDOs.
Table 4: Effects of Overlaps
(Simulation results; 0% correlation)
% of non-zero loss 8.2%
overlap
No
% of tranche wipe out 0.6%
Expected Losses 6.2%
% of non-zero loss 42.8%
Overlap
% of tranche wipe out 20.0%
Expected Losses 37.4%
Source: Nomura
B. Effects of Higher Correlation in the Underlying CDOs
Higher correlation among reference credits in a regular CDO portfolio affects risk profile of various
CDO tranches differently. Graph 4 and Graph 5 show that the CDO-squared is more sensitive to
changing correlation than are the underlying CDO tranches. This is why the CDO-squared is
sometimes described as a quot;correlation intensivequot; instrument.
(8)
9. Nomura Fixed Income Research
Graph 4
Underlying CDO Tranche: Loss Distribution
(Changing correlation)
90%
80%
Correlation = 0%
70%
Correlation = 20%
60%
Frequency
50%
40%
30%
20%
10%
0%
0% 10% 20% 30% 40% 50% 60% 70% 80% 90% 100%
Tranche Loss
* Base case assumptions: tranche size/subordination of 5% for both the inner CDOs and the CDO-squared;
recovery rate of 40%; annual default rate of 1%; time horizon of 5 years; and 0% correlation. Source: Nomura
Comparing Graph 3 and Graph 5, we can see that higher correlation and overlaps have a similar
effect on the risk profile of the CDO-squared. With overlaps or higher correlation, the likelihood of
large losses and tranche wipeout increases significantly.
Graph 5
Master CDO Tranche: Loss Distribution
(Changing correlation)
90%
80%
70% Correlation = 0%
60% Correlation = 20%
Frequency
50%
40%
30%
20%
10%
0%
0% 10% 20% 30% 40% 50% 60% 70% 80% 90% 100%
Tranche Loss
* Base case assumptions: tranche size/subordination of 5% for both the inner CDOs and the CDO-squared;
recovery rate of 40%; annual default rate of 1%; time horizon of 5 years; and 0% correlation. Source: Nomura
Also shown in the table below, higher correlation increases the tail risk, or the probability of a
wipeout, as well as the expected losses, of a CDO-squared. Particularly alarming, the likelihood of
a tranche wipeout increases from less than 1% to more than 10%, as correlation increases from
0% to 20%.
(9)
10. Nomura Fixed Income Research
Table 5: Effects of Correlation
(Simulation results; 0% or 20% correlation)
% of non-zero loss 8.2%
ρ = 0%
% of tranche wipe out 0.6%
Expected Losses 6.2%
% of non-zero loss 27.1%
ρ = 20%
% of tranche wipe out 10.5%
Expected Losses 23.1%
Source: Nomura
An obvious observation from the above results; overlaps and correlation are the key risk factors
here that have similar effects on the risk profile of a CDO-squared. However, the degree of
overlaps depends on a deal's structure and is visible at any time of the deal's life. In contrast, the
correlation structure among the underlying reference credits is difficult to measure and is likely to
change over time.
C. Effects of Changing Default Risk
Varying default rates affect the underlying CDOs as well as the CDO-squared. Higher default rates
make a portfolio riskier and increase expected losses. We ran an additional set of simulation using
a higher default probability of 1.1% annually, compared to 1.0% in our base case. Here again,
higher default rates affect a CDO-squared tranche much more dramatically than the underlying
CDO tranches. We can see in Graph 6 that the higher default rate causes the likelihood of higher
losses to increase, but the loss distribution changes only modestly.
Graph 6
Underlying CDO Tranche: Loss Distribution
(Changing default rates)
100%
90%
Default rate = 1.0%
80% Default rate = 1.1%
Default rate = 1.5%
70%
60%
Frequency
50%
40%
30%
20%
10%
0%
0% 10% 20% 30% 40% 50% 60% 70% 80% 90% 100%
Tranche Loss
* Base case assumptions: tranche size/subordination of 5% for both the inner CDOs and the CDO-squared;
recovery rate of 40%; annual default rate of 1%; time horizon of 5 years; and 0% correlation. Source: Nomura
Graph 7 shows that the effect of higher default risk is more pronounced on the CDO-squared
tranche. For example, the probability of a tranche wipeout goes up from 0.6% to 41.2%, as the
default rate goes up from 1.0% to 1.5%.
(10)
11. Nomura Fixed Income Research
Graph 7
Master CDO Tranche: Loss Distribution
(Changing default rates)
100%
90%
80%
70% Default rate = 1.0%
Default rate = 1.1%
60% Default rate = 1.5%
Frequency
50%
41.2%
40%
30%
20%
0.61%
10%
2.61%
0%
0% 10% 20% 30% 40% 50% 60% 70% 80% 90% 100%
Tranche Loss
* Base case assumptions: tranche size/subordination of 5% for both the inner CDOs and the CDO-squared;
recovery rate of 40%; annual default rate of 1%; time horizon of 5 years; and 0% correlation. Source: Nomura
D. Effects of Changing Recovery Rate
The level of recovery rate also affects both the underlying CDOs and the CDO-squared. A lower
recovery rate means that each default causes a larger amount of loss. Once again, as shown in
Graph 8 and Graph 9 below, a CDO-squared tranche is much more sensitive to the recovery rate
assumption than the underlying CDO tranches, as the effects are magnified through the double-
layer structure.
Graph 8
Underlying CDO Tranche: Loss Distribution
(Changing recovery rates)
100%
90%
80% Recovery rate = 40%
70% Recovery rate = 30%
Recovery rate = 20%
60%
Frequency
50%
40%
30%
20%
10%
0%
0% 10% 20% 30% 40% 50% 60% 70% 80% 90% 100%
Tranche Loss
* Base case assumptions: tranche size/subordination of 5% for both the inner CDOs and the CDO-squared;
recovery rate of 40%; annual default rate of 1%; time horizon of 5 years; and 0% correlation. Source: Nomura
While the loss distribution for the underlying CDO (Graph 8) changes somewhat with the various
levels of recovery rate, the loss distribution for the CDO-squared (Graph 9) exhibits a significant
(11)
12. Nomura Fixed Income Research
shift as the recovery rate goes down from 40% to 20%. Most notably, with a 20% recovery, the
likelihood of a tranche wipeout jumps from less than 1% to 46.3%, highlighting the importance of a
correct assumption about the level of recovery in a CDO-squared.
Graph 9
Master CDO Tranche: Loss Distribution
(Changing recovery rates)
100%
90%
80%
70% Recovery rate = 40%
60% Recovery rate = 30%
Frequency
Recovery rate = 20% 46.28%
50%
40%
30%
20%
10%
0%
0% 10% 20% 30% 40% 50% 60% 70% 80% 90% 100%
Tranche Loss
* Base case assumptions: tranche size/subordination of 5% for both the inner CDOs and the CDO-squared;
recovery rate of 40%; annual default rate of 1%; time horizon of 5 years; and 0% correlation. Source: Nomura
E. Pulling All Together - The quot;Cliffquot; Risk and Scenario Analysis
CDOs-squared are often referred to as being subject to the so-called quot;cliffquot; risk, a phenomenon
where the tranche gets wiped out quickly once losses reach it. To illustrate this point, consider our
hypothetical CDO-squared with the five underlying CDOs referencing 50 credits each. Assuming a
40% recovery, each default wipes out 1.2% of the underlying CDO portfolio. Then, each of the
underlying tranches, worth 5% of the portfolio, covers about four defaults. Since the master CDO
consists of five such tranches, it withstands about 20 defaults. The CDO-squared tranche is
protected by 5% subordination, and it can withstand one default in the master portfolio. However,
given the tranche size of 5%, the second default in the master will completely wipe it out. (See the
box below for a numerical illustration of this situation.)
A Numerical Illustration of the quot;Cliffquot; Risk
A CDO-squared is created from five underlying CDOs, each referencing 50 reference credits.
Subordination and tranche size are set at 5% of the portfolio, both for the underlying CDO tranches
and the CDO-squared tranche. If we assume the notional amount for each reference credit to be
$1, the notional amount of each quot;innerquot; CDO portfolio is $50. The notional amount of each inner
CDO tranche is $2.5 (= 5% x $50). Assuming a 40% recovery rate, each default causes 60 cents of
losses. Each inner CDO tranche is protected by about four defaults (= $2.5 / 0.6), but it will be
wiped out by the ninth default, when losses exceed $5 ($0.6 x 9 = $5.4).
The quot;masterquot; CDO portfolio contains five inner CDO tranches, so the master portfolio's notional
amount is $12.5 (=$2.5 x 5). The CDO-squared tranche represents 5% of the master portfolio and
has subordination of 5%. This translates into tranche size and subordination of $0.625 (=$12.5 x
5%). With each default causing a loss of $0.6, the CDO-squared tranche's credit enhancement and
tranche size are equivalent of just one default!
The cliff risk is a manifestation of relatively thin tranche size, a common feature in the CDO-
squared structure. Because of this risk, it makes a huge difference specifically where defaults
(12)
13. Nomura Fixed Income Research
occur in the deal’s structure. At this point, let us now go back to the chart on Page 3. Suppose two
defaults have already occurred to CDO 1, completely erasing the tranche subordination. If the third
and fourth defaults occur in the same CDO, the tranche would be wiped out. Then, losses will eat
up half of the CDO-squared. On the other hand, if the next two defaults are spread out in CDO 2
and CDO 3, the CDO-squared would remain unimpaired.
For this reason, we think assessing various scenarios, from the worst to the best, is important when
analyzing a CDO-squared. In the best case, defaults occur more evenly, using up all the available
subordination in the underlying CDOs before the CDO-squared is hit with losses. However, in the
worst case, a small number of defaults concentrated in just one inner CDO could wipe out the
entire CDO-squared tranche, while leaving some of the subordination unused in the other
underlying CDOs. The cliff risk may be exacerbated by various factors, such as high correlation,
overlaps, and low recovery rate. Therefore, the worst/best case scenario analysis should
incorporate these additional dimensions of risk.
The table below shows an example of scenario analysis, based on the hypothetical CDO-squared
we discussed in the previous sections. The quot;randomquot; case refers to a situation where defaults
occur evenly spread across the underlying CDOs, using up the underlying CDO subordination
efficiently. The quot;all overlapsquot; case is one stress scenario where defaults occur first in names that
are overlapping. In such a situation, default of one credit causes losses that are equivalent to
having two independent defaults. Finally, the quot;worstquot; case scenario refers to a case where, albeit a
very remote occurrence, defaults are concentrated in just one underlying CDO, and hence losses
hit the CDO-squared tranche while a substantial amount of unused subordination remains in other
underlying CDOs. It is striking that in the worse possible case, default of just five out of 250
reference credits can hit the CDO-squared and, likewise, only seven defaults can wipe it out.
However, the likelihood of such an extreme case is extremely small.
Table 6: Minimum Number of Defaults Needed
to Cause Losses to CDO-Squared*
All
Scenario Random Worst
Overlaps
First $ loss 22 11 5
Tranche wipeout 23 12 7
*Assuming a 40% recovery. Source: Nomura
VI. Rating Agencies' Approaches
All three of the major rating agencies now use Monte Carlo simulation when analyzing CDOs-
squared.7 They simulate defaults of individual reference credits beneath the entire deal structure,
rather than directly simulating losses in the underlying CDO tranches. While the fundamental
approaches are very similar, each rating agency has different assumptions about default rates,
recovery, correlation, etc.
Moody’s rating approach is based on the amount of tranche losses. Each simulation run calculates
tranche losses in the underlying CDOs, based on the number of defaults and assumed recovery
rates. Once underlying tranche losses are collected, losses to the CDO-squared tranche are
calculated, in order to determine the appropriate credit rating.
On the other hand, S&P and Fitch assign a rating to a CDO-squared based on the likelihood of the
tranche suffering the first dollar of loss. That is, the likelihood that the loss amount exceeds the
CDO-squared tranche’s subordination.8 In this approach, the loss distribution obtained via Monte
7
All these agencies‘ CDO models are publicly available, free of charge.
8
Fitch calls this quot;exceedance probability.”
(13)
14. Nomura Fixed Income Research
Carlo simulation is transformed into a graph that depicts probability of losses exceeding a particular
amount. Then, the particular probability is linked to a credit rating with the equivalent quot;defaultquot;
probability. Finally, the required subordination can be determined based on the simulated loss
amount, which corresponds to that probability.9
Given the complexity of CDOs-squared, small differences in assumptions and specifications could
result in a significantly different risk assessment. For example, Moody’s recent report shows that
assuming a 0% correlation for inter-industry issuers cause a CDO model to significantly
underestimate the required level of subordination for a tranche, compared with using their
assumption of 3% inter-industry correlation. The study also finds that the effect is more amplified
for a CDO-squared. 10 This situation might invite a practice called quot;ratings shopping,quot; where a
particular rating agency is preferred because it assigns higher ratings to CDO-squared tranches for
a given deal structure.11
VII. Conclusion – What Questions to Ask?
In this report, we illustrated the basic structure of a CDO-squared and highlighted the main risk
characteristics of this complex instrument. Given the rapid product innovation in the structured
credit arena, we would like to emphasize the importance of analyzing the whole distribution, not just
point estimates, of possible outcomes in assessing risk. This point becomes particularly relevant
for CDOs-squared, given the double-layer structure that amplifies the effects of varying risk factors.
Small variations in the performance of underlying reference credits can affect the performance of a
CDO-squared in an amplified manner. For that reason, we recommend that investors adopt a two-
pronged approach in analyzing a CDO-squared; (1) the use of a simulation model that provides a
quot;bird eye's viewquot; of the potential performance, and (2) a detailed scenario analysis of worst possible
outcomes. Such an approach should allow an investor to make an informed decision as to whether
the incremental spread offered by a CDO-squared adequately compensates the complexity and
additional risk of this sophisticated product.
— E N D —
9
For more details, see; Neugebauer, M., et al., Analysis of Synthetic CDOs of CDOs, Fitch Global Criteria
Report (13 September 2004).
10
The report shows that, for a CDO-squared tranche with thickness and subordination of 5%, the required credit
enhancement to obtain an quot;Aaaquot; rating is 34% with 3% correlation, but the required amount drops to 13.5% with
0% correlation. The figure was See, Marjolin, B., et al., CDO Sensitivity to Inter-Industry Correlation, Moody’s
rating methodology (28 January 2005).
11
See for example, Fender, I. and Kiff, J., CDO Rating Methodology: Some Thoughts on Model Risk and Its
Implications, BIS Working Paper No. 163 (November 2004) (available at http://www.bis.org/publ/work163.pdf).
(14)
15. Nomura Fixed Income Research
VIII.Recent Nomura Fixed Income Research
Fixed Income General Topics
• U.S. Fixed Income 2005 Outlook/2004 Review (16 December 2004)
• ABS Gold Coast Report 2004: Coverage of Selected Sessions of ABS East 2004
(21 October 2004)
• U.S. Fixed Income 2004 Mid-Year Outlook/Review (1 July 2004)
ABS/CDO
• Student Loan ABS 101 – An Introduction to Student Loan ABS (26 January 2005)
• ABS/MBS Disclosure Update #6 (27 December 2004)
• ABS Credit Migrations 2004 (7 December 2004)
• Home Equity ABS Basics (1 November 2004)
• “The Bespoke [bispóuk]” - A Guide to Single-Tranche Synthetic CDOs (17 November
2004)
• Tranching Credit Risk (8 October 2004)
• CDOs in Plain English (13 September 2004)
• Correlation Primer (6 August 2004)
• ABS/MBS Disclosure Update #5: Reactions to the Comment Letters (4 August 2004)
• ABS/MBS Disclosure Update #4: Issues from ASF Sunset Seminar (13 May 2004)
• ABS/MBS Disclosure Update #3: Start Your Engines – Get Ready to Comment
(10 May 2004)
• CDS Primer (12 May 2004)
MBS
• GNPL REMIC Factor Comparison (18 January 2005)
• GNPL Prepayments January Factor (13 January 2005)
• FHA/VA Monthly (11 January 2005)
• FHA/VA Monthly (3 December 2004)
• FHA/VA Monthly (2 November 2004)
• GNPL Prepayments November Factor (10 November 2004)
• GNPL Prepayments October Factor (15 October 2004)
• Special Report ERISA Reform (29 September 2004)
Strategy
• B-Notes and Mezzanine Loans: A Primer (3 February 2005)
• Is Housing Inflation Properly Reflected in the CPI Index? (3 February 2005)
• Trade Recommendation: Re-Evaluate 5-Yr FHLMC Holdings (27 January 2005)
• 5 Reasons Corporate Spreads Could Go Wider (20 January 2005)
• 2004 Cross-Sector Returns – Looking Sharpe (13 January 2005)
• MBS Market Check-Up: January Update (12 January 2005)
• Market Strategy 2005 Outlook/2004 Review (6 January 2005)
• US Consumer Chart Book (4 January 2005)
• 2005 Outlook and Chart Book (20 December 2004)
• California Housing by the Numbers (20 December 2004)
• MBS Market Check-Up: Mid-December Update (10 December 2004)
• CMBS Exposure to KB Toy Store Closings (16 November 2004)
• US Dollar Chartbook (12 November 2004)
• Super-Senior Classes: A New Trend in the CMBS Market? (8 November 2004)
• Basel II – Changing Bank Risk-Based Capital Requirements (8 November 2004)
• ABC’s of CMO Floaters – Creation and Valuation (3 November 2004)
• Swap Spread Regression Model (1 November 2004)
• Is the Treasury Market Overbought? (29 October 2004)
• MBS Vega Durations (27 October 2004)
• Oil Prices – The Long Term Outlook (21 October 2004)
• Regional Home Prices – Part II (21 October 2004)
• TIPS: Underperformance Ahead? (7 October 2004)
• Regional Housing Markets – Some Hot, Some Not (23 September 2004)
Corporates
• Corporate Relative Value (1 February 2005)
• Corporate Weekly - For the week ended January, 28 2005 (31 January 2005)
• Lehman Index Additions (25 January 2005)
• GM Motors (20 January 2005)
• U.S. Corporate Sector Review - December 2004 (5 January 2005)
(15)