SlideShare una empresa de Scribd logo
1 de 66
LBO of Company A
($ in millions)
TRANSACTION ASSUMPTIONS
Closing Date 31-Dec-05
2005 EBITDA $66.0
EBITDA Multiple 6.0x
Purchase Price $396.0
TOTAL USES TOTAL SOUR
Uses Capitalization
Equity Purchase Price $396.0 Revolver
Financing Fees $10.0 Term Loan
Investment Banking Fees $4.0 Second Lien
Legal Fees $1.0 Unsecured Notes with Warrants
Other Fees and Expenses $1.0 Total Debt
Total Fees $16.0 Equity
Total Uses $412.0 Total Sources
SALE OF COMPANY A IN 2010
Closing Date 31-Dec-10 IRR to Financial Sponsor 12/31/05
Initial Equity Investment ($108.0)
2010 EBITDA $84.2 Dividends $0.0
EBITDA Multiple 6.0x Proceeds at Sale $0.0
Purchase Price $505.4 Total Cash Flows to Sponsor ($108.0)
Less: Total Debt ($214.9) IRR Calculation 22.6%
Plus: Cash Balance $48.8
Less: Transaction Fees (1)
($7.1) IRR to Unsecured Lender 12/31/05
Equity Value $332.3 Initial Loan ($66.0)
% Equity to Sponsor 90.0% Cash Interest Received $0.0
Equity to Sponsor $299.0 Principal Repayment at Sale $0.0
Equity from Warrants at Sale $0.0
% Equity to Unsecured Lender 10.0% Total Cash Flows to Lender ($66.0)
Equity to Unsecured Lender $33.2 IRR Calculation 16.6%
(1) Assumes 1% of Purchase Price for Investment Banking Fees, plus $2 million in legal and other expenses.
Summary of Relevent Financial Statistics
Income Statement Statistics 2006
Revenue $126.0
EBITDA $69.3
Net Income $24.2
Net Interest Expense $21.0
Cash Interest Expense $14.1
Taxes $16.1
Revenue Growth na
EBITDA Margin 55%
EBITDA Growth na
Net Income Growth na
Net Income Margin 17%
Balance Sheet / Cash Flow Statistics
Cash $0.0
Total Debt $280.2
Net Debt $280.2
Secured Debt $207.2
Capex $8.8
Increase (Decrease) in W/C ($0.6)
Leverage Ratios
Total Debt / EBITDA 4.0x
Net Debt / EBITDA 4.0x
Secured Debt / EBITDA 3.0x
EBITDA / Net Interest Expense 3.3x
EBITDA / Cash Interest Expense 4.9x
Interest Coverage Statistics
EBITDA / Net Interest Expense 3.3x
EBITDA / Cash Interest 4.9x
EBITDA - Capex / Net Interest Expense 2.9x
EBITDA - Capex / Cash Interest Expense 4.3x
EBITDA - Capex - ∆ W/C / Net Interest Expense 2.9x
EBITDA - Capex - ∆ W/C / Cash Interest Expense 4.3x
EBITDA - Capex - ∆ W/C - Taxes/ Net Interest Expense 2.1x
EBITDA - Capex - ∆ W/C - Taxes/ Cash Interest Expense 3.2x
TOTAL SOURCES
Amount EBITDA % of Interest Rate % of Fully
Funded Multiple Capitalization Cash Pay PIK Diluted Equity
$7.0 0.1x 1.7% 5.0% 0.0% na
$132.0 2.0x 32.0% 5.0% 0.0% na
$99.0 1.5x 24.0% 8.0% 0.0% na
$66.0 1.0x 16.0% 0.0% 10.0% 10%
$304.0 4.6x 73.8%
$108.0 1.6x 26.2%
$412.0 6.2x 100.0%
12/31/06 12/31/07 12/31/08 12/31/09 12/31/10
$0.0 $0.0 $0.0 $0.0 $0.0
$0.0 $0.0 $0.0 $0.0 $0.0
$0.0 $0.0 $0.0 $0.0 $299.0
$0.0 $0.0 $0.0 $0.0 $299.0
12/31/06 12/31/07 12/31/08 12/31/09 12/31/10
$0.0 $0.0 $0.0 $0.0 $0.0
$0.0 $0.0 $0.0 $0.0 $0.0
$0.0 $0.0 $0.0 $0.0 $108.9
$0.0 $0.0 $0.0 $0.0 $33.2
$0.0 $0.0 $0.0 $0.0 $142.1
2007 2008 2009 2010
$132.3 $138.9 $145.9 $153.2
$72.8 $76.4 $80.2 $84.2
$26.7 $29.2 $31.8 $34.6
$20.3 $19.6 $18.8 $18.0
$12.7 $11.4 $10.1 $8.9
$17.8 $19.4 $21.2 $23.0
5% 5% 5% 5%
55% 55% 55% 55%
5% 5% 5% 5%
10% 9% 9% 9%
15% 14% 13% 12%
$6.6 $17.3 $31.3 $48.8
$261.6 $245.1 $229.5 $214.9
$255.1 $227.8 $198.2 $166.1
$181.0 $156.0 $131.0 $106.0
$9.3 $9.7 $10.2 $10.7
$0.4 $0.4 $0.4 $0.4
3.6x 3.2x 2.9x 2.6x
3.5x 3.0x 2.5x 2.0x
2.5x 2.0x 1.6x 1.3x
3.6x 3.9x 4.3x 4.7x
5.7x 6.7x 7.9x 9.5x
3.6x 3.9x 4.3x 4.7x
5.7x 6.7x 7.9x 9.5x
3.1x 3.4x 3.7x 4.1x
5.0x 5.9x 6.9x 8.3x
3.1x 3.4x 3.7x 4.1x
5.0x 5.8x 6.9x 8.2x
2.2x 2.4x 2.6x 2.8x
3.6x 4.1x 4.8x 5.6x
#REF!
Proforma Balance Sheet
($ in millions)
Adjustments Proforma Proforma
Balance Sheet Dec. 31 By the Seller Before New Adjustments Dec. 31
Assets 2005 Pre-Transaction Financing Financing Transaction 2005
Cash $76.9 ($76.9) $0.0 $0.0 $0.0 $0.0
Accounts Receivable $9.9 $0.0 $9.9 $0.0 $0.0 $9.9
Inventory $3.0 $0.0 $3.0 $0.0 $0.0 $3.0
Other Current Assets $1.0 $0.0 $1.0 $0.0 $0.0 $1.0
Total Current Assets $90.7 ($76.9) $13.9 $0.0 $0.0 $13.9
Gross PP&E $345.1 $0.0 $345.1 $0.0 $0.0 $345.1
Cumulative Depreciation $45.0 $0.0 $45.0 $0.0 $0.0 $45.0
Net PP&E $300.1 $0.0 $300.1 $0.0 $0.0 $300.1
Amortizable Intangibles $0.0 $0.0 $0.0 $0.0 $16.0 $16.0
Goodwill $5.0 $0.0 $5.0 $0.0 $84.7 $89.7
Total Assets $395.9 ($76.9) $319.0 $0.0 $100.7 $419.7
Liabilities
Accounts Payable $3.3 $0.0 $3.3 $0.0 $0.0 $3.3
Accrued Liabilities $2.4 $0.0 $2.4 $0.0 $0.0 $2.4
Other Current Liabilities $0.0 $0.0 $0.0 $0.0 $0.0 $0.0
Total Current Liabilities $5.7 $0.0 $5.7 $0.0 $0.0 $5.7
Revolving Credit Facility $10.6 ($10.6) $0.0 $7.0 $0.0 $7.0
Term Loan $200.0 ($200.0) $0.0 $132.0 $0.0 $132.0
Second Lien $0.0 $0.0 $0.0 $99.0 $0.0 $99.0
Unsecured Debt $100.0 ($100.0) $0.0 $66.0 $0.0 $66.0
Other Liabilities $2.0 $0.0 $2.0 $0.0 $0.0 $2.0
Total Liabilities $318.3 ($310.6) $7.7 $304.0 $0.0 $311.7
Shareholders Equity
Retainined Earnings $77.6 $0.0 $77.6 $0.0 ($77.6) $0.0
Other (Plug / Balance) $0.0 $233.8 $233.8 $0.0 ($125.8) $108.0
Total Shareholders Equity $77.6 $233.8 $311.3 $0.0 ($203.3) $108.0
Total Liabilities and Equity $395.9 ($76.9) $319.0 $304.0 ($203.3) $419.7
Check $0.0 $0.0 $0.0 $304.0 ($304.0) $0.0
Goodwill Calculation
Equity Purchase Price $396.0
– Book Value of Equity ($311.3)
+ Existing Goodwill $5.0
= Resulting Goodwill Balance $89.7
Intangibles Assets
Intangible Assets $0.0
+ Financing Fees $10.0
+ M&A Fees $4.0
+ Legal Fees $1.0
+ Other Fees $1.0
= Resulting Intangibles Balance $16.0
COMPANY A FINANCIAL MODEL
HISTORICAL FINANCIAL STATEMENTS PROJECTED FINANCIAL STATEMENTS
($ in millions) Fiscal Year Ending December 31, Pro Forma Fiscal Year Ending December 31,
2001A 2002A 2003A 2004A 2005A 2005P 2006P 2007P 2008P 2009P 2010P
Income Statement
Revenue $100.0 $105.0 $110.0 $115.0 $120.0 $126.0 $132.3 $138.9 $145.9 $153.2
% Growth na 5.0% 4.8% 4.5% 4.3% 5.0% 5.0% 5.0% 5.0% 5.0%
Cost of Goods Sold
(1)
$20.0 $21.0 $22.0 $23.0 $24.0 $25.2 $26.5 $27.8 $29.2 $30.6
COGS as % of Revenue 20.0% 20.0% 20.0% 20.0% 20.0% 20.0% 20.0% 20.0% 20.0% 20.0%
Depreciation $5.0 $5.0 $5.0 $5.0 $5.0 $7.1 $7.3 $7.5 $7.7 $7.9
Amortization $0.0 $0.0 $0.0 $0.0 $0.0 $0.8 $0.8 $0.8 $0.8 $0.8
Gross Profit $75.0 $79.0 $83.0 $87.0 $91.0 $92.9 $97.8 $102.9 $108.2 $113.8
Gross Profit 75.0% 75.2% 75.5% 75.7% 75.8% 73.7% 73.9% 74.1% 74.2% 74.3%
SG&A Expenses $25.0 $26.3 $27.5 $28.8 $30.0 $31.5 $33.1 $34.7 $36.5 $38.3
SG&A as % of Revenue 25.0% 25.0% 25.0% 25.0% 25.0% 25.0% 25.0% 25.0% 25.0% 25.0%
Operating Income / EBIT $50.0 $52.8 $55.5 $58.3 $61.0 $61.4 $64.7 $68.1 $71.8 $75.6
Operating Income / EBIT Margin 50.0% 50.2% 50.5% 50.7% 50.8% 48.7% 48.9% 49.1% 49.2% 49.3%
EBITDA $55.0 $57.8 $60.5 $63.3 $66.0 $69.3 $72.8 $76.4 $80.2 $84.2
EBITDA Margin 55.0% 55.0% 55.0% 55.0% 55.0% 55.0% 55.0% 55.0% 55.0% 55.0%
EBITDA Growth na 5.0% 4.8% 4.5% 4.3% 5.0% 5.0% 5.0% 5.0% 5.0%
Interest Expense $25.0 $24.5 $24.6 $24.6 $24.6 $21.0 $20.4 $19.9 $19.5 $19.3
Interest Income $0.2 $0.2 $0.5 $0.7 $1.0 $0.0 $0.1 $0.3 $0.7 $1.3
Net Interest Expense $24.8 $24.3 $24.1 $23.9 $23.6 $21.0 $20.3 $19.6 $18.8 $18.0
Other Income / (Expense) $2.0 $0.0 ($2.0) $1.0 $0.0 $0.0 $0.0 $0.0 $0.0 $0.0
Pretax Income $27.2 $28.4 $29.4 $35.4 $37.4 $40.4 $44.4 $48.6 $53.0 $57.6
Taxes $10.9 $11.4 $11.8 $14.2 $15.0 $16.1 $17.8 $19.4 $21.2 $23.0
Tax Rate 40.0% 40.0% 40.0% 40.0% 40.0% 40.0% 40.0% 40.0% 40.0% 40.0%
Net Income $16.3 $17.1 $17.6 $21.2 $22.4 $24.2 $26.7 $29.2 $31.8 $34.6
Net Margin 16.3% 16.2% 16.0% 18.5% 18.7% 19.2% 20.1% 21.0% 21.8% 22.6%
Net Income Growth na 4.5% 3.4% 20.4% 5.7% 8.0% 10.0% 9.4% 9.0% 8.7%
(1) Excludes depreciation and amortization
Page 61
COMPANY A FINANCIAL MODEL
HISTORICAL FINANCIAL STATEMENTS PROJECTED FINANCIAL STATEMENTS
($ in millions) Fiscal Year Ending December 31, Pro Forma Fiscal Year Ending December 31,
2001A 2002A 2003A 2004A 2005A 2005P 2006P 2007P 2008P 2009P 2010P
Balance Sheet
Assets
Cash $5.0 $21.3 $39.9 $57.4 $76.9 $0.0 $0.0 $6.6 $17.3 $31.3 $48.8
Accounts Receivable $8.2 $8.6 $9.0 $9.5 $9.9 $9.9 $10.5 $11.0 $11.6 $12.2 $12.8
Inventory $2.5 $2.6 $2.8 $2.9 $3.0 $3.0 $3.2 $3.3 $3.5 $3.6 $3.8
Other Current Assets $1.0 $1.0 $1.0 $1.0 $1.0 $1.0 $1.0 $1.0 $1.0 $1.0 $1.0
Total Current Assets $16.7 $33.6 $52.6 $70.7 $90.7 $13.9 $14.7 $21.9 $33.4 $48.1 $66.4
`
Gross PP&E $318.9 $324.9 $329.9 $336.1 $345.1 $345.1 $353.9 $363.2 $372.9 $383.1 $393.9
Cumulative Depreciation $25.0 $30.0 $35.0 $40.0 $45.0 $45.0 $52.1 $59.3 $66.8 $74.5 $82.3
Net PP&E $293.9 $294.9 $294.9 $296.1 $300.1 $300.1 $301.9 $303.9 $306.1 $308.7 $311.5
Intangibles $16.0 $15.2 $14.4 $13.6 $12.8 $12.0
Goodwill $5.0 $5.0 $5.0 $5.0 $5.0 $89.7 $89.7 $89.7 $89.7 $89.7 $89.7
Total Assets $315.6 $333.5 $352.6 $371.9 $395.9 $419.7 $421.4 $429.8 $442.8 $459.3 $479.6
Liabilities
Accounts Payable $2.8 $3.0 $2.9 $3.3 $3.3 $3.3 $3.5 $3.7 $3.9 $4.1 $4.3
Accrued Liabilities $2.0 $2.1 $2.2 $2.3 $2.4 $2.4 $2.5 $2.6 $2.8 $2.9 $3.1
Other Current Liabilities $1.0 $0.0 $2.0 $1.0 $0.0 $0.0 $1.0 $1.0 $1.0 $1.0 $1.0
Total Current Liabilities $5.8 $5.1 $7.1 $6.6 $5.7 $5.7 $7.0 $7.3 $7.6 $8.0 $8.3
Revolving Credit Facility $8.9 $9.3 $9.7 $10.2 $10.6 $7.0 $1.2 $0.0 $0.0 $0.0 $0.0
Term Loan $200.0 $200.0 $200.0 $200.0 $200.0 $132.0 $107.0 $82.0 $57.0 $32.0 $7.0
Second Lien Debt $99.0 $99.0 $99.0 $99.0 $99.0 $99.0
Unsecured Debt $100.0 $100.0 $100.0 $100.0 $100.0 $66.0 $72.9 $80.6 $89.1 $98.5 $108.9
Other Liabilities $1.0 $2.0 $1.0 $0.0 $2.0 $2.0 $2.0 $2.0 $2.0 $2.0 $2.0
Total Liabilities $315.6 $316.4 $317.9 $316.7 $318.3 $311.7 $289.2 $270.9 $254.8 $239.5 $225.2
$6.9 $7.7 $8.5 $9.4 $10.4
Shareholders Equity
Retainined Earnings $0.0 $17.1 $34.7 $55.1 $77.6 $0.0 $24.2 $50.9 $80.0 $111.8 $146.4
Other (Plug / Balance) $0.0 $0.0 $0.0 $0.0 $0.0 $108.0 $108.0 $108.0 $108.0 $108.0 $108.0
Total Shareholders Equity $0.0 $17.1 $34.7 $55.1 $77.6 $108.0 $132.2 $158.9 $188.0 $219.8 $254.4
Total Liabilities and Equity $315.6 $333.5 $352.6 $371.9 $395.9 $419.7 $421.4 $429.8 $442.8 $459.3 $479.6
Check $0.0 $0.0 $0.0 $0.0 $0.0 $0.0 $0.0 $0.0 $0.0 $0.0 $0.0
Page 62
COMPANY A FINANCIAL MODEL
HISTORICAL FINANCIAL STATEMENTS PROJECTED FINANCIAL STATEMENTS
($ in millions) Fiscal Year Ending December 31, Pro Forma Fiscal Year Ending December 31,
2001A 2002A 2003A 2004A 2005A 2005P 2006P 2007P 2008P 2009P 2010P
Cash Flow
Net Income na $17.1 $17.6 $21.2 $22.4 $24.2 $26.7 $29.2 $31.8 $34.6
Plus / (minus):
Depreciation and Amortization na $5 $5 $5 $5 $8 $8 $8 $8 $9
Changes in Working Capital
Accounts Receivable na ($0.4) ($0.4) ($0.4) ($0.4) ($0.6) ($0.5) ($0.6) ($0.6) ($0.6)
Inventory na ($0.1) ($0.1) ($0.1) ($0.1) ($0.2) ($0.2) ($0.2) ($0.2) ($0.2)
Other Current Assets na $0.0 $0.0 $0.0 $0.0 $0.0 $0.0 $0.0 $0.0 $0.0
Accounts Payable na $0.3 ($0.1) $0.3 $0.0 $0.2 $0.2 $0.2 $0.2 $0.2
Accrued Liabilities na $0.1 $0.1 $0.1 $0.1 $0.1 $0.1 $0.1 $0.1 $0.1
Other Current Liabilities na ($1.0) $2.0 ($1.0) ($1.0) $1.0 $0.0 $0.0 $0.0 $0.0
Change in Other Liabilities na $1 ($1) ($1) $2 $0 $0 $0 $0 $0
Cash Flows from Operations na $21.9 $23.1 $24.1 $28.0 $32.7 $34.3 $37.0 $39.8 $42.8
Cash Flows from Investing
Capital Expenditures na ($6.0) ($7.0) ($8.0) ($9.0) ($8.8) ($9.3) ($9.7) ($10.2) ($10.7)
Asset Dispostions na $0.0 $2.0 $1.0 $0.0 $0.0 $0.0 $0.0 $0.0 $0.0
Cash Flows from Investing na ($6.0) ($5.0) ($7.0) ($9.0) ($8.8) ($9.3) ($9.7) ($10.2) ($10.7)
Cash Flows from Financing
Change in Revolver na $0.4 $0.4 $0.4 $0.4 ($5.8) ($1.2) $0.0 $0.0 $0.0
Change in Term Loan na $0.0 $0.0 $0.0 $0.0 ($25.0) ($25.0) ($25.0) ($25.0) ($25.0)
Change in Second Lien $0.0 $0.0 $0.0 $0.0 $0.0
Change in Unsecured Debt na $0.0 $0.0 $0.0 $0.0 $6.9 $7.7 $8.5 $9.4 $10.4
Total Cash Flows from Financing na $0.4 $0.4 $0.4 $0.4 ($23.8) ($18.5) ($16.5) ($15.6) ($14.6)
Total Cash Flow na $16.3 $18.5 $17.6 $19.5 $0.0 $6.6 $10.8 $14.0 $17.4
Beginning Cash Position na $5.0 $21.3 $39.9 $57.4 $0.0 $0.0 $6.6 $17.3 $31.3
Change in Cash Position na $16.3 $18.5 $17.6 $19.5 $0.0 $6.6 $10.8 $14.0 $17.4
Ending Cash Position na $21.3 $39.9 $57.4 $76.9 $0.0 $6.6 $17.3 $31.3 $48.8
Page 63
COMPANY A FINANCIAL MODEL
HISTORICAL FINANCIAL STATEMENTS PROJECTED FINANCIAL STATEMENTS
($ in millions) Fiscal Year Ending December 31, Pro Forma Fiscal Year Ending December 31,
2001A 2002A 2003A 2004A 2005A 2005P 2006P 2007P 2008P 2009P 2010P
Cash flow before Revolver $5.8 $7.8 $17.3 $31.3 $48.8
Debt and Interest Schedule
Revolver
Beginning Revolver Balance $8.9 $9.3 $9.7 $10.2 $7.0 $1.2 $0.0 $0.0 $0.0
(Paydown) / Drawdown $0.4 $0.4 $0.4 $0.4 ($5.8) ($1.2) $0.0 $0.0 $0.0
Ending Revolver Balance $9.3 $9.7 $10.2 $10.6 $1.2 $0.0 $0.0 $0.0 $0.0
Interest Rate 6.0% 6.0% 6.0% 6.0% 5.00% 5.00% 5.00% 5.00% 5.00%
Cash Pay Interest Expense $0.54 $0.57 $0.60 $0.62 $0.21 $0.03 $0.00 $0.00 $0.00
Term Loan
Term Loan Beginning Balance $200.0 $200.0 $200.0 $200.0 $132.0 $107.0 $82.0 $57.0 $32.0
(Paydown) / Drawdown $0.0 $0.0 $0.0 $0.0 ($25.0) ($25.0) ($25.0) ($25.0) ($25.0)
Term Loan Ending Balance $200.0 $200.0 $200.0 $200.0 $107.0 $82.0 $57.0 $32.0 $7.0
Interest Rate 6.00% 6.00% 6.00% 6.00% 5.00% 5.00% 5.00% 5.00% 5.00%
Cash Pay Interest Expense $12.0 $12.0 $12.0 $12.0 $6.0 $4.7 $3.5 $2.2 $1.0
Second Lien Debt
Second Lien Debt Beginning Balance $99.0 $99.0 $99.0 $99.0 $99.0
(Paydown) / Drawdown $0.0 $0.0 $0.0 $0.0 $0.0
Second Lien Debt Ending Balance $99.0 $99.0 $99.0 $99.0 $99.0
Cash Pay Interest Rate 8.00% 8.00% 8.00% 8.00% 8.00%
Cash Pay Interest Expense $7.9 $7.9 $7.9 $7.9 $7.9
PIK Interest Rate 0% 0% 0% 0% 0%
PIK Interest Expense $0.0 $0.0 $0.0 $0.0 $0.0
Unsecured Debt
Unsecured Debt Beginning Balance $100.0 $100.0 $100.0 $100.0 $66.0 $72.9 $80.6 $89.1 $98.5
(Paydown) / Drawdown $0.0 $0.0 $0.0 $0.0 $0.0 $0.0 $0.0 $0.0 $0.0
Unsecured Debt Ending Balance $100.0 $100.0 $100.0 $100.0 $72.9 $80.6 $89.1 $98.5 $108.9
Cash Pay Interest Rate 12% 12% 12% 12% 0% 0% 0% 0% 0%
Cash Pay Interest Expense $12.0 $12.0 $12.0 $12.0 $0.0 $0.0 $0.0 $0.0 $0.0
PIK Interest Rate 10% 10% 10% 10% 10%
PIK Interest Expense $6.9 $7.7 $8.5 $9.4 $10.4
Total Interest Expense $24.5 $24.6 $24.6 $24.6 $21.0 $20.4 $19.9 $19.5 $19.3
Total Cash Pay Interest Rate Expense $14.1 $12.7 $11.4 $10.1 $8.9
Total PIK Interest Rate Expense $6.9 $7.7 $8.5 $9.4 $10.4
Interest Earned on Cash $0.2 $0.5 $0.7 $1.0 $0.0 $0.1 $0.3 $0.7 $1.3
Page 64
COMPANY A FINANCIAL MODEL
HISTORIC VARIABLES AND ASSUMPTIONS FOR PROJECTIONS
HISTORICAL VARIABLES AND DRIVERS ASSUMPTIONS FOR PROJECTIONS
Fiscal Year Ending December 31, Fiscal Year Ending December 31,
2001A 2002A 2003A 2004A 2005A 2006P 2007P 2008P 2009P 2010P
Income Statement Drivers / Assumptions
Revenue Growth Rate na 5.0% 4.8% 4.5% 4.3% 5.0% 5.0% 5.0% 5.0% 5.0%
COGS as % of Revenue 20.0% 20.0% 20.0% 20.0% 20.0% 20.0% 20.0% 20.0% 20.0% 20.0%
Depreciation as % of Gross PP&E 1.6% 1.5% 1.5% 1.5% 1.4% 2.0% 2.0% 2.0% 2.0% 2.0%
Goodwill Amortization
Intangible Amortization Per Year 20
Intangible Amortization $0.8 $0.8 $0.8 $0.8 $0.8
SG&A as % of Sales 25.0% 25.0% 25.0% 25.0% 25.0% 25.0% 25.0% 25.0% 25.0% 25.0%
Other Income / (Expense) $2.0 $0.0 ($2.0) $1.0 $0.0 $0.0 $0.0 $0.0 $0.0 $0.0
Tax Rate 40.0% 40.0% 40.0% 40.0% 40.0% 40.0% 40.0% 40.0% 40.0% 40.0%
Balance Sheet Drivers / Assumptions
Days Accounts Receivable 30 30 30 30 30 30 30 30 30 30
Days Inventory 45 45 45 45 45 45 45 45 45 45
Other Current Assets $1.0 $1.0 $1.0 $1.0 $1.0 $1.0 $1.0 $1.0 $1.0 $1.0
Amortize Goodwill? (yes or no) $0.0 $0.0 $0.0 $0.0 $0.0
Capex as % of Sales na 5.7% 6.4% 7.0% 7.5% 7.0% 7.0% 7.0% 7.0% 7.0%
Asset Disposition na $0.0 $2.0 $1.0 $0.0 $0.0 $0.0 $0.0 $0.0 $0.0
Days Payable 50 52 48 51 49 50 50 50 50 50
Accrued Liabilities as % of COGS 10.0% 10.0% 10.0% 10.0% 10.0% 10.0% 10.0% 10.0% 10.0% 10.0%
Other Current Liabilities $1.0 $0.0 $2.0 $1.0 $0.0 $1.0 $1.0 $1.0 $1.0 $1.0
Other Liailities $1.0 $2.0 $1.0 $0.0 $2.0 $2.0 $2.0 $2.0 $2.0 $2.0
Interest Rates
Revolver 2.0%+li 6.00% 6.00% 6.00% 6.00% 6.00% 5.00% 5.00% 5.00% 5.00% 5.00%
Term Loan 2.0%+li 6.00% 6.00% 6.00% 6.00% 6.00% 5.00% 5.00% 5.00% 5.00% 5.00%
Second Lien Debt (Cash) 8.00% 8.00% 8.00% 8.00% 8.00%
Second Lien Debt (PIK) 0.00% 0.00% 0.00% 0.00% 0.00%
Unsecured Debt (Cash) 12.0% 12.00% 12.00% 12.00% 12.00% 12.00% 0.00% 0.00% 0.00% 0.00% 0.00%
Unsecured Debt (PIK) 10.00% 10.00% 10.00% 10.00% 10.00%
LIBOR 4.00% 4.00% 4.00% 4.00% 4.00% 4.25% 4.50% 4.75% 5.00% 5.25%
Interest earned on cash 2% 2.00% 2.00% 2.00% 2.00% 2.00% 2.25% 2.50% 2.75% 3.00% 3.25%
Page 65
COMPANY A FINANCIAL MODEL
SENSITIVITIES
($ in millions) 2010 EBITDA FOR RANGE OF REVENUE GROWTH RATES AND COGS
Annual Revenue Growth Rate
$84.2 -20% -15% -10% -5% 0% 5% 10% 15% 20%
14% $24.0 $32.5 $43.2 $56.6 $73.2 $93.4 $117.9 $147.2 $182.1
16% $23.2 $31.4 $41.8 $54.8 $70.8 $90.4 $114.0 $142.4 $176.2
18% $22.4 $30.3 $40.4 $52.9 $68.4 $87.3 $110.2 $137.6 $170.2
20% $21.6 $29.3 $39.0 $51.1 $66.0 $84.2 $106.3 $132.7 $164.2
22% $20.8 $28.2 $37.6 $49.2 $63.6 $81.2 $102.4 $127.9 $158.3
24% $20.1 $27.2 $36.1 $47.4 $61.2 $78.1 $98.6 $123.1 $152.3
26% $19.3 $26.1 $34.7 $45.5 $58.8 $75.0 $94.7 $118.3 $146.3
Shading indicates base case scenario
COGSas%of
Sales
Page 66

Más contenido relacionado

La actualidad más candente

Swifton CFOs LLC - Boston BizSpark presentation - Financial Projections for I...
Swifton CFOs LLC - Boston BizSpark presentation - Financial Projections for I...Swifton CFOs LLC - Boston BizSpark presentation - Financial Projections for I...
Swifton CFOs LLC - Boston BizSpark presentation - Financial Projections for I...
David Fogel
 
Swifton CFOs - McCarter English - Fin Proj 100511
Swifton CFOs - McCarter English - Fin Proj 100511Swifton CFOs - McCarter English - Fin Proj 100511
Swifton CFOs - McCarter English - Fin Proj 100511
David Fogel
 
Final Performance Statistics.PDF
Final Performance Statistics.PDFFinal Performance Statistics.PDF
Final Performance Statistics.PDF
Eunice Fei Jin Shi
 
Thanks to David Godofsky for his enlightening and entertaining presentation o...
Thanks to David Godofsky for his enlightening and entertaining presentation o...Thanks to David Godofsky for his enlightening and entertaining presentation o...
Thanks to David Godofsky for his enlightening and entertaining presentation o...
Carol Buckmann
 
PPT CAKECUP
PPT CAKECUPPPT CAKECUP
PPT CAKECUP
CAKECUP
 
Apartment Presentation
Apartment PresentationApartment Presentation
Apartment Presentation
bdswope07
 
My Rental Property Deal
My Rental Property DealMy Rental Property Deal
My Rental Property Deal
Scott Anders
 

La actualidad más candente (17)

Comparative ratio analysis
Comparative ratio analysisComparative ratio analysis
Comparative ratio analysis
 
Swifton CFOs LLC - Boston BizSpark presentation - Financial Projections for I...
Swifton CFOs LLC - Boston BizSpark presentation - Financial Projections for I...Swifton CFOs LLC - Boston BizSpark presentation - Financial Projections for I...
Swifton CFOs LLC - Boston BizSpark presentation - Financial Projections for I...
 
Digital realty 3 q17 earnings presentation final
Digital realty 3 q17 earnings presentation finalDigital realty 3 q17 earnings presentation final
Digital realty 3 q17 earnings presentation final
 
Swifton - The Capital Network - Financial Projections
Swifton - The Capital Network - Financial ProjectionsSwifton - The Capital Network - Financial Projections
Swifton - The Capital Network - Financial Projections
 
Swifton CFOs - McCarter English - Fin Proj 100511
Swifton CFOs - McCarter English - Fin Proj 100511Swifton CFOs - McCarter English - Fin Proj 100511
Swifton CFOs - McCarter English - Fin Proj 100511
 
Final Performance Statistics.PDF
Final Performance Statistics.PDFFinal Performance Statistics.PDF
Final Performance Statistics.PDF
 
2016 FFIN Annual Meeting Presentation
2016 FFIN Annual Meeting Presentation2016 FFIN Annual Meeting Presentation
2016 FFIN Annual Meeting Presentation
 
45256e8f 40ab-4d40-bba3-4193e1577515
45256e8f 40ab-4d40-bba3-4193e157751545256e8f 40ab-4d40-bba3-4193e1577515
45256e8f 40ab-4d40-bba3-4193e1577515
 
The Cumberland Investment
The Cumberland InvestmentThe Cumberland Investment
The Cumberland Investment
 
Thanks to David Godofsky for his enlightening and entertaining presentation o...
Thanks to David Godofsky for his enlightening and entertaining presentation o...Thanks to David Godofsky for his enlightening and entertaining presentation o...
Thanks to David Godofsky for his enlightening and entertaining presentation o...
 
PPT CAKECUP
PPT CAKECUPPPT CAKECUP
PPT CAKECUP
 
Charitable Lead Trusts
Charitable Lead TrustsCharitable Lead Trusts
Charitable Lead Trusts
 
Payoff Your Mortgage Early
Payoff Your Mortgage EarlyPayoff Your Mortgage Early
Payoff Your Mortgage Early
 
Financial Planning
Financial PlanningFinancial Planning
Financial Planning
 
Project 2
Project 2Project 2
Project 2
 
Apartment Presentation
Apartment PresentationApartment Presentation
Apartment Presentation
 
My Rental Property Deal
My Rental Property DealMy Rental Property Deal
My Rental Property Deal
 

Destacado

COBIT 5 as an IT Management Best Practices Framework - by Goh Boon Nam
COBIT 5 as an IT Management Best Practices Framework - by Goh Boon NamCOBIT 5 as an IT Management Best Practices Framework - by Goh Boon Nam
COBIT 5 as an IT Management Best Practices Framework - by Goh Boon Nam
NUS-ISS
 
Comparison of it governance framework-COBIT, ITIL, BS7799
Comparison of it governance framework-COBIT, ITIL, BS7799Comparison of it governance framework-COBIT, ITIL, BS7799
Comparison of it governance framework-COBIT, ITIL, BS7799
Meghna Verma
 

Destacado (15)

Effective COBIT 5 Foundation Course Materials
Effective COBIT 5 Foundation Course MaterialsEffective COBIT 5 Foundation Course Materials
Effective COBIT 5 Foundation Course Materials
 
Study Notes - COBIT 5 Foundation Certification
Study Notes - COBIT 5 Foundation CertificationStudy Notes - COBIT 5 Foundation Certification
Study Notes - COBIT 5 Foundation Certification
 
Cobit 5 - An Overview
Cobit 5 - An OverviewCobit 5 - An Overview
Cobit 5 - An Overview
 
Cobit 5 Business Framework -Governance and Management of Enterprise IT
Cobit 5  Business Framework -Governance and Management of Enterprise ITCobit 5  Business Framework -Governance and Management of Enterprise IT
Cobit 5 Business Framework -Governance and Management of Enterprise IT
 
COBIT 5 as an IT Management Best Practices Framework - by Goh Boon Nam
COBIT 5 as an IT Management Best Practices Framework - by Goh Boon NamCOBIT 5 as an IT Management Best Practices Framework - by Goh Boon Nam
COBIT 5 as an IT Management Best Practices Framework - by Goh Boon Nam
 
What is IT Governance?
What is IT Governance?What is IT Governance?
What is IT Governance?
 
What is Cobit
What is CobitWhat is Cobit
What is Cobit
 
COBIT®5 - Foundation
COBIT®5 - FoundationCOBIT®5 - Foundation
COBIT®5 - Foundation
 
10+ Getting to Know You Activities for Kids
10+ Getting to Know You Activities for  Kids10+ Getting to Know You Activities for  Kids
10+ Getting to Know You Activities for Kids
 
It governance & cobit 5
It governance & cobit 5It governance & cobit 5
It governance & cobit 5
 
Governance and Management of Enterprise IT with COBIT 5 Framework
Governance and Management of Enterprise IT with COBIT 5 FrameworkGovernance and Management of Enterprise IT with COBIT 5 Framework
Governance and Management of Enterprise IT with COBIT 5 Framework
 
COBIT 5 IT Governance Model: an Introduction
COBIT 5 IT Governance Model: an IntroductionCOBIT 5 IT Governance Model: an Introduction
COBIT 5 IT Governance Model: an Introduction
 
Comparison of it governance framework-COBIT, ITIL, BS7799
Comparison of it governance framework-COBIT, ITIL, BS7799Comparison of it governance framework-COBIT, ITIL, BS7799
Comparison of it governance framework-COBIT, ITIL, BS7799
 
CoBIT 5 (A brief Description)
CoBIT 5 (A brief Description)CoBIT 5 (A brief Description)
CoBIT 5 (A brief Description)
 
10+ Getting to Know You Activities for Teens & Adults
10+ Getting to Know You Activities for Teens & Adults10+ Getting to Know You Activities for Teens & Adults
10+ Getting to Know You Activities for Teens & Adults
 

Similar a Sample LBO Model Template – 2

ACG_Cup_-_Valuation
ACG_Cup_-_ValuationACG_Cup_-_Valuation
ACG_Cup_-_Valuation
Ike Ekeh
 
Caribe entertainment powerpoint week 6
Caribe entertainment powerpoint week 6Caribe entertainment powerpoint week 6
Caribe entertainment powerpoint week 6
Caribe Entertainment
 
3 q11 earnings_presentation__final
3 q11 earnings_presentation__final3 q11 earnings_presentation__final
3 q11 earnings_presentation__final
manoranjanpattanayak
 
Round 2Dec. 31, 2015 C57912AndrewsTracy CalhounVict.docx
Round 2Dec. 31, 2015 C57912AndrewsTracy CalhounVict.docxRound 2Dec. 31, 2015 C57912AndrewsTracy CalhounVict.docx
Round 2Dec. 31, 2015 C57912AndrewsTracy CalhounVict.docx
joellemurphey
 
Week5businessplan
Week5businessplanWeek5businessplan
Week5businessplan
jeanette_
 
FORK THE PORKZane & Brian1Assumptions6 .docx
FORK THE PORKZane & Brian1Assumptions6 .docxFORK THE PORKZane & Brian1Assumptions6 .docx
FORK THE PORKZane & Brian1Assumptions6 .docx
budbarber38650
 
Amazon ebay comparison presentation with simple regression analysis
Amazon ebay comparison presentation with simple regression analysisAmazon ebay comparison presentation with simple regression analysis
Amazon ebay comparison presentation with simple regression analysis
Chien Jaw
 
Radio Shack Integrated Cash Flow Model_DCF
Radio Shack Integrated Cash Flow Model_DCFRadio Shack Integrated Cash Flow Model_DCF
Radio Shack Integrated Cash Flow Model_DCF
Dane Durham
 
Topic 10 Financial Statement Analysis
Topic 10 Financial Statement AnalysisTopic 10 Financial Statement Analysis
Topic 10 Financial Statement Analysis
guest441011
 
Topic 10 Financial Statement Analysis
Topic 10 Financial Statement AnalysisTopic 10 Financial Statement Analysis
Topic 10 Financial Statement Analysis
mandalina landy
 

Similar a Sample LBO Model Template – 2 (20)

Flevy.com - LBO Model Template
Flevy.com - LBO Model TemplateFlevy.com - LBO Model Template
Flevy.com - LBO Model Template
 
Peter gallagher djib column highlights
Peter gallagher djib column highlightsPeter gallagher djib column highlights
Peter gallagher djib column highlights
 
Case 2
Case 2Case 2
Case 2
 
Sample LBO Model Template
Sample LBO Model TemplateSample LBO Model Template
Sample LBO Model Template
 
ACG Cup - Valuation
ACG Cup - ValuationACG Cup - Valuation
ACG Cup - Valuation
 
ACG_Cup_-_Valuation
ACG_Cup_-_ValuationACG_Cup_-_Valuation
ACG_Cup_-_Valuation
 
Supplemental Data – Q2 2014 Earnings Call
Supplemental Data – Q2 2014 Earnings CallSupplemental Data – Q2 2014 Earnings Call
Supplemental Data – Q2 2014 Earnings Call
 
Caribe entertainment powerpoint week 6
Caribe entertainment powerpoint week 6Caribe entertainment powerpoint week 6
Caribe entertainment powerpoint week 6
 
3 q11 earnings_presentation__final
3 q11 earnings_presentation__final3 q11 earnings_presentation__final
3 q11 earnings_presentation__final
 
Financial forecast
Financial forecastFinancial forecast
Financial forecast
 
Round 2Dec. 31, 2015 C57912AndrewsTracy CalhounVict.docx
Round 2Dec. 31, 2015 C57912AndrewsTracy CalhounVict.docxRound 2Dec. 31, 2015 C57912AndrewsTracy CalhounVict.docx
Round 2Dec. 31, 2015 C57912AndrewsTracy CalhounVict.docx
 
Week5businessplan
Week5businessplanWeek5businessplan
Week5businessplan
 
FORK THE PORKZane & Brian1Assumptions6 .docx
FORK THE PORKZane & Brian1Assumptions6 .docxFORK THE PORKZane & Brian1Assumptions6 .docx
FORK THE PORKZane & Brian1Assumptions6 .docx
 
Amazon ebay comparison presentation with simple regression analysis
Amazon ebay comparison presentation with simple regression analysisAmazon ebay comparison presentation with simple regression analysis
Amazon ebay comparison presentation with simple regression analysis
 
Managing for value creation
Managing for value creationManaging for value creation
Managing for value creation
 
Investor Relations Site Graphics Placemat
Investor Relations Site Graphics PlacematInvestor Relations Site Graphics Placemat
Investor Relations Site Graphics Placemat
 
Radio Shack Integrated Cash Flow Model_DCF
Radio Shack Integrated Cash Flow Model_DCFRadio Shack Integrated Cash Flow Model_DCF
Radio Shack Integrated Cash Flow Model_DCF
 
What Is A Financial Model
What Is A Financial ModelWhat Is A Financial Model
What Is A Financial Model
 
Topic 10 Financial Statement Analysis
Topic 10 Financial Statement AnalysisTopic 10 Financial Statement Analysis
Topic 10 Financial Statement Analysis
 
Topic 10 Financial Statement Analysis
Topic 10 Financial Statement AnalysisTopic 10 Financial Statement Analysis
Topic 10 Financial Statement Analysis
 

Más de Flevy.com Best Practices

100 Case Studies on Strategy & Transformation.pdf
100 Case Studies on Strategy & Transformation.pdf100 Case Studies on Strategy & Transformation.pdf
100 Case Studies on Strategy & Transformation.pdf
Flevy.com Best Practices
 
Project Management for MBA (in French)
Project Management for MBA (in French)Project Management for MBA (in French)
Project Management for MBA (in French)
Flevy.com Best Practices
 
Customer-centric Culture
Customer-centric CultureCustomer-centric Culture
Customer-centric Culture
Flevy.com Best Practices
 
[Whitepaper] 8 Key Steps of Data Integration: Restructuring Redeployment Asse...
[Whitepaper] 8 Key Steps of Data Integration: Restructuring Redeployment Asse...[Whitepaper] 8 Key Steps of Data Integration: Restructuring Redeployment Asse...
[Whitepaper] 8 Key Steps of Data Integration: Restructuring Redeployment Asse...
Flevy.com Best Practices
 
[Whitepaper] The Definitive Guide to Strategic Planning: Here’s What You Need...
[Whitepaper] The Definitive Guide to Strategic Planning: Here’s What You Need...[Whitepaper] The Definitive Guide to Strategic Planning: Here’s What You Need...
[Whitepaper] The Definitive Guide to Strategic Planning: Here’s What You Need...
Flevy.com Best Practices
 
[Whitepaper] The “Theory of Constraints:” What’s Limiting Your Organization?
[Whitepaper] The “Theory of Constraints:” What’s Limiting Your Organization?[Whitepaper] The “Theory of Constraints:” What’s Limiting Your Organization?
[Whitepaper] The “Theory of Constraints:” What’s Limiting Your Organization?
Flevy.com Best Practices
 
[Whitepaper] A Great Leadership Experience: Dr. Rachid Yazami, Inventor of th...
[Whitepaper] A Great Leadership Experience: Dr. Rachid Yazami, Inventor of th...[Whitepaper] A Great Leadership Experience: Dr. Rachid Yazami, Inventor of th...
[Whitepaper] A Great Leadership Experience: Dr. Rachid Yazami, Inventor of th...
Flevy.com Best Practices
 
[Whitepaper] Finding It Hard to Manage Conflict at the Workplace? Use the Tho...
[Whitepaper] Finding It Hard to Manage Conflict at the Workplace? Use the Tho...[Whitepaper] Finding It Hard to Manage Conflict at the Workplace? Use the Tho...
[Whitepaper] Finding It Hard to Manage Conflict at the Workplace? Use the Tho...
Flevy.com Best Practices
 
[Whitepaper] Key Account Management: Handling Large Global Accounts the Right...
[Whitepaper] Key Account Management: Handling Large Global Accounts the Right...[Whitepaper] Key Account Management: Handling Large Global Accounts the Right...
[Whitepaper] Key Account Management: Handling Large Global Accounts the Right...
Flevy.com Best Practices
 
[Whitepaper] Nudge Theory: An Effective Way to Transform Negative Behaviors
[Whitepaper] Nudge Theory: An Effective Way to Transform Negative Behaviors[Whitepaper] Nudge Theory: An Effective Way to Transform Negative Behaviors
[Whitepaper] Nudge Theory: An Effective Way to Transform Negative Behaviors
Flevy.com Best Practices
 
[Whitepaper] Business Model Innovation: Creation of Scalable Business Models ...
[Whitepaper] Business Model Innovation: Creation of Scalable Business Models ...[Whitepaper] Business Model Innovation: Creation of Scalable Business Models ...
[Whitepaper] Business Model Innovation: Creation of Scalable Business Models ...
Flevy.com Best Practices
 
[Whitepaper] Shareholder Value Traps: How to Evade Them and Focus on Value Cr...
[Whitepaper] Shareholder Value Traps: How to Evade Them and Focus on Value Cr...[Whitepaper] Shareholder Value Traps: How to Evade Them and Focus on Value Cr...
[Whitepaper] Shareholder Value Traps: How to Evade Them and Focus on Value Cr...
Flevy.com Best Practices
 

Más de Flevy.com Best Practices (20)

100 Case Studies on Strategy & Transformation.pdf
100 Case Studies on Strategy & Transformation.pdf100 Case Studies on Strategy & Transformation.pdf
100 Case Studies on Strategy & Transformation.pdf
 
Project Management for MBA (in French)
Project Management for MBA (in French)Project Management for MBA (in French)
Project Management for MBA (in French)
 
4 Stages of Disruption
4 Stages of Disruption4 Stages of Disruption
4 Stages of Disruption
 
Customer-centric Culture
Customer-centric CultureCustomer-centric Culture
Customer-centric Culture
 
[Whitepaper] Business Transformation Success Factors
[Whitepaper] Business Transformation Success Factors[Whitepaper] Business Transformation Success Factors
[Whitepaper] Business Transformation Success Factors
 
[Whitepaper] 5 Dimensions of Employee Engagement Scorecard
[Whitepaper] 5 Dimensions of Employee Engagement Scorecard[Whitepaper] 5 Dimensions of Employee Engagement Scorecard
[Whitepaper] 5 Dimensions of Employee Engagement Scorecard
 
[Whitepaper] Digital Transformation: Workforce Digitization
[Whitepaper] Digital Transformation: Workforce Digitization[Whitepaper] Digital Transformation: Workforce Digitization
[Whitepaper] Digital Transformation: Workforce Digitization
 
[Whitepaper] Strategic Human Resources: Evolution of Competition
[Whitepaper] Strategic Human Resources: Evolution of Competition[Whitepaper] Strategic Human Resources: Evolution of Competition
[Whitepaper] Strategic Human Resources: Evolution of Competition
 
[Whitepaper] 8 Key Steps of Data Integration: Restructuring Redeployment Asse...
[Whitepaper] 8 Key Steps of Data Integration: Restructuring Redeployment Asse...[Whitepaper] 8 Key Steps of Data Integration: Restructuring Redeployment Asse...
[Whitepaper] 8 Key Steps of Data Integration: Restructuring Redeployment Asse...
 
[Whitepaper] Strategy Classics: Value Disciplines Model
[Whitepaper] Strategy Classics: Value Disciplines Model[Whitepaper] Strategy Classics: Value Disciplines Model
[Whitepaper] Strategy Classics: Value Disciplines Model
 
[Whitepaper] The Definitive Guide to Strategic Planning: Here’s What You Need...
[Whitepaper] The Definitive Guide to Strategic Planning: Here’s What You Need...[Whitepaper] The Definitive Guide to Strategic Planning: Here’s What You Need...
[Whitepaper] The Definitive Guide to Strategic Planning: Here’s What You Need...
 
[Whitepaper] The Definitive Introduction to Strategy Development and Strategy...
[Whitepaper] The Definitive Introduction to Strategy Development and Strategy...[Whitepaper] The Definitive Introduction to Strategy Development and Strategy...
[Whitepaper] The Definitive Introduction to Strategy Development and Strategy...
 
[Whitepaper] The “Theory of Constraints:” What’s Limiting Your Organization?
[Whitepaper] The “Theory of Constraints:” What’s Limiting Your Organization?[Whitepaper] The “Theory of Constraints:” What’s Limiting Your Organization?
[Whitepaper] The “Theory of Constraints:” What’s Limiting Your Organization?
 
[Whitepaper] Transportation Cost Reduction in Supply Chain Management
[Whitepaper] Transportation Cost Reduction in Supply Chain Management[Whitepaper] Transportation Cost Reduction in Supply Chain Management
[Whitepaper] Transportation Cost Reduction in Supply Chain Management
 
[Whitepaper] A Great Leadership Experience: Dr. Rachid Yazami, Inventor of th...
[Whitepaper] A Great Leadership Experience: Dr. Rachid Yazami, Inventor of th...[Whitepaper] A Great Leadership Experience: Dr. Rachid Yazami, Inventor of th...
[Whitepaper] A Great Leadership Experience: Dr. Rachid Yazami, Inventor of th...
 
[Whitepaper] Finding It Hard to Manage Conflict at the Workplace? Use the Tho...
[Whitepaper] Finding It Hard to Manage Conflict at the Workplace? Use the Tho...[Whitepaper] Finding It Hard to Manage Conflict at the Workplace? Use the Tho...
[Whitepaper] Finding It Hard to Manage Conflict at the Workplace? Use the Tho...
 
[Whitepaper] Key Account Management: Handling Large Global Accounts the Right...
[Whitepaper] Key Account Management: Handling Large Global Accounts the Right...[Whitepaper] Key Account Management: Handling Large Global Accounts the Right...
[Whitepaper] Key Account Management: Handling Large Global Accounts the Right...
 
[Whitepaper] Nudge Theory: An Effective Way to Transform Negative Behaviors
[Whitepaper] Nudge Theory: An Effective Way to Transform Negative Behaviors[Whitepaper] Nudge Theory: An Effective Way to Transform Negative Behaviors
[Whitepaper] Nudge Theory: An Effective Way to Transform Negative Behaviors
 
[Whitepaper] Business Model Innovation: Creation of Scalable Business Models ...
[Whitepaper] Business Model Innovation: Creation of Scalable Business Models ...[Whitepaper] Business Model Innovation: Creation of Scalable Business Models ...
[Whitepaper] Business Model Innovation: Creation of Scalable Business Models ...
 
[Whitepaper] Shareholder Value Traps: How to Evade Them and Focus on Value Cr...
[Whitepaper] Shareholder Value Traps: How to Evade Them and Focus on Value Cr...[Whitepaper] Shareholder Value Traps: How to Evade Them and Focus on Value Cr...
[Whitepaper] Shareholder Value Traps: How to Evade Them and Focus on Value Cr...
 

Último

Al Mizhar Dubai Escorts +971561403006 Escorts Service In Al Mizhar
Al Mizhar Dubai Escorts +971561403006 Escorts Service In Al MizharAl Mizhar Dubai Escorts +971561403006 Escorts Service In Al Mizhar
Al Mizhar Dubai Escorts +971561403006 Escorts Service In Al Mizhar
allensay1
 
Mckinsey foundation level Handbook for Viewing
Mckinsey foundation level Handbook for ViewingMckinsey foundation level Handbook for Viewing
Mckinsey foundation level Handbook for Viewing
Nauman Safdar
 
The Abortion pills for sale in Qatar@Doha [+27737758557] []Deira Dubai Kuwait
The Abortion pills for sale in Qatar@Doha [+27737758557] []Deira Dubai KuwaitThe Abortion pills for sale in Qatar@Doha [+27737758557] []Deira Dubai Kuwait
The Abortion pills for sale in Qatar@Doha [+27737758557] []Deira Dubai Kuwait
daisycvs
 
!~+971581248768>> SAFE AND ORIGINAL ABORTION PILLS FOR SALE IN DUBAI AND ABUD...
!~+971581248768>> SAFE AND ORIGINAL ABORTION PILLS FOR SALE IN DUBAI AND ABUD...!~+971581248768>> SAFE AND ORIGINAL ABORTION PILLS FOR SALE IN DUBAI AND ABUD...
!~+971581248768>> SAFE AND ORIGINAL ABORTION PILLS FOR SALE IN DUBAI AND ABUD...
DUBAI (+971)581248768 BUY ABORTION PILLS IN ABU dhabi...Qatar
 

Último (20)

New 2024 Cannabis Edibles Investor Pitch Deck Template
New 2024 Cannabis Edibles Investor Pitch Deck TemplateNew 2024 Cannabis Edibles Investor Pitch Deck Template
New 2024 Cannabis Edibles Investor Pitch Deck Template
 
Katrina Personal Brand Project and portfolio 1
Katrina Personal Brand Project and portfolio 1Katrina Personal Brand Project and portfolio 1
Katrina Personal Brand Project and portfolio 1
 
Falcon Invoice Discounting: The best investment platform in india for investors
Falcon Invoice Discounting: The best investment platform in india for investorsFalcon Invoice Discounting: The best investment platform in india for investors
Falcon Invoice Discounting: The best investment platform in india for investors
 
Phases of Negotiation .pptx
 Phases of Negotiation .pptx Phases of Negotiation .pptx
Phases of Negotiation .pptx
 
Escorts in Nungambakkam Phone 8250092165 Enjoy 24/7 Escort Service Enjoy Your...
Escorts in Nungambakkam Phone 8250092165 Enjoy 24/7 Escort Service Enjoy Your...Escorts in Nungambakkam Phone 8250092165 Enjoy 24/7 Escort Service Enjoy Your...
Escorts in Nungambakkam Phone 8250092165 Enjoy 24/7 Escort Service Enjoy Your...
 
Cannabis Legalization World Map: 2024 Updated
Cannabis Legalization World Map: 2024 UpdatedCannabis Legalization World Map: 2024 Updated
Cannabis Legalization World Map: 2024 Updated
 
Al Mizhar Dubai Escorts +971561403006 Escorts Service In Al Mizhar
Al Mizhar Dubai Escorts +971561403006 Escorts Service In Al MizharAl Mizhar Dubai Escorts +971561403006 Escorts Service In Al Mizhar
Al Mizhar Dubai Escorts +971561403006 Escorts Service In Al Mizhar
 
Lundin Gold - Q1 2024 Conference Call Presentation (Revised)
Lundin Gold - Q1 2024 Conference Call Presentation (Revised)Lundin Gold - Q1 2024 Conference Call Presentation (Revised)
Lundin Gold - Q1 2024 Conference Call Presentation (Revised)
 
Organizational Transformation Lead with Culture
Organizational Transformation Lead with CultureOrganizational Transformation Lead with Culture
Organizational Transformation Lead with Culture
 
Power point presentation on enterprise performance management
Power point presentation on enterprise performance managementPower point presentation on enterprise performance management
Power point presentation on enterprise performance management
 
Falcon's Invoice Discounting: Your Path to Prosperity
Falcon's Invoice Discounting: Your Path to ProsperityFalcon's Invoice Discounting: Your Path to Prosperity
Falcon's Invoice Discounting: Your Path to Prosperity
 
Mckinsey foundation level Handbook for Viewing
Mckinsey foundation level Handbook for ViewingMckinsey foundation level Handbook for Viewing
Mckinsey foundation level Handbook for Viewing
 
Putting the SPARK into Virtual Training.pptx
Putting the SPARK into Virtual Training.pptxPutting the SPARK into Virtual Training.pptx
Putting the SPARK into Virtual Training.pptx
 
Rice Manufacturers in India | Shree Krishna Exports
Rice Manufacturers in India | Shree Krishna ExportsRice Manufacturers in India | Shree Krishna Exports
Rice Manufacturers in India | Shree Krishna Exports
 
The Abortion pills for sale in Qatar@Doha [+27737758557] []Deira Dubai Kuwait
The Abortion pills for sale in Qatar@Doha [+27737758557] []Deira Dubai KuwaitThe Abortion pills for sale in Qatar@Doha [+27737758557] []Deira Dubai Kuwait
The Abortion pills for sale in Qatar@Doha [+27737758557] []Deira Dubai Kuwait
 
CROSS CULTURAL NEGOTIATION BY PANMISEM NS
CROSS CULTURAL NEGOTIATION BY PANMISEM NSCROSS CULTURAL NEGOTIATION BY PANMISEM NS
CROSS CULTURAL NEGOTIATION BY PANMISEM NS
 
Falcon Invoice Discounting: Tailored Financial Wings
Falcon Invoice Discounting: Tailored Financial WingsFalcon Invoice Discounting: Tailored Financial Wings
Falcon Invoice Discounting: Tailored Financial Wings
 
!~+971581248768>> SAFE AND ORIGINAL ABORTION PILLS FOR SALE IN DUBAI AND ABUD...
!~+971581248768>> SAFE AND ORIGINAL ABORTION PILLS FOR SALE IN DUBAI AND ABUD...!~+971581248768>> SAFE AND ORIGINAL ABORTION PILLS FOR SALE IN DUBAI AND ABUD...
!~+971581248768>> SAFE AND ORIGINAL ABORTION PILLS FOR SALE IN DUBAI AND ABUD...
 
SEO Case Study: How I Increased SEO Traffic & Ranking by 50-60% in 6 Months
SEO Case Study: How I Increased SEO Traffic & Ranking by 50-60%  in 6 MonthsSEO Case Study: How I Increased SEO Traffic & Ranking by 50-60%  in 6 Months
SEO Case Study: How I Increased SEO Traffic & Ranking by 50-60% in 6 Months
 
Falcon Invoice Discounting: Unlock Your Business Potential
Falcon Invoice Discounting: Unlock Your Business PotentialFalcon Invoice Discounting: Unlock Your Business Potential
Falcon Invoice Discounting: Unlock Your Business Potential
 

Sample LBO Model Template – 2

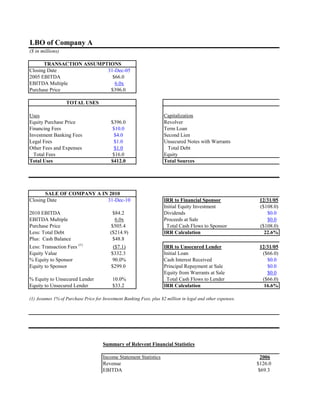
  • 1. LBO of Company A ($ in millions) TRANSACTION ASSUMPTIONS Closing Date 31-Dec-05 2005 EBITDA $66.0 EBITDA Multiple 6.0x Purchase Price $396.0 TOTAL USES TOTAL SOUR Uses Capitalization Equity Purchase Price $396.0 Revolver Financing Fees $10.0 Term Loan Investment Banking Fees $4.0 Second Lien Legal Fees $1.0 Unsecured Notes with Warrants Other Fees and Expenses $1.0 Total Debt Total Fees $16.0 Equity Total Uses $412.0 Total Sources SALE OF COMPANY A IN 2010 Closing Date 31-Dec-10 IRR to Financial Sponsor 12/31/05 Initial Equity Investment ($108.0) 2010 EBITDA $84.2 Dividends $0.0 EBITDA Multiple 6.0x Proceeds at Sale $0.0 Purchase Price $505.4 Total Cash Flows to Sponsor ($108.0) Less: Total Debt ($214.9) IRR Calculation 22.6% Plus: Cash Balance $48.8 Less: Transaction Fees (1) ($7.1) IRR to Unsecured Lender 12/31/05 Equity Value $332.3 Initial Loan ($66.0) % Equity to Sponsor 90.0% Cash Interest Received $0.0 Equity to Sponsor $299.0 Principal Repayment at Sale $0.0 Equity from Warrants at Sale $0.0 % Equity to Unsecured Lender 10.0% Total Cash Flows to Lender ($66.0) Equity to Unsecured Lender $33.2 IRR Calculation 16.6% (1) Assumes 1% of Purchase Price for Investment Banking Fees, plus $2 million in legal and other expenses. Summary of Relevent Financial Statistics Income Statement Statistics 2006 Revenue $126.0 EBITDA $69.3
  • 2. Net Income $24.2 Net Interest Expense $21.0 Cash Interest Expense $14.1 Taxes $16.1 Revenue Growth na EBITDA Margin 55% EBITDA Growth na Net Income Growth na Net Income Margin 17% Balance Sheet / Cash Flow Statistics Cash $0.0 Total Debt $280.2 Net Debt $280.2 Secured Debt $207.2 Capex $8.8 Increase (Decrease) in W/C ($0.6) Leverage Ratios Total Debt / EBITDA 4.0x Net Debt / EBITDA 4.0x Secured Debt / EBITDA 3.0x EBITDA / Net Interest Expense 3.3x EBITDA / Cash Interest Expense 4.9x Interest Coverage Statistics EBITDA / Net Interest Expense 3.3x EBITDA / Cash Interest 4.9x EBITDA - Capex / Net Interest Expense 2.9x EBITDA - Capex / Cash Interest Expense 4.3x EBITDA - Capex - ∆ W/C / Net Interest Expense 2.9x EBITDA - Capex - ∆ W/C / Cash Interest Expense 4.3x EBITDA - Capex - ∆ W/C - Taxes/ Net Interest Expense 2.1x EBITDA - Capex - ∆ W/C - Taxes/ Cash Interest Expense 3.2x
  • 3. TOTAL SOURCES Amount EBITDA % of Interest Rate % of Fully Funded Multiple Capitalization Cash Pay PIK Diluted Equity $7.0 0.1x 1.7% 5.0% 0.0% na $132.0 2.0x 32.0% 5.0% 0.0% na $99.0 1.5x 24.0% 8.0% 0.0% na $66.0 1.0x 16.0% 0.0% 10.0% 10% $304.0 4.6x 73.8% $108.0 1.6x 26.2% $412.0 6.2x 100.0% 12/31/06 12/31/07 12/31/08 12/31/09 12/31/10 $0.0 $0.0 $0.0 $0.0 $0.0 $0.0 $0.0 $0.0 $0.0 $0.0 $0.0 $0.0 $0.0 $0.0 $299.0 $0.0 $0.0 $0.0 $0.0 $299.0 12/31/06 12/31/07 12/31/08 12/31/09 12/31/10 $0.0 $0.0 $0.0 $0.0 $0.0 $0.0 $0.0 $0.0 $0.0 $0.0 $0.0 $0.0 $0.0 $0.0 $108.9 $0.0 $0.0 $0.0 $0.0 $33.2 $0.0 $0.0 $0.0 $0.0 $142.1 2007 2008 2009 2010 $132.3 $138.9 $145.9 $153.2 $72.8 $76.4 $80.2 $84.2
  • 4. $26.7 $29.2 $31.8 $34.6 $20.3 $19.6 $18.8 $18.0 $12.7 $11.4 $10.1 $8.9 $17.8 $19.4 $21.2 $23.0 5% 5% 5% 5% 55% 55% 55% 55% 5% 5% 5% 5% 10% 9% 9% 9% 15% 14% 13% 12% $6.6 $17.3 $31.3 $48.8 $261.6 $245.1 $229.5 $214.9 $255.1 $227.8 $198.2 $166.1 $181.0 $156.0 $131.0 $106.0 $9.3 $9.7 $10.2 $10.7 $0.4 $0.4 $0.4 $0.4 3.6x 3.2x 2.9x 2.6x 3.5x 3.0x 2.5x 2.0x 2.5x 2.0x 1.6x 1.3x 3.6x 3.9x 4.3x 4.7x 5.7x 6.7x 7.9x 9.5x 3.6x 3.9x 4.3x 4.7x 5.7x 6.7x 7.9x 9.5x 3.1x 3.4x 3.7x 4.1x 5.0x 5.9x 6.9x 8.3x 3.1x 3.4x 3.7x 4.1x 5.0x 5.8x 6.9x 8.2x 2.2x 2.4x 2.6x 2.8x 3.6x 4.1x 4.8x 5.6x
  • 5.
  • 6.
  • 7.
  • 8.
  • 9.
  • 10.
  • 11.
  • 12.
  • 13.
  • 14.
  • 15.
  • 16.
  • 17.
  • 18.
  • 19.
  • 20.
  • 21.
  • 22.
  • 23.
  • 24.
  • 25.
  • 26.
  • 27.
  • 28.
  • 29.
  • 30.
  • 31.
  • 32.
  • 33.
  • 34.
  • 35.
  • 36.
  • 37.
  • 38.
  • 39.
  • 40.
  • 41.
  • 42.
  • 43.
  • 44.
  • 45.
  • 46.
  • 47.
  • 48.
  • 49.
  • 50.
  • 51.
  • 52.
  • 53.
  • 54.
  • 55.
  • 56.
  • 57.
  • 58. #REF!
  • 59. Proforma Balance Sheet ($ in millions) Adjustments Proforma Proforma Balance Sheet Dec. 31 By the Seller Before New Adjustments Dec. 31 Assets 2005 Pre-Transaction Financing Financing Transaction 2005 Cash $76.9 ($76.9) $0.0 $0.0 $0.0 $0.0 Accounts Receivable $9.9 $0.0 $9.9 $0.0 $0.0 $9.9 Inventory $3.0 $0.0 $3.0 $0.0 $0.0 $3.0 Other Current Assets $1.0 $0.0 $1.0 $0.0 $0.0 $1.0 Total Current Assets $90.7 ($76.9) $13.9 $0.0 $0.0 $13.9 Gross PP&E $345.1 $0.0 $345.1 $0.0 $0.0 $345.1 Cumulative Depreciation $45.0 $0.0 $45.0 $0.0 $0.0 $45.0 Net PP&E $300.1 $0.0 $300.1 $0.0 $0.0 $300.1 Amortizable Intangibles $0.0 $0.0 $0.0 $0.0 $16.0 $16.0 Goodwill $5.0 $0.0 $5.0 $0.0 $84.7 $89.7 Total Assets $395.9 ($76.9) $319.0 $0.0 $100.7 $419.7 Liabilities Accounts Payable $3.3 $0.0 $3.3 $0.0 $0.0 $3.3 Accrued Liabilities $2.4 $0.0 $2.4 $0.0 $0.0 $2.4 Other Current Liabilities $0.0 $0.0 $0.0 $0.0 $0.0 $0.0 Total Current Liabilities $5.7 $0.0 $5.7 $0.0 $0.0 $5.7 Revolving Credit Facility $10.6 ($10.6) $0.0 $7.0 $0.0 $7.0 Term Loan $200.0 ($200.0) $0.0 $132.0 $0.0 $132.0 Second Lien $0.0 $0.0 $0.0 $99.0 $0.0 $99.0 Unsecured Debt $100.0 ($100.0) $0.0 $66.0 $0.0 $66.0 Other Liabilities $2.0 $0.0 $2.0 $0.0 $0.0 $2.0 Total Liabilities $318.3 ($310.6) $7.7 $304.0 $0.0 $311.7 Shareholders Equity Retainined Earnings $77.6 $0.0 $77.6 $0.0 ($77.6) $0.0 Other (Plug / Balance) $0.0 $233.8 $233.8 $0.0 ($125.8) $108.0 Total Shareholders Equity $77.6 $233.8 $311.3 $0.0 ($203.3) $108.0 Total Liabilities and Equity $395.9 ($76.9) $319.0 $304.0 ($203.3) $419.7 Check $0.0 $0.0 $0.0 $304.0 ($304.0) $0.0
  • 60. Goodwill Calculation Equity Purchase Price $396.0 – Book Value of Equity ($311.3) + Existing Goodwill $5.0 = Resulting Goodwill Balance $89.7 Intangibles Assets Intangible Assets $0.0 + Financing Fees $10.0 + M&A Fees $4.0 + Legal Fees $1.0 + Other Fees $1.0 = Resulting Intangibles Balance $16.0
  • 61. COMPANY A FINANCIAL MODEL HISTORICAL FINANCIAL STATEMENTS PROJECTED FINANCIAL STATEMENTS ($ in millions) Fiscal Year Ending December 31, Pro Forma Fiscal Year Ending December 31, 2001A 2002A 2003A 2004A 2005A 2005P 2006P 2007P 2008P 2009P 2010P Income Statement Revenue $100.0 $105.0 $110.0 $115.0 $120.0 $126.0 $132.3 $138.9 $145.9 $153.2 % Growth na 5.0% 4.8% 4.5% 4.3% 5.0% 5.0% 5.0% 5.0% 5.0% Cost of Goods Sold (1) $20.0 $21.0 $22.0 $23.0 $24.0 $25.2 $26.5 $27.8 $29.2 $30.6 COGS as % of Revenue 20.0% 20.0% 20.0% 20.0% 20.0% 20.0% 20.0% 20.0% 20.0% 20.0% Depreciation $5.0 $5.0 $5.0 $5.0 $5.0 $7.1 $7.3 $7.5 $7.7 $7.9 Amortization $0.0 $0.0 $0.0 $0.0 $0.0 $0.8 $0.8 $0.8 $0.8 $0.8 Gross Profit $75.0 $79.0 $83.0 $87.0 $91.0 $92.9 $97.8 $102.9 $108.2 $113.8 Gross Profit 75.0% 75.2% 75.5% 75.7% 75.8% 73.7% 73.9% 74.1% 74.2% 74.3% SG&A Expenses $25.0 $26.3 $27.5 $28.8 $30.0 $31.5 $33.1 $34.7 $36.5 $38.3 SG&A as % of Revenue 25.0% 25.0% 25.0% 25.0% 25.0% 25.0% 25.0% 25.0% 25.0% 25.0% Operating Income / EBIT $50.0 $52.8 $55.5 $58.3 $61.0 $61.4 $64.7 $68.1 $71.8 $75.6 Operating Income / EBIT Margin 50.0% 50.2% 50.5% 50.7% 50.8% 48.7% 48.9% 49.1% 49.2% 49.3% EBITDA $55.0 $57.8 $60.5 $63.3 $66.0 $69.3 $72.8 $76.4 $80.2 $84.2 EBITDA Margin 55.0% 55.0% 55.0% 55.0% 55.0% 55.0% 55.0% 55.0% 55.0% 55.0% EBITDA Growth na 5.0% 4.8% 4.5% 4.3% 5.0% 5.0% 5.0% 5.0% 5.0% Interest Expense $25.0 $24.5 $24.6 $24.6 $24.6 $21.0 $20.4 $19.9 $19.5 $19.3 Interest Income $0.2 $0.2 $0.5 $0.7 $1.0 $0.0 $0.1 $0.3 $0.7 $1.3 Net Interest Expense $24.8 $24.3 $24.1 $23.9 $23.6 $21.0 $20.3 $19.6 $18.8 $18.0 Other Income / (Expense) $2.0 $0.0 ($2.0) $1.0 $0.0 $0.0 $0.0 $0.0 $0.0 $0.0 Pretax Income $27.2 $28.4 $29.4 $35.4 $37.4 $40.4 $44.4 $48.6 $53.0 $57.6 Taxes $10.9 $11.4 $11.8 $14.2 $15.0 $16.1 $17.8 $19.4 $21.2 $23.0 Tax Rate 40.0% 40.0% 40.0% 40.0% 40.0% 40.0% 40.0% 40.0% 40.0% 40.0% Net Income $16.3 $17.1 $17.6 $21.2 $22.4 $24.2 $26.7 $29.2 $31.8 $34.6 Net Margin 16.3% 16.2% 16.0% 18.5% 18.7% 19.2% 20.1% 21.0% 21.8% 22.6% Net Income Growth na 4.5% 3.4% 20.4% 5.7% 8.0% 10.0% 9.4% 9.0% 8.7% (1) Excludes depreciation and amortization Page 61
  • 62. COMPANY A FINANCIAL MODEL HISTORICAL FINANCIAL STATEMENTS PROJECTED FINANCIAL STATEMENTS ($ in millions) Fiscal Year Ending December 31, Pro Forma Fiscal Year Ending December 31, 2001A 2002A 2003A 2004A 2005A 2005P 2006P 2007P 2008P 2009P 2010P Balance Sheet Assets Cash $5.0 $21.3 $39.9 $57.4 $76.9 $0.0 $0.0 $6.6 $17.3 $31.3 $48.8 Accounts Receivable $8.2 $8.6 $9.0 $9.5 $9.9 $9.9 $10.5 $11.0 $11.6 $12.2 $12.8 Inventory $2.5 $2.6 $2.8 $2.9 $3.0 $3.0 $3.2 $3.3 $3.5 $3.6 $3.8 Other Current Assets $1.0 $1.0 $1.0 $1.0 $1.0 $1.0 $1.0 $1.0 $1.0 $1.0 $1.0 Total Current Assets $16.7 $33.6 $52.6 $70.7 $90.7 $13.9 $14.7 $21.9 $33.4 $48.1 $66.4 ` Gross PP&E $318.9 $324.9 $329.9 $336.1 $345.1 $345.1 $353.9 $363.2 $372.9 $383.1 $393.9 Cumulative Depreciation $25.0 $30.0 $35.0 $40.0 $45.0 $45.0 $52.1 $59.3 $66.8 $74.5 $82.3 Net PP&E $293.9 $294.9 $294.9 $296.1 $300.1 $300.1 $301.9 $303.9 $306.1 $308.7 $311.5 Intangibles $16.0 $15.2 $14.4 $13.6 $12.8 $12.0 Goodwill $5.0 $5.0 $5.0 $5.0 $5.0 $89.7 $89.7 $89.7 $89.7 $89.7 $89.7 Total Assets $315.6 $333.5 $352.6 $371.9 $395.9 $419.7 $421.4 $429.8 $442.8 $459.3 $479.6 Liabilities Accounts Payable $2.8 $3.0 $2.9 $3.3 $3.3 $3.3 $3.5 $3.7 $3.9 $4.1 $4.3 Accrued Liabilities $2.0 $2.1 $2.2 $2.3 $2.4 $2.4 $2.5 $2.6 $2.8 $2.9 $3.1 Other Current Liabilities $1.0 $0.0 $2.0 $1.0 $0.0 $0.0 $1.0 $1.0 $1.0 $1.0 $1.0 Total Current Liabilities $5.8 $5.1 $7.1 $6.6 $5.7 $5.7 $7.0 $7.3 $7.6 $8.0 $8.3 Revolving Credit Facility $8.9 $9.3 $9.7 $10.2 $10.6 $7.0 $1.2 $0.0 $0.0 $0.0 $0.0 Term Loan $200.0 $200.0 $200.0 $200.0 $200.0 $132.0 $107.0 $82.0 $57.0 $32.0 $7.0 Second Lien Debt $99.0 $99.0 $99.0 $99.0 $99.0 $99.0 Unsecured Debt $100.0 $100.0 $100.0 $100.0 $100.0 $66.0 $72.9 $80.6 $89.1 $98.5 $108.9 Other Liabilities $1.0 $2.0 $1.0 $0.0 $2.0 $2.0 $2.0 $2.0 $2.0 $2.0 $2.0 Total Liabilities $315.6 $316.4 $317.9 $316.7 $318.3 $311.7 $289.2 $270.9 $254.8 $239.5 $225.2 $6.9 $7.7 $8.5 $9.4 $10.4 Shareholders Equity Retainined Earnings $0.0 $17.1 $34.7 $55.1 $77.6 $0.0 $24.2 $50.9 $80.0 $111.8 $146.4 Other (Plug / Balance) $0.0 $0.0 $0.0 $0.0 $0.0 $108.0 $108.0 $108.0 $108.0 $108.0 $108.0 Total Shareholders Equity $0.0 $17.1 $34.7 $55.1 $77.6 $108.0 $132.2 $158.9 $188.0 $219.8 $254.4 Total Liabilities and Equity $315.6 $333.5 $352.6 $371.9 $395.9 $419.7 $421.4 $429.8 $442.8 $459.3 $479.6 Check $0.0 $0.0 $0.0 $0.0 $0.0 $0.0 $0.0 $0.0 $0.0 $0.0 $0.0 Page 62
  • 63. COMPANY A FINANCIAL MODEL HISTORICAL FINANCIAL STATEMENTS PROJECTED FINANCIAL STATEMENTS ($ in millions) Fiscal Year Ending December 31, Pro Forma Fiscal Year Ending December 31, 2001A 2002A 2003A 2004A 2005A 2005P 2006P 2007P 2008P 2009P 2010P Cash Flow Net Income na $17.1 $17.6 $21.2 $22.4 $24.2 $26.7 $29.2 $31.8 $34.6 Plus / (minus): Depreciation and Amortization na $5 $5 $5 $5 $8 $8 $8 $8 $9 Changes in Working Capital Accounts Receivable na ($0.4) ($0.4) ($0.4) ($0.4) ($0.6) ($0.5) ($0.6) ($0.6) ($0.6) Inventory na ($0.1) ($0.1) ($0.1) ($0.1) ($0.2) ($0.2) ($0.2) ($0.2) ($0.2) Other Current Assets na $0.0 $0.0 $0.0 $0.0 $0.0 $0.0 $0.0 $0.0 $0.0 Accounts Payable na $0.3 ($0.1) $0.3 $0.0 $0.2 $0.2 $0.2 $0.2 $0.2 Accrued Liabilities na $0.1 $0.1 $0.1 $0.1 $0.1 $0.1 $0.1 $0.1 $0.1 Other Current Liabilities na ($1.0) $2.0 ($1.0) ($1.0) $1.0 $0.0 $0.0 $0.0 $0.0 Change in Other Liabilities na $1 ($1) ($1) $2 $0 $0 $0 $0 $0 Cash Flows from Operations na $21.9 $23.1 $24.1 $28.0 $32.7 $34.3 $37.0 $39.8 $42.8 Cash Flows from Investing Capital Expenditures na ($6.0) ($7.0) ($8.0) ($9.0) ($8.8) ($9.3) ($9.7) ($10.2) ($10.7) Asset Dispostions na $0.0 $2.0 $1.0 $0.0 $0.0 $0.0 $0.0 $0.0 $0.0 Cash Flows from Investing na ($6.0) ($5.0) ($7.0) ($9.0) ($8.8) ($9.3) ($9.7) ($10.2) ($10.7) Cash Flows from Financing Change in Revolver na $0.4 $0.4 $0.4 $0.4 ($5.8) ($1.2) $0.0 $0.0 $0.0 Change in Term Loan na $0.0 $0.0 $0.0 $0.0 ($25.0) ($25.0) ($25.0) ($25.0) ($25.0) Change in Second Lien $0.0 $0.0 $0.0 $0.0 $0.0 Change in Unsecured Debt na $0.0 $0.0 $0.0 $0.0 $6.9 $7.7 $8.5 $9.4 $10.4 Total Cash Flows from Financing na $0.4 $0.4 $0.4 $0.4 ($23.8) ($18.5) ($16.5) ($15.6) ($14.6) Total Cash Flow na $16.3 $18.5 $17.6 $19.5 $0.0 $6.6 $10.8 $14.0 $17.4 Beginning Cash Position na $5.0 $21.3 $39.9 $57.4 $0.0 $0.0 $6.6 $17.3 $31.3 Change in Cash Position na $16.3 $18.5 $17.6 $19.5 $0.0 $6.6 $10.8 $14.0 $17.4 Ending Cash Position na $21.3 $39.9 $57.4 $76.9 $0.0 $6.6 $17.3 $31.3 $48.8 Page 63
  • 64. COMPANY A FINANCIAL MODEL HISTORICAL FINANCIAL STATEMENTS PROJECTED FINANCIAL STATEMENTS ($ in millions) Fiscal Year Ending December 31, Pro Forma Fiscal Year Ending December 31, 2001A 2002A 2003A 2004A 2005A 2005P 2006P 2007P 2008P 2009P 2010P Cash flow before Revolver $5.8 $7.8 $17.3 $31.3 $48.8 Debt and Interest Schedule Revolver Beginning Revolver Balance $8.9 $9.3 $9.7 $10.2 $7.0 $1.2 $0.0 $0.0 $0.0 (Paydown) / Drawdown $0.4 $0.4 $0.4 $0.4 ($5.8) ($1.2) $0.0 $0.0 $0.0 Ending Revolver Balance $9.3 $9.7 $10.2 $10.6 $1.2 $0.0 $0.0 $0.0 $0.0 Interest Rate 6.0% 6.0% 6.0% 6.0% 5.00% 5.00% 5.00% 5.00% 5.00% Cash Pay Interest Expense $0.54 $0.57 $0.60 $0.62 $0.21 $0.03 $0.00 $0.00 $0.00 Term Loan Term Loan Beginning Balance $200.0 $200.0 $200.0 $200.0 $132.0 $107.0 $82.0 $57.0 $32.0 (Paydown) / Drawdown $0.0 $0.0 $0.0 $0.0 ($25.0) ($25.0) ($25.0) ($25.0) ($25.0) Term Loan Ending Balance $200.0 $200.0 $200.0 $200.0 $107.0 $82.0 $57.0 $32.0 $7.0 Interest Rate 6.00% 6.00% 6.00% 6.00% 5.00% 5.00% 5.00% 5.00% 5.00% Cash Pay Interest Expense $12.0 $12.0 $12.0 $12.0 $6.0 $4.7 $3.5 $2.2 $1.0 Second Lien Debt Second Lien Debt Beginning Balance $99.0 $99.0 $99.0 $99.0 $99.0 (Paydown) / Drawdown $0.0 $0.0 $0.0 $0.0 $0.0 Second Lien Debt Ending Balance $99.0 $99.0 $99.0 $99.0 $99.0 Cash Pay Interest Rate 8.00% 8.00% 8.00% 8.00% 8.00% Cash Pay Interest Expense $7.9 $7.9 $7.9 $7.9 $7.9 PIK Interest Rate 0% 0% 0% 0% 0% PIK Interest Expense $0.0 $0.0 $0.0 $0.0 $0.0 Unsecured Debt Unsecured Debt Beginning Balance $100.0 $100.0 $100.0 $100.0 $66.0 $72.9 $80.6 $89.1 $98.5 (Paydown) / Drawdown $0.0 $0.0 $0.0 $0.0 $0.0 $0.0 $0.0 $0.0 $0.0 Unsecured Debt Ending Balance $100.0 $100.0 $100.0 $100.0 $72.9 $80.6 $89.1 $98.5 $108.9 Cash Pay Interest Rate 12% 12% 12% 12% 0% 0% 0% 0% 0% Cash Pay Interest Expense $12.0 $12.0 $12.0 $12.0 $0.0 $0.0 $0.0 $0.0 $0.0 PIK Interest Rate 10% 10% 10% 10% 10% PIK Interest Expense $6.9 $7.7 $8.5 $9.4 $10.4 Total Interest Expense $24.5 $24.6 $24.6 $24.6 $21.0 $20.4 $19.9 $19.5 $19.3 Total Cash Pay Interest Rate Expense $14.1 $12.7 $11.4 $10.1 $8.9 Total PIK Interest Rate Expense $6.9 $7.7 $8.5 $9.4 $10.4 Interest Earned on Cash $0.2 $0.5 $0.7 $1.0 $0.0 $0.1 $0.3 $0.7 $1.3 Page 64
  • 65. COMPANY A FINANCIAL MODEL HISTORIC VARIABLES AND ASSUMPTIONS FOR PROJECTIONS HISTORICAL VARIABLES AND DRIVERS ASSUMPTIONS FOR PROJECTIONS Fiscal Year Ending December 31, Fiscal Year Ending December 31, 2001A 2002A 2003A 2004A 2005A 2006P 2007P 2008P 2009P 2010P Income Statement Drivers / Assumptions Revenue Growth Rate na 5.0% 4.8% 4.5% 4.3% 5.0% 5.0% 5.0% 5.0% 5.0% COGS as % of Revenue 20.0% 20.0% 20.0% 20.0% 20.0% 20.0% 20.0% 20.0% 20.0% 20.0% Depreciation as % of Gross PP&E 1.6% 1.5% 1.5% 1.5% 1.4% 2.0% 2.0% 2.0% 2.0% 2.0% Goodwill Amortization Intangible Amortization Per Year 20 Intangible Amortization $0.8 $0.8 $0.8 $0.8 $0.8 SG&A as % of Sales 25.0% 25.0% 25.0% 25.0% 25.0% 25.0% 25.0% 25.0% 25.0% 25.0% Other Income / (Expense) $2.0 $0.0 ($2.0) $1.0 $0.0 $0.0 $0.0 $0.0 $0.0 $0.0 Tax Rate 40.0% 40.0% 40.0% 40.0% 40.0% 40.0% 40.0% 40.0% 40.0% 40.0% Balance Sheet Drivers / Assumptions Days Accounts Receivable 30 30 30 30 30 30 30 30 30 30 Days Inventory 45 45 45 45 45 45 45 45 45 45 Other Current Assets $1.0 $1.0 $1.0 $1.0 $1.0 $1.0 $1.0 $1.0 $1.0 $1.0 Amortize Goodwill? (yes or no) $0.0 $0.0 $0.0 $0.0 $0.0 Capex as % of Sales na 5.7% 6.4% 7.0% 7.5% 7.0% 7.0% 7.0% 7.0% 7.0% Asset Disposition na $0.0 $2.0 $1.0 $0.0 $0.0 $0.0 $0.0 $0.0 $0.0 Days Payable 50 52 48 51 49 50 50 50 50 50 Accrued Liabilities as % of COGS 10.0% 10.0% 10.0% 10.0% 10.0% 10.0% 10.0% 10.0% 10.0% 10.0% Other Current Liabilities $1.0 $0.0 $2.0 $1.0 $0.0 $1.0 $1.0 $1.0 $1.0 $1.0 Other Liailities $1.0 $2.0 $1.0 $0.0 $2.0 $2.0 $2.0 $2.0 $2.0 $2.0 Interest Rates Revolver 2.0%+li 6.00% 6.00% 6.00% 6.00% 6.00% 5.00% 5.00% 5.00% 5.00% 5.00% Term Loan 2.0%+li 6.00% 6.00% 6.00% 6.00% 6.00% 5.00% 5.00% 5.00% 5.00% 5.00% Second Lien Debt (Cash) 8.00% 8.00% 8.00% 8.00% 8.00% Second Lien Debt (PIK) 0.00% 0.00% 0.00% 0.00% 0.00% Unsecured Debt (Cash) 12.0% 12.00% 12.00% 12.00% 12.00% 12.00% 0.00% 0.00% 0.00% 0.00% 0.00% Unsecured Debt (PIK) 10.00% 10.00% 10.00% 10.00% 10.00% LIBOR 4.00% 4.00% 4.00% 4.00% 4.00% 4.25% 4.50% 4.75% 5.00% 5.25% Interest earned on cash 2% 2.00% 2.00% 2.00% 2.00% 2.00% 2.25% 2.50% 2.75% 3.00% 3.25% Page 65
  • 66. COMPANY A FINANCIAL MODEL SENSITIVITIES ($ in millions) 2010 EBITDA FOR RANGE OF REVENUE GROWTH RATES AND COGS Annual Revenue Growth Rate $84.2 -20% -15% -10% -5% 0% 5% 10% 15% 20% 14% $24.0 $32.5 $43.2 $56.6 $73.2 $93.4 $117.9 $147.2 $182.1 16% $23.2 $31.4 $41.8 $54.8 $70.8 $90.4 $114.0 $142.4 $176.2 18% $22.4 $30.3 $40.4 $52.9 $68.4 $87.3 $110.2 $137.6 $170.2 20% $21.6 $29.3 $39.0 $51.1 $66.0 $84.2 $106.3 $132.7 $164.2 22% $20.8 $28.2 $37.6 $49.2 $63.6 $81.2 $102.4 $127.9 $158.3 24% $20.1 $27.2 $36.1 $47.4 $61.2 $78.1 $98.6 $123.1 $152.3 26% $19.3 $26.1 $34.7 $45.5 $58.8 $75.0 $94.7 $118.3 $146.3 Shading indicates base case scenario COGSas%of Sales Page 66