
Recomendados
Más contenido relacionado
Destacado
Más de football11
Último
Último (20)
International Investing made easy
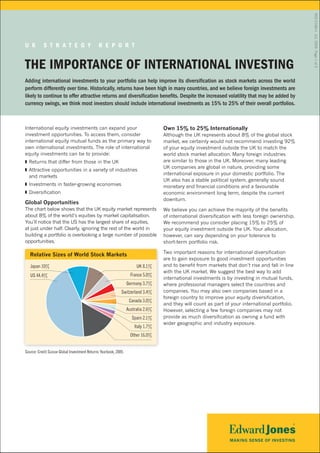
- 1. RES-5168-U JUL 2009 Page 1 of 3 U K S t r a t e g y r e p o r t tHe IMportaNCe oF INterNatIoNaL INVeStINg Adding international investments to your portfolio can help improve its diversification as stock markets across the world perform differently over time. Historically, returns have been high in many countries, and we believe foreign investments are likely to continue to offer attractive returns and diversification benefits. Despite the increased volatility that may be added by currency swings, we think most investors should include international investments as 15% to 25% of their overall portfolios. International equity investments can expand your Own 15% to 25% Internationally investment opportunities. To access them, consider Although the UK represents about 8% of the global stock international equity mutual funds as the primary way to market, we certainly would not recommend investing 92% own international investments. The role of international of your equity investment outside the UK to match the equity investments can be to provide: world stock market allocation. Many foreign industries ❚❚ Returns that differ from those in the UK are similar to those in the UK. Moreover, many leading UK companies are global in nature, providing some ❚❚ Attractive opportunities in a variety of industries international exposure in your domestic portfolio. The and markets UK also has a stable political system, generally sound ❚❚ Investments in faster-growing economies monetary and financial conditions and a favourable ❚❚ Diversification economic environment long term, despite the current downturn. Global Opportunities The chart below shows that the UK equity market represents We believe you can achieve the majority of the benefits about 8% of the world’s equities by market capitalisation. of international diversification with less foreign ownership. You’ll notice that the US has the largest share of equities, We recommend you consider placing 15% to 25% of at just under half. Clearly, ignoring the rest of the world in your equity investment outside the UK. Your allocation, building a portfolio is overlooking a large number of possible however, can vary depending on your tolerance to opportunities. short-term portfolio risk. Two important reasons for international diversification Relative Sizes of World Stock Markets are to gain exposure to good investment opportunities Japan 10% UK 8.1% and to benefit from markets that don’t rise and fall in line with the UK market. We suggest the best way to add US 44.4% France 5.0% international investments is by investing in mutual funds, Germany 3.7% where professional managers select the countries and Switzerland 3.4% companies. You may also own companies based in a foreign country to improve your equity diversification, Canada 3.0% and they will count as part of your international portfolio. Australia 2.6% However, selecting a few foreign companies may not Spain 2.1% provide as much diversification as owning a fund with wider geographic and industry exposure. Italy 1.7% Other 16.0% Source: Credit Suisse Global Investment Returns Yearbook, 2009.
- 2. RES-5168-U JUL 2009 Page 2 of 3 Attractive International Returns Historically, international stock market returns have been favourable. The average annual total return on UK shares since 1900 is 9.2%, whilst the average annual total return for US shares is 10.2% over the same period. As a result of the severe market declines in 2008, the average annual stock market returns during the past 10 years have been among the lowest since 1900 for many countries and regions. Reviewing the past 20 years, annual returns were better, although generally still below long-term averages. In most countries, decades when investors received low returns have been followed by decades of above-average returns, so don’t let the poor results during the past 10 years deter you from an appropriate decision. Average Annual Global Stock Market Returns YTD 10-year 15-year 20-year (January – (June 1999 – (June 1994 – (June 1989 – Market Index June 2009) 2008 June 2009) June 2009) June 2009) UK FTSE All-Share 0.8% -29.9% 0.1% 6.1% 7.3% US S&P 500 -9.9 -12.8 -2.7 6.5 7.4 Europe DJ Euro Stoxx 50 -11.0 -24.2 0.4 7.4 8.7 Foreign Developed Markets MSCI EAFE ex UK -6.9 -19.7 1.1 2.5 2.9 Foreign Less-developed Markets MSCI Emerging Markets 18.7 -35.4 8.2 N/A N/A Source: Morningstar Direct; all figures in pounds and include dividends reinvested. Past performance is not an indication of future results. Variation Provides Diversification many expected. However, there were still differences In most years there is a wide variation in the gains and in performance in 2008, as shown above, and many losses across the world’s stock markets, which is why international markets performed better than the UK stock international investments historically have contributed to market. Moreover, as no single stock market has portfolio diversification. These investments provide returns consistently performed among the top global markets, that differ from those in the UK. Owning international adding foreign investments may also add exposure to equity mutual funds that complement your domestic better-performing stock markets. investments is a way to help your portfolio vary less over The variability of stock markets from year to year is lost time and still provide good long-term returns. when looking at average annual gains and losses as Unfortunately, during recent sharp market declines, shown in the previous table. To convey the range of foreign stock markets often dropped in tandem with outcomes, the calendar year returns in each of the past domestic investments, providing less diversification than 10 years are shown in the following table: UK US Europe Foreign Developed Markets Foreign Less-developed Markets Year FTSE All-Share S&P 500 DJ Euro Stoxx 50 MSCI EAFE ex UK MSCI Emerging Markets 1999 24.2% 25.0% 31.4% 35.3% 71.9% 2000 -5.9 -1.9 -0.7 -8.3 -25.4 2001 -13.3 -9.6 -21.9 -21.5 0.0 2002 -22.7 -29.6 -31.5 -24.4 -15.2 2003 20.9 15.7 28.2 26.9 40.1 2004 12.8 3.4 9.9 12.3 17.1 2005 22.0 17.3 20.6 29.3 49.9 2006 16.8 1.6 15.8 9.7 15.9 2007 5.3 3.7 19.5 10.1 37.0 2008 -29.9 -12.8 -24.2 -19.7 -35.4 10-year Annualised Return 1.2 0.1 2.2 2.8 10.6 Source: Morningstar Direct; all figures in pounds and include dividends reinvested. Past performance is not an indication of future results. Foreign Investing Adds Currency Risks International equity mutual funds own shares in foreign companies. Whilst your investment is made in pounds, the value of that investment will be affected by changes in the exchange rate. The pound’s value compared to those of foreign currencies can either help or hurt returns on foreign investments. A rising value of the pound lowers the value of foreign investments, and a declining pound raises foreign investment returns. During most of the past decade, the pound was rising compared to many other currencies, which lowered foreign returns for UK investors. In contrast, most foreign investments were helped in 2008 due to the pound’s decline against most currencies, although many returns were still negative.
- 3. RES-5168-U JUL 2009 Page 3 of 3 How to Invest Internationally Attractive valuations — Valuations in many world equity If you wish to build an international equity portfolio markets appear attractive, making this a good opportunity yourself, you’ll have to choose the countries and the to consider adding international equities. The decline in companies and monitor them closely. You may already stock market prices has generally resulted in higher overall own some shares in international companies, which can dividend yields, despite well-known dividend reductions as help to diversify your equity portfolio appropriately. shown in the following chart. However, instead of trying to build the rest of your Price-to-earnings Ratio: Dividend Yield: international portfolio yourself, we believe it makes sense Name Current-year Est. Current-year Est. to add investments from many different parts of the world FTSE All-Share 12.5 4.4 selected by knowledgeable professionals who provide ongoing monitoring. In general, a global or international S&P 500 15.7 2.4 mutual fund will provide you with ownership in a wide DJ Euro Stoxx 50 10.4 4.7 selection of investments from a variety of countries. A MSCI EAFE ex UK 14.0* 3.6 diversified portfolio generally includes investments from the US, Europe and Asia as well as a small proportion MSCI Emerging 13.1* 2.7 from other equity markets. Markets Source: Bloomberg, 29 June 2009 Although many investors want to participate directly in the faster growth expected in emerging markets, it’s challenging *As of 29 May 2009 to pick the right countries and companies. More importantly, Why Diversify Internationally? whilst over the long term equity returns generally are tied Our recommendation to invest internationally isn’t based to the overall growth of the economy, rapid economic growth on short-term expectations about the performance of UK doesn’t always translate into high investment returns in the or foreign stock markets. We believe it’s nearly impossible short term. Instead of trying to make these choices yourself, to predict individual stock market returns consistently we believe owning a broad, well-diversified international over time or to anticipate changes in exchange rates or mutual fund where professional managers select when to specific foreign shares. Instead, it makes sense, in our invest in riskier markets and which ones to avoid. view, to select an appropriate target percentage to place Is Now a Good Time? in international investments that takes into consideration We believe there are several reasons in today’s environment your investmentgoals and tolerance for risk. to invest internationally, including: A combination of domestic and international investments Future economic growth — The International Monetary should improve the diversification of your portfolio, helping Fund (IMF) projects the world economy in 2009 will to give you appropriate returns whilst reducing the contract for the first time since World War II before variability of your investments. Over time, it’s important to recovering in 2010 through 2013. Economic growth tends rebalance your portfolio towards the target international to support investment returns, even though returns don’t percentage you’ve set. Remember, there are additional always mirror that growth from year to year.* In many risks associated with international investing, including countries, however, stock market rebounds have historically short-term currency movements and the higher volatility led economic rebounds by about six months, just as the of many foreign markets. We believe patience is important drop in stock markets tended to anticipate the recession. in international investing, just as it is domestically. Central bank and government support — Central banks Contact your financial adviser for a portfolio review around the world cut interest rates in 2008 and early to determine whether you could benefit by adding 2009, and some started to purchase bonds directly to international investments to your portfolio. keep long-term interest rates low and provide monetary stimulus. Massive fiscal stimulus packages in many *IMF World Economic Outlook, April 2009 countries are expected to boost economic growth as Diversification does not guarantee a profit or protect against loss. governments try to end recessions. Edward Jones Limited is authorised and regulated by the Financial Services Authority and is a member of the London Stock Exchange. Registered in England and Wales No. 3403976. 11 Westferry Circus, Canary Wharf, London, E14 4HH. © 2009. Kate Warne, ph.D., CFa Market Strategist www.edwardjones.com