
Recomendados
Recomendados
Más contenido relacionado
Similar a Infy forecast
Similar a Infy forecast (20)
Último
Último (20)
Infy forecast
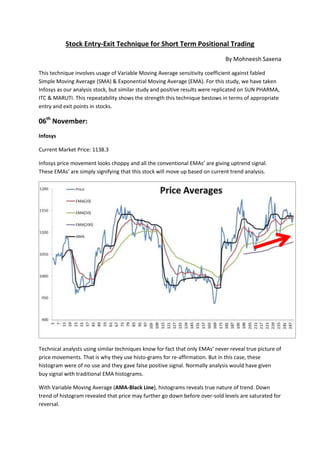
- 1. Stock Entry-Exit Technique for Short Term Positional Trading By Mohneesh Saxena This technique involves usage of Variable Moving Average sensitivity coefficient against fabled Simple Moving Average (SMA) & Exponential Moving Average (EMA). For this study, we have taken Infosys as our analysis stock, but similar study and positive results were replicated on SUN PHARMA, ITC & MARUTI. This repeatability shows the strength this technique bestows in terms of appropriate entry and exit points in stocks. 06th November: Infosys Current Market Price: 1138.3 Infosys price movement looks choppy and all the conventional EMAs’ are giving uptrend signal. These EMAs’ are simply signifying that this stock will move up based on current trend analysis. Technical analysts using similar techniques know for fact that only EMAs’ never reveal true picture of price movements. That is why they use histo-grams for re-affirmation. But in this case, these histogram were of no use and they gave false positive signal. Normally analysis would have given buy signal with traditional EMA histograms. With Variable Moving Average (AMA-Black Line), histograms reveals true nature of trend. Down trend of histogram revealed that price may further go down before over-sold levels are saturated for reversal.
- 2. On the basis of negative slope of Variable Moving Average Histogram, One can conclude that prices may fall some more, and hence the Call of DO NOT BUY raised on 6th November 2015 Traditional EMA Histogram Variable Moving Average Histogram
- 3. 27th November Infosys Current Market Price: 1066.35 Exponential Moving Averages are lagging indicators, due to which on 27th November they were giving SELL call when in fact, price reversal had taken place.(Evident from Variable Moving Average Histogram Positive Slope reversal – as given below) False Signal Again by Exponential Moving Average (Lagging Indicator)
- 4. Due to the Price action, Variable Moving Average Histogram has shown trend reversal giving way for BUY Call on 27th November 2015. Summary & Conclusion The above mentioned technique has saved us from taking a position in Infosys around INR 1138 on 6th November 2015. Same technique signalled us to enter Infosys and take long position around INR 1066 on 27th November 2015 and thus saving us 6% in potential profit yield. Coming Week will help us verify the veracity of this technique even more. Signs of Reversal are visible in Variable Moving Average Histogram