Social Sharing Report - Dark Social & WhatsApp on the rise
•
0 recomendaciones•346 vistas

Social sharing has changed and so have the methods people use. Twitter falls short of channels such as Dark Sharing & WhatsApp
Recomendados

Recomendados
Más contenido relacionado
Similar a Social Sharing Report - Dark Social & WhatsApp on the rise
Similar a Social Sharing Report - Dark Social & WhatsApp on the rise (20)
Más de João Romão
Más de João Romão (8)
Último
Último (17)
Social Sharing Report - Dark Social & WhatsApp on the rise
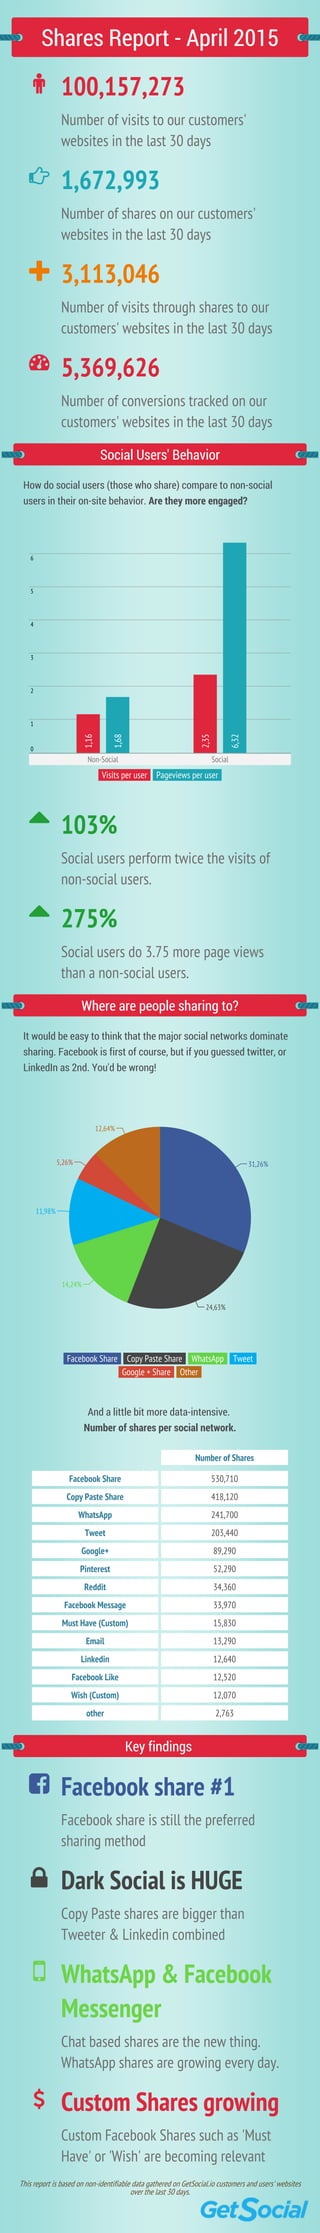
- 1. Shares Report - April 2015 100,157,273 Number of visits to our customers' websites in the last 30 days 1,672,993 Number of shares on our customers' websites in the last 30 days 3,113,046 Number of visits through shares to our customers' websites in the last 30 days 5,369,626 Number of conversions tracked on our customers' websites in the last 30 days Social Users' Behavior How do social users (those who share) compare to non-social users in their on-site behavior. Are they more engaged? Visits per user Pageviews per user 6 5 4 3 2 1 0 Non-Social Social 1,16 1,68 2,35 6,32 103% Social users perform twice the visits of non-social users. 275% Social users do 3.75 more page views than a non-social users. Where are people sharing to? It would be easy to think that the major social networks dominate sharing. Facebook is first of course, but if you guessed twitter, or LinkedIn as 2nd. You'd be wrong! Facebook Share Copy Paste Share WhatsApp Tweet Google + Share Other 31,26% 24,63% 14,24% 11,98% 5,26% 12,64% And a little bit more data-intensive. Number of shares per social network. Number of Shares Facebook Share 530,710 Copy Paste Share 418,120 WhatsApp 241,700 Tweet 203,440 Google+ 89,290 Pinterest 52,290 Reddit 34,360 Facebook Message 33,970 Must Have (Custom) 15,830 Email 13,290 Linkedin 12,640 Facebook Like 12,520 Wish (Custom) 12,070 other 2,763 Key findings Facebook share #1 Facebook share is still the preferred sharing method Dark Social is HUGE Copy Paste shares are bigger than Tweeter & Linkedin combined WhatsApp & Facebook Messenger Chat based shares are the new thing. WhatsApp shares are growing every day. Custom Shares growing Custom Facebook Shares such as 'Must Have' or 'Wish' are becoming relevant This report is based on non-identifiable data gathered on GetSocial.io customers and users' websites over the last 30 days.