SlideShare una empresa de Scribd logo
1 de 7
IMPACT OF ONE PIECE FLOW ON ECONOMIC DATA QUALITY
                         AND SHOP FLOOR DATA COLLECTION


               Azim Houshyar, Western Michigan University, Kalamazoo, Michigan
               Gordon Peters, Western Michigan University, Kalamazoo, Michigan


ABSTRACT

This article focuses on the basics of one-piece flow production as a market-oriented just-in-time
(JIT) production system that strives to fulfill the requirements of total quality management (TQM),
reduce product changeover time, increase productivity, reduce work-in-process inventory, and
eliminate all sources of waste. The article outlines the impact of implementing one-piece flow
manufacturing method on an organization’s manufacturing agility. Aside from any productivity
gains realized and financial gains associated from carrying the financial burden of excessive
inventory, organizations can benefit from the improved quality (credibility) of the economic data it
generates. These improvements are realized due to the reduction in total inventory primarily
through dramatic improvements in WIP (work in process inventory) levels. The process of data
collection from the shop floor represents an additional benefit of implementing a one-piece flow
production system. A reduction in data entry requirements for production reporting and inventory
tag system maintenance occurs once one-piece flow is implemented. Improvements in the quality
of data contained in monthly, quarterly and annual financial reports and reductions in labor hours
to maintain production and inventory control are very significant in today’s competitive and
dynamic manufacturing environment. This article will outline specific examples of how one-piece
flow contributes to improving the quality of economic data and improving the shop floor data
collection process.


1. INTRODUCTION

The capability of a manufacturing system to be flexible enough to respond to the changes in the
marketplace and customer’s needs is a crucial element of survival. One essential prerequisite to
such a capability is the ability to reduce the machine changeover time to zero, to be on-line with
the suppliers and users, and to have goods brought to the site on a daily basis and shipped
immediately. Another requirement for competing in a tight marketplace is to eliminate all sources
of waste. These changes are symbolized in a relatively new type of manufacturing system, known
as one-piece flow production system, in which the machinery are smaller-size general-purpose
machines that are lined up in a U-shape cell and are managed by only a few operators. The one-
piece flow (OPF) production system is a hybrid of the best of all the traditional production systems
that insists on waste reduction as the base for improvement (Ohno, 1988).

The literature is filled with articles on the advantages of a zero-defect production system
(Houshyar and White, 1996). They all endorse the same concept: build a thorough inspection
system into the production line, so that parts are conveyed, processed, and inspected one at a
time, and make sure that the human element of the production/inspection system is trained to
appreciate the significance of maintaining high standards of quality in his/her work-cell.

One-piece flow is accomplished by implementing a flow of material through production operation
one piece at a time without being placed in containers for transport to subsequent operations
(Sekine, 1992). The parts are optimally produced in “U” shaped cells by one operator. The
operator is responsible for checking his/her own work and assuring that the required quality level
is met prior to sending the part off for further processing, assembly or packaging and shipping.
The parts are transported to upstream operations via carts, conveyors or simply passed on a
table leading into an adjacent cell. Figure 1 illustrates a one-piece-flow layout in which there are
four cells, 12 production operations and a maximum of 16 parts in the system. In a one-piece flow
system product is pulled through the production operations as ordered by the customer. Parts are
not produced to maximize equipment utilization and as such they do not remain in the staging
areas waiting further processing or waiting to be sold.

By implementing one-piece-flow organizations realize dramatic reductions in work-in-process
inventory (Robinson, 1991). This reduction in inventory is realized due to:
    1) Parts are not being stored in containers (unit loads) at operations while they are being
        processed. Instead one piece at a time is processed in cells and ideally only one piece is
        in transit between operations.
    2) Parts are made as they are ordered. Batches or lots of parts are not staged between
        operations waiting to be scheduled and then to be processed.


                  FIGURE 1. AN ILLUSTRATION OF A ONE-PIECE FLOW LAYOUT.

Figure 2 depicts a typical production operation making four different parts, three production lines,
with each line performing the same operation. As the parts are processed, they are placed in
containers (in this case 50 per container are used as the unit load). Comparing the parts in
inventory in Figure 1, it is seen that there are 16 parts vs. the 1200 in Figure 2 (a reduction in WIP
to 16/1200 = 1.3%). This equates to a 98.7% reduction in the amount of inventory contained in
WIP. Any fluctuations in the value of WIP now become insignificant compared to the other more
stable inventory components namely finished goods and raw materials.


                    FIGURE 2. AN ILLUSTRATION OF A TRADITIONAL LAYOUT.
Reductions of total inventory, which is composed of raw material, WIP, and finished goods of ten
times or more are not uncommon when one-piece flow is implemented. In what follows, the
impact of this reduction in inventory on the quality of the economic data that an organization
generates will be examined.


2. DISCUSSION

In what follows the impact of the following main factors with an impact on the uncertainty of
inventory value will be briefly discussed.
    1) Scrap
    2) Raw material value adjustments
    3) Inventory adjustments: both point of operation value and quantity discrepancies
    4) Obsolescence, shrinkage and perishable costs.

Scrap: WIP value is an estimate that is mostly affected by the amount of scrap contained in it
waiting to be discovered as it is processed. WIP contains parts, components and subassemblies
that will be processed directly into finished goods, reworked, repaired and sent to finished goods
or they will be scrapped out. If the scrap rate is high for a given financial reporting period, then the
reduction in value associated with the WIP, directly reduces the bottom line financial performance
of the company. In addition with one-piece flow scrap rates are lower than typical batch
production methods as less inventory is between inspection points. This improves feedback and
correction cycle of process control. The timeline for detection and correction is shorter and thus
fewer parts are at risk of becoming scrap. Thus if the initial scrap rate is at a lower threshold and
fewer parts are at risk due to the lower inventory level, the total compound effect to uncertainty in
the value of inventory results in a much lower dollar value of uncertainty associated with the
existing WIP.

Figures 3-8 illustrate the relationship between uncertainty in inventory as a function of inventory
component value: Raw materials, WIP or finished goods. The distribution of this uncertainty is
also outlined. As the amount of WIP is reduced the total contribution that scrap makes in the level
of uncertainty will decrease. Once One-piece flow is implemented and optimized uncertainty in
inventory value is minimized as WIP is reduced together with raw material and finished goods
inventory.

                   Inventory value distribution and levels of uncertainty in a
                                   traditional batch system

                                   30 0


                                   25 0


                                   20 0


                                   15 0


                                   10 0


                                    50


                                     0
                                          Raw      WIP       Finished    Total

                     Inventory value      100      100         100        300
                     Uncertainty           1        10          1         12
                                                Inventory Component


  FIGURE 3. DISTRIBUTION OF INVENTORY AND ASSOCIATED UNCERTAINTY IN A TRADITIONAL
                                   BATCH SYSTEM.
Raw material valuation: Some products produced in manufacturing facilities have the value of the
raw material used in the products adjusted on a periodic basis to compensate for market value of
the raw material. If there is a lot of material value tied up in WIP inventory while the adjustment
takes place, then the effect can have a sizeable impact on financial performance. By minimizing
WIP (and thus total inventory                    value) by implementing OPF, this source of
variation of the total inventory Inventory value will be minimized.
                                      adjustments
                                          20%


                             Obsolesence,                               Scrap
                             Perishable or                              50%
                          Inventory shrinkage
                                 15%

                                 Raw Material Value
                                   adjustments
                                       15%


FIGURE 4. PROBABLE DISTRIBUTION OF UNCERTAINTY IN A TRADITIONAL BATCH PRODUCTION
                                     SYSTEM.

Inventory Adjustments: Inventory accuracy is always an issue of considerable importance in a
manufacturing facility. The value to place on a product at various points in the manufacturing
process is always a controversy as actual costs vary, yet the assigned value is typically held
constant over time. By using one-piece flow and U-shaped cells to process the part through
several manufacturing stages, fewer discrete value assignments need to be made. In addition
with fewer parts in inventory, any incorrect assumptions or outright errors associated with the
value of a part at any point in the process is minimized.


                  Inventory value components and levels of uncertainty in a one-
                                       piece flow system

                                    250


                                    200


                                    150


                                    100


                                     50


                                      0
                                           Raw          WIP      Finished       Total
                   Inventory Component     100           10        100          210
                   Uncertainty                  1        1          1            3
                                                      Inventory Component


  FIGURE 5. DISTRIBUTION OF INVENTORY AND ASSOCIATED UNCERTAINTY IN A ONE-PIECE-
                                   FLOW SYSTEM.
Inventory
                                    adjustments
                                        10%
                                                       Scrap
                              Obsolesence,             10%
                              Perishable or
                               Inventory
                               shrinkage
                                  15%

                                                            Raw Material
                                                               Value
                                                            adjustments
                                                                65%


  FIGURE 6: PROBABLE UNCERTAINTY DISTRIBUTION IN A ONE-PIECE PRODUCTION SYSTEM.

Inventory discrepancies found while trying to reconcile physical inventories are very time
consuming (as multiple recounts are typically required to verify the discrepancy) and they
represent significant variation in inventory values. If a discrepancy occurs in an organization that
has implemented one-piece flow, its impact on financial data will be much smaller than the impact
that an inventory discrepancy might have had on the organization had it used batch production
system.

                Inventory component and level of uncertanty in an optimized
                                 one-piece flow system


                                 12 0


                                 10 0


                                  80


                                  60


                                  40


                                  20


                                   0
                                         Raw                      Finished
                                                      WIP                    Total
                                        Materials                  goods

                Inventory Component        50           5           50       105
                Uncertainty               0.5          0.5          0.5      1.5

                                                    Inventory Com ponent


  FIGURE 7. DISTRIBUTION OF INVENTORY AND ASSOCIATED UNCERTAINTY IN AN OPTIMIZED
                               ONE-PIECE FLOW SYSTEM.
Inventory
                                   adjustments     Scrap
                                       10%          5%
                        Obsolesence,
                        Perishable or
                     Inventory shrinkage
                            10%


                                                           Raw Material Value
                                                             adjustments
                                                                 75%


   FIGURE 8. PROBABLE DISTRIBUTION OF UNCERTAINTY IN AN OPTIMIZED ONE PIECE-FLOW
                                      SYSTEM.

Obsolete or Perishable Inventor and Inventory shrinkage: Inventory adjustments caused from
parts becoming obsolete, perishing and shrinkage (theft, lost or damaged) are minimized when
one-piece flow is implemented. This is mainly due to the reduction in WIP produced for the
product ordered, and parts are made to order and not placed in inventory until sold. Additionally
the risk for parts perishing or becoming obsolete and reducing the value of inventory in a one-
piece flow environment is much lower when compared to a traditional batch production
environment.

Shop Floor Data Collection: Most manufacturing facilities use tags to identify what type and
number of parts are in the container, what processing has been completed, and what processing
remains to be done. Routing tags are always a nuisance. They need to be printed, filled out,
attached to the container, collected, stored, and eventually disposed of. Tagging errors are
always a concern during quality audits, as every manufacturing facility has experienced missing
tags and tagging errors. Compounding the tagging nuisance is the fact that plant personnel need
to be trained, and continually retrained on proper use of the tags. Production and inventory
control personnel are constantly looking for tags, correcting tagging errors and redesigning or
creating tags for new or improved products.

One-piece flow can be implemented without tags; the parts are usually fully completed within self-
contained cells. Tags become unnecessary except for finished goods, raw materials and
components, and non-conforming material/product. This dramatic reduction in tagging represents
a direct cost savings in terms of printed material (the tags), labor (filling out, creating, collecting
and auditing the tags), and disposal costs (land-fill).

Production reporting in a one-piece flow environment becomes a much simpler task when
compared to a batch production environment. In reference to Figure 1 where 12 machines are
divided into four cells each containing three operations, it is seen that the parts undergo all three
operations and the three machines essentially operate as one. Moreover, only one production
report per cell would be required. Contrast this to Figure 2, where those machines operate
independently in three lines for which 12 production reports would be required. This reduction will
lessen the impact that production-reporting errors can have. With less reports being generated,
operators will have the opportunity to be more accurate as they can focus on one report for the
cell vs. trying to maintain two or three reports for the three machines that they could be operating
in a batch production system. Since the data entry load is reduced, the number of data entry
errors should be minimized as more attention can be placed on fewer reports. Additionally
discrepancies should be easier to reconcile with the fewer production reports involved. The labor
savings observed through fewer transactions occurring links one-piece flow manufacturing
methods with “Lean Accounting” principles as well (Henderson and Larco, 2002 and Maskell,
2002).
3. SUMMARY

Aside from the immediate benefit that lower inventory has on cash flow we have outlined
additional benefits that can be realized by organizations implementing one-piece flow. With fewer
tagging errors and production reporting errors using one-piece flow, the quality of the production
data collected from the shop floor will translate into more credible financial data due to the lower
levels of uncertainty regarding the data. With lower levels of uncertainty in inventory value
resulting in lower WIP and total inventory levels, financial data will be of higher inherent quality.
Without the noise that a lower quality financial data can introduce to the measurement of financial
performance, improvements or declining performance can be identified as it is occurring. Finally,
the financial anomalies discussed regarding inventory value become less a factor in a one-piece
flow production system.


4. REFERENCES

1. Bruce Henderson and Jorge Larco, Lean Transformation: How to change your business into
   a lean enterprise, Oaklea Press, Richmond VA, First Edition, 2002.
2. Azim Houshyar and Bob White, Effectiveness of Japanese Transplants: One-Piece
   Production, 19th International Conference on Computer and Industrial Engineering, Miami,
   Florida, March 3-6, 1996.
3. Taiichi Ohno, Toyota Production System: Beyond Large-Scale Production, Productivity
   Press, Cambridge, 1988.
4. Alan Robinson, Continuous Improvement in Automation, Productivity Press, 1991.
5. Kenichi Sekine, One Piece Flow, Productivity Press, Cambridge, 1992.
6. Brian H. Maskell, President, BMA Inc. and Bruce Baggaley, Senior Partner. Lean
   Management Accounting, http://www.maskell.com/LAMPath4.htm, 2002.

Más contenido relacionado

La actualidad más candente

Kanban Basics
Kanban BasicsKanban Basics
Kanban Basicsjprokop1
 
production & material management
production & material managementproduction & material management
production & material managementBhaveshThakur11
 
Inventory control management
Inventory control managementInventory control management
Inventory control managementaroramahesh
 
Inventory management
Inventory managementInventory management
Inventory managementrajeev227
 
Inventory Control Final Ppt
Inventory Control Final PptInventory Control Final Ppt
Inventory Control Final Pptrajnikant
 
Investigation on Cycle Time Reduction in Production and Implementation of an ...
Investigation on Cycle Time Reduction in Production and Implementation of an ...Investigation on Cycle Time Reduction in Production and Implementation of an ...
Investigation on Cycle Time Reduction in Production and Implementation of an ...IRJET Journal
 
Inventory & store management m
Inventory & store management mInventory & store management m
Inventory & store management mMohit Mendiratta
 
PROCUREMENT & INVENTORY MANAGEMENT
PROCUREMENT & INVENTORY MANAGEMENTPROCUREMENT & INVENTORY MANAGEMENT
PROCUREMENT & INVENTORY MANAGEMENTZohaib Ansari
 
Inventory control
Inventory controlInventory control
Inventory controlswati joshi
 
Establishing control on consumables inventory in a pressure vessel manufactur...
Establishing control on consumables inventory in a pressure vessel manufactur...Establishing control on consumables inventory in a pressure vessel manufactur...
Establishing control on consumables inventory in a pressure vessel manufactur...eSAT Journals
 
Kanban Cards & Pull Systems
Kanban Cards & Pull SystemsKanban Cards & Pull Systems
Kanban Cards & Pull Systemswpegolo
 
Mro spare parts optimisation and inventory reduction uk 2017 11
Mro spare parts optimisation and inventory reduction uk 2017 11Mro spare parts optimisation and inventory reduction uk 2017 11
Mro spare parts optimisation and inventory reduction uk 2017 11David Thompson
 

La actualidad más candente (16)

Kanban Basics
Kanban BasicsKanban Basics
Kanban Basics
 
Material flow
Material flowMaterial flow
Material flow
 
Scrap waste spoilage in costing
Scrap waste spoilage in costingScrap waste spoilage in costing
Scrap waste spoilage in costing
 
production & material management
production & material managementproduction & material management
production & material management
 
Inventory control management
Inventory control managementInventory control management
Inventory control management
 
Inventory management
Inventory managementInventory management
Inventory management
 
Inventory Control Final Ppt
Inventory Control Final PptInventory Control Final Ppt
Inventory Control Final Ppt
 
Investigation on Cycle Time Reduction in Production and Implementation of an ...
Investigation on Cycle Time Reduction in Production and Implementation of an ...Investigation on Cycle Time Reduction in Production and Implementation of an ...
Investigation on Cycle Time Reduction in Production and Implementation of an ...
 
Inventory & store management m
Inventory & store management mInventory & store management m
Inventory & store management m
 
PROCUREMENT & INVENTORY MANAGEMENT
PROCUREMENT & INVENTORY MANAGEMENTPROCUREMENT & INVENTORY MANAGEMENT
PROCUREMENT & INVENTORY MANAGEMENT
 
Inventory control
Inventory controlInventory control
Inventory control
 
Establishing control on consumables inventory in a pressure vessel manufactur...
Establishing control on consumables inventory in a pressure vessel manufactur...Establishing control on consumables inventory in a pressure vessel manufactur...
Establishing control on consumables inventory in a pressure vessel manufactur...
 
Kanban Cards & Pull Systems
Kanban Cards & Pull SystemsKanban Cards & Pull Systems
Kanban Cards & Pull Systems
 
Inventory Control
Inventory ControlInventory Control
Inventory Control
 
Inventory control
Inventory control Inventory control
Inventory control
 
Mro spare parts optimisation and inventory reduction uk 2017 11
Mro spare parts optimisation and inventory reduction uk 2017 11Mro spare parts optimisation and inventory reduction uk 2017 11
Mro spare parts optimisation and inventory reduction uk 2017 11
 

Destacado (17)

Larry Prentice Photography
Larry Prentice PhotographyLarry Prentice Photography
Larry Prentice Photography
 
NSPE 75th Anniversary
NSPE 75th AnniversaryNSPE 75th Anniversary
NSPE 75th Anniversary
 
Master SBS V - Abstract Brochure
Master SBS V - Abstract BrochureMaster SBS V - Abstract Brochure
Master SBS V - Abstract Brochure
 
Master SBS IX EDIZIONE
Master SBS IX EDIZIONEMaster SBS IX EDIZIONE
Master SBS IX EDIZIONE
 
Fedora day-activities-using-flatpaks-1
Fedora day-activities-using-flatpaks-1Fedora day-activities-using-flatpaks-1
Fedora day-activities-using-flatpaks-1
 
Master SBS - X Edizione
Master SBS - X EdizioneMaster SBS - X Edizione
Master SBS - X Edizione
 
Mindstorms 1999 Strategy
Mindstorms 1999 StrategyMindstorms 1999 Strategy
Mindstorms 1999 Strategy
 
Apache Performance Tuning
Apache Performance TuningApache Performance Tuning
Apache Performance Tuning
 
MIHAN_PRESENTATION_1
MIHAN_PRESENTATION_1MIHAN_PRESENTATION_1
MIHAN_PRESENTATION_1
 
Introduction GStreamer
Introduction GStreamerIntroduction GStreamer
Introduction GStreamer
 
Debian Policy - 5.6.12 Version
Debian Policy - 5.6.12 VersionDebian Policy - 5.6.12 Version
Debian Policy - 5.6.12 Version
 
Ubuntu BoF
Ubuntu BoFUbuntu BoF
Ubuntu BoF
 
Presentazione Master Sbs V Edizione
Presentazione Master Sbs V EdizionePresentazione Master Sbs V Edizione
Presentazione Master Sbs V Edizione
 
Italian Way
Italian WayItalian Way
Italian Way
 
tfwtf
tfwtftfwtf
tfwtf
 
Brochure Istituzionale Italian Way
Brochure Istituzionale Italian WayBrochure Istituzionale Italian Way
Brochure Istituzionale Italian Way
 
Brochure Master SBS - VII edizione
Brochure Master SBS - VII edizioneBrochure Master SBS - VII edizione
Brochure Master SBS - VII edizione
 

Similar a Houshyar Peters Final

Chapter 9 study guide
Chapter 9 study guideChapter 9 study guide
Chapter 9 study guidemspidel
 
How and why demand driven replenishment works and forecast push does not
How and why demand driven replenishment works and forecast push does notHow and why demand driven replenishment works and forecast push does not
How and why demand driven replenishment works and forecast push does notUtkan Uluçay, MSc., CDDP
 
Inventory Management At Telcon
Inventory Management At TelconInventory Management At Telcon
Inventory Management At TelconRitesh choudhary
 
Vipulesh inventory management
Vipulesh inventory managementVipulesh inventory management
Vipulesh inventory managementVipulesh Shardeo
 
Activity-Based Costing (ABC
Activity-Based Costing (ABCActivity-Based Costing (ABC
Activity-Based Costing (ABCAngie Miller
 
Management AccountingActivity Based Costing vs Absorption Cost.docx
Management AccountingActivity Based Costing vs Absorption Cost.docxManagement AccountingActivity Based Costing vs Absorption Cost.docx
Management AccountingActivity Based Costing vs Absorption Cost.docxinfantsuk
 
“Optimization of Inventory regarding Power Tiller”
“Optimization of Inventory regarding Power Tiller”“Optimization of Inventory regarding Power Tiller”
“Optimization of Inventory regarding Power Tiller”IRJET Journal
 
Biomanufacturing flexibility
Biomanufacturing flexibilityBiomanufacturing flexibility
Biomanufacturing flexibilityGBX Summits
 
Just in time and lean thinking
Just in time and lean thinkingJust in time and lean thinking
Just in time and lean thinkingPrashant Sharma
 
Hansen aise im ch06
Hansen aise im ch06Hansen aise im ch06
Hansen aise im ch06Daeng Aiman
 
Biomanufacturing debottlenecking and optimization
Biomanufacturing debottlenecking and optimizationBiomanufacturing debottlenecking and optimization
Biomanufacturing debottlenecking and optimizationGBX Summits
 
Production & Operation Management Chapter10[1]
Production & Operation Management Chapter10[1]Production & Operation Management Chapter10[1]
Production & Operation Management Chapter10[1]Hariharan Ponnusamy
 
Akuntansi Manajemen Edisi 8 oleh Hansen & Mowen Bab 6
Akuntansi Manajemen Edisi 8 oleh Hansen & Mowen Bab 6Akuntansi Manajemen Edisi 8 oleh Hansen & Mowen Bab 6
Akuntansi Manajemen Edisi 8 oleh Hansen & Mowen Bab 6Dwi Wahyu
 
Material Management
Material ManagementMaterial Management
Material ManagementNishit Mehta
 

Similar a Houshyar Peters Final (20)

Ch_4.pdf
Ch_4.pdfCh_4.pdf
Ch_4.pdf
 
Chapter 9 study guide
Chapter 9 study guideChapter 9 study guide
Chapter 9 study guide
 
Inventrycontrol
InventrycontrolInventrycontrol
Inventrycontrol
 
How and why demand driven replenishment works and forecast push does not
How and why demand driven replenishment works and forecast push does notHow and why demand driven replenishment works and forecast push does not
How and why demand driven replenishment works and forecast push does not
 
Line balancing
Line balancingLine balancing
Line balancing
 
Inventory Management At Telcon
Inventory Management At TelconInventory Management At Telcon
Inventory Management At Telcon
 
Vipulesh inventory management
Vipulesh inventory managementVipulesh inventory management
Vipulesh inventory management
 
Activity-Based Costing (ABC
Activity-Based Costing (ABCActivity-Based Costing (ABC
Activity-Based Costing (ABC
 
Management AccountingActivity Based Costing vs Absorption Cost.docx
Management AccountingActivity Based Costing vs Absorption Cost.docxManagement AccountingActivity Based Costing vs Absorption Cost.docx
Management AccountingActivity Based Costing vs Absorption Cost.docx
 
Activity-based costing A Case study
Activity-based costing A Case studyActivity-based costing A Case study
Activity-based costing A Case study
 
“Optimization of Inventory regarding Power Tiller”
“Optimization of Inventory regarding Power Tiller”“Optimization of Inventory regarding Power Tiller”
“Optimization of Inventory regarding Power Tiller”
 
Biomanufacturing flexibility
Biomanufacturing flexibilityBiomanufacturing flexibility
Biomanufacturing flexibility
 
Just in time and lean thinking
Just in time and lean thinkingJust in time and lean thinking
Just in time and lean thinking
 
Hansen aise im ch06
Hansen aise im ch06Hansen aise im ch06
Hansen aise im ch06
 
Biomanufacturing debottlenecking and optimization
Biomanufacturing debottlenecking and optimizationBiomanufacturing debottlenecking and optimization
Biomanufacturing debottlenecking and optimization
 
Production & Operation Management Chapter10[1]
Production & Operation Management Chapter10[1]Production & Operation Management Chapter10[1]
Production & Operation Management Chapter10[1]
 
Chapter10[1]
Chapter10[1]Chapter10[1]
Chapter10[1]
 
Akuntansi Manajemen Edisi 8 oleh Hansen & Mowen Bab 6
Akuntansi Manajemen Edisi 8 oleh Hansen & Mowen Bab 6Akuntansi Manajemen Edisi 8 oleh Hansen & Mowen Bab 6
Akuntansi Manajemen Edisi 8 oleh Hansen & Mowen Bab 6
 
Ep 08
Ep 08Ep 08
Ep 08
 
Material Management
Material ManagementMaterial Management
Material Management
 

Houshyar Peters Final

  • 1. IMPACT OF ONE PIECE FLOW ON ECONOMIC DATA QUALITY AND SHOP FLOOR DATA COLLECTION Azim Houshyar, Western Michigan University, Kalamazoo, Michigan Gordon Peters, Western Michigan University, Kalamazoo, Michigan ABSTRACT This article focuses on the basics of one-piece flow production as a market-oriented just-in-time (JIT) production system that strives to fulfill the requirements of total quality management (TQM), reduce product changeover time, increase productivity, reduce work-in-process inventory, and eliminate all sources of waste. The article outlines the impact of implementing one-piece flow manufacturing method on an organization’s manufacturing agility. Aside from any productivity gains realized and financial gains associated from carrying the financial burden of excessive inventory, organizations can benefit from the improved quality (credibility) of the economic data it generates. These improvements are realized due to the reduction in total inventory primarily through dramatic improvements in WIP (work in process inventory) levels. The process of data collection from the shop floor represents an additional benefit of implementing a one-piece flow production system. A reduction in data entry requirements for production reporting and inventory tag system maintenance occurs once one-piece flow is implemented. Improvements in the quality of data contained in monthly, quarterly and annual financial reports and reductions in labor hours to maintain production and inventory control are very significant in today’s competitive and dynamic manufacturing environment. This article will outline specific examples of how one-piece flow contributes to improving the quality of economic data and improving the shop floor data collection process. 1. INTRODUCTION The capability of a manufacturing system to be flexible enough to respond to the changes in the marketplace and customer’s needs is a crucial element of survival. One essential prerequisite to such a capability is the ability to reduce the machine changeover time to zero, to be on-line with the suppliers and users, and to have goods brought to the site on a daily basis and shipped immediately. Another requirement for competing in a tight marketplace is to eliminate all sources of waste. These changes are symbolized in a relatively new type of manufacturing system, known as one-piece flow production system, in which the machinery are smaller-size general-purpose machines that are lined up in a U-shape cell and are managed by only a few operators. The one- piece flow (OPF) production system is a hybrid of the best of all the traditional production systems that insists on waste reduction as the base for improvement (Ohno, 1988). The literature is filled with articles on the advantages of a zero-defect production system (Houshyar and White, 1996). They all endorse the same concept: build a thorough inspection system into the production line, so that parts are conveyed, processed, and inspected one at a time, and make sure that the human element of the production/inspection system is trained to appreciate the significance of maintaining high standards of quality in his/her work-cell. One-piece flow is accomplished by implementing a flow of material through production operation one piece at a time without being placed in containers for transport to subsequent operations (Sekine, 1992). The parts are optimally produced in “U” shaped cells by one operator. The operator is responsible for checking his/her own work and assuring that the required quality level is met prior to sending the part off for further processing, assembly or packaging and shipping. The parts are transported to upstream operations via carts, conveyors or simply passed on a
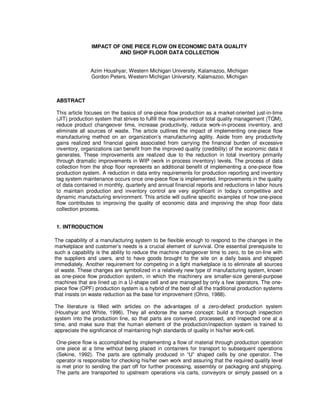
  • 2. table leading into an adjacent cell. Figure 1 illustrates a one-piece-flow layout in which there are four cells, 12 production operations and a maximum of 16 parts in the system. In a one-piece flow system product is pulled through the production operations as ordered by the customer. Parts are not produced to maximize equipment utilization and as such they do not remain in the staging areas waiting further processing or waiting to be sold. By implementing one-piece-flow organizations realize dramatic reductions in work-in-process inventory (Robinson, 1991). This reduction in inventory is realized due to: 1) Parts are not being stored in containers (unit loads) at operations while they are being processed. Instead one piece at a time is processed in cells and ideally only one piece is in transit between operations. 2) Parts are made as they are ordered. Batches or lots of parts are not staged between operations waiting to be scheduled and then to be processed. FIGURE 1. AN ILLUSTRATION OF A ONE-PIECE FLOW LAYOUT. Figure 2 depicts a typical production operation making four different parts, three production lines, with each line performing the same operation. As the parts are processed, they are placed in containers (in this case 50 per container are used as the unit load). Comparing the parts in inventory in Figure 1, it is seen that there are 16 parts vs. the 1200 in Figure 2 (a reduction in WIP to 16/1200 = 1.3%). This equates to a 98.7% reduction in the amount of inventory contained in WIP. Any fluctuations in the value of WIP now become insignificant compared to the other more stable inventory components namely finished goods and raw materials. FIGURE 2. AN ILLUSTRATION OF A TRADITIONAL LAYOUT.
  • 3. Reductions of total inventory, which is composed of raw material, WIP, and finished goods of ten times or more are not uncommon when one-piece flow is implemented. In what follows, the impact of this reduction in inventory on the quality of the economic data that an organization generates will be examined. 2. DISCUSSION In what follows the impact of the following main factors with an impact on the uncertainty of inventory value will be briefly discussed. 1) Scrap 2) Raw material value adjustments 3) Inventory adjustments: both point of operation value and quantity discrepancies 4) Obsolescence, shrinkage and perishable costs. Scrap: WIP value is an estimate that is mostly affected by the amount of scrap contained in it waiting to be discovered as it is processed. WIP contains parts, components and subassemblies that will be processed directly into finished goods, reworked, repaired and sent to finished goods or they will be scrapped out. If the scrap rate is high for a given financial reporting period, then the reduction in value associated with the WIP, directly reduces the bottom line financial performance of the company. In addition with one-piece flow scrap rates are lower than typical batch production methods as less inventory is between inspection points. This improves feedback and correction cycle of process control. The timeline for detection and correction is shorter and thus fewer parts are at risk of becoming scrap. Thus if the initial scrap rate is at a lower threshold and fewer parts are at risk due to the lower inventory level, the total compound effect to uncertainty in the value of inventory results in a much lower dollar value of uncertainty associated with the existing WIP. Figures 3-8 illustrate the relationship between uncertainty in inventory as a function of inventory component value: Raw materials, WIP or finished goods. The distribution of this uncertainty is also outlined. As the amount of WIP is reduced the total contribution that scrap makes in the level of uncertainty will decrease. Once One-piece flow is implemented and optimized uncertainty in inventory value is minimized as WIP is reduced together with raw material and finished goods inventory. Inventory value distribution and levels of uncertainty in a traditional batch system 30 0 25 0 20 0 15 0 10 0 50 0 Raw WIP Finished Total Inventory value 100 100 100 300 Uncertainty 1 10 1 12 Inventory Component FIGURE 3. DISTRIBUTION OF INVENTORY AND ASSOCIATED UNCERTAINTY IN A TRADITIONAL BATCH SYSTEM.
  • 4. Raw material valuation: Some products produced in manufacturing facilities have the value of the raw material used in the products adjusted on a periodic basis to compensate for market value of the raw material. If there is a lot of material value tied up in WIP inventory while the adjustment takes place, then the effect can have a sizeable impact on financial performance. By minimizing WIP (and thus total inventory value) by implementing OPF, this source of variation of the total inventory Inventory value will be minimized. adjustments 20% Obsolesence, Scrap Perishable or 50% Inventory shrinkage 15% Raw Material Value adjustments 15% FIGURE 4. PROBABLE DISTRIBUTION OF UNCERTAINTY IN A TRADITIONAL BATCH PRODUCTION SYSTEM. Inventory Adjustments: Inventory accuracy is always an issue of considerable importance in a manufacturing facility. The value to place on a product at various points in the manufacturing process is always a controversy as actual costs vary, yet the assigned value is typically held constant over time. By using one-piece flow and U-shaped cells to process the part through several manufacturing stages, fewer discrete value assignments need to be made. In addition with fewer parts in inventory, any incorrect assumptions or outright errors associated with the value of a part at any point in the process is minimized. Inventory value components and levels of uncertainty in a one- piece flow system 250 200 150 100 50 0 Raw WIP Finished Total Inventory Component 100 10 100 210 Uncertainty 1 1 1 3 Inventory Component FIGURE 5. DISTRIBUTION OF INVENTORY AND ASSOCIATED UNCERTAINTY IN A ONE-PIECE- FLOW SYSTEM.
  • 5. Inventory adjustments 10% Scrap Obsolesence, 10% Perishable or Inventory shrinkage 15% Raw Material Value adjustments 65% FIGURE 6: PROBABLE UNCERTAINTY DISTRIBUTION IN A ONE-PIECE PRODUCTION SYSTEM. Inventory discrepancies found while trying to reconcile physical inventories are very time consuming (as multiple recounts are typically required to verify the discrepancy) and they represent significant variation in inventory values. If a discrepancy occurs in an organization that has implemented one-piece flow, its impact on financial data will be much smaller than the impact that an inventory discrepancy might have had on the organization had it used batch production system. Inventory component and level of uncertanty in an optimized one-piece flow system 12 0 10 0 80 60 40 20 0 Raw Finished WIP Total Materials goods Inventory Component 50 5 50 105 Uncertainty 0.5 0.5 0.5 1.5 Inventory Com ponent FIGURE 7. DISTRIBUTION OF INVENTORY AND ASSOCIATED UNCERTAINTY IN AN OPTIMIZED ONE-PIECE FLOW SYSTEM.
  • 6. Inventory adjustments Scrap 10% 5% Obsolesence, Perishable or Inventory shrinkage 10% Raw Material Value adjustments 75% FIGURE 8. PROBABLE DISTRIBUTION OF UNCERTAINTY IN AN OPTIMIZED ONE PIECE-FLOW SYSTEM. Obsolete or Perishable Inventor and Inventory shrinkage: Inventory adjustments caused from parts becoming obsolete, perishing and shrinkage (theft, lost or damaged) are minimized when one-piece flow is implemented. This is mainly due to the reduction in WIP produced for the product ordered, and parts are made to order and not placed in inventory until sold. Additionally the risk for parts perishing or becoming obsolete and reducing the value of inventory in a one- piece flow environment is much lower when compared to a traditional batch production environment. Shop Floor Data Collection: Most manufacturing facilities use tags to identify what type and number of parts are in the container, what processing has been completed, and what processing remains to be done. Routing tags are always a nuisance. They need to be printed, filled out, attached to the container, collected, stored, and eventually disposed of. Tagging errors are always a concern during quality audits, as every manufacturing facility has experienced missing tags and tagging errors. Compounding the tagging nuisance is the fact that plant personnel need to be trained, and continually retrained on proper use of the tags. Production and inventory control personnel are constantly looking for tags, correcting tagging errors and redesigning or creating tags for new or improved products. One-piece flow can be implemented without tags; the parts are usually fully completed within self- contained cells. Tags become unnecessary except for finished goods, raw materials and components, and non-conforming material/product. This dramatic reduction in tagging represents a direct cost savings in terms of printed material (the tags), labor (filling out, creating, collecting and auditing the tags), and disposal costs (land-fill). Production reporting in a one-piece flow environment becomes a much simpler task when compared to a batch production environment. In reference to Figure 1 where 12 machines are divided into four cells each containing three operations, it is seen that the parts undergo all three operations and the three machines essentially operate as one. Moreover, only one production report per cell would be required. Contrast this to Figure 2, where those machines operate independently in three lines for which 12 production reports would be required. This reduction will lessen the impact that production-reporting errors can have. With less reports being generated, operators will have the opportunity to be more accurate as they can focus on one report for the cell vs. trying to maintain two or three reports for the three machines that they could be operating in a batch production system. Since the data entry load is reduced, the number of data entry errors should be minimized as more attention can be placed on fewer reports. Additionally discrepancies should be easier to reconcile with the fewer production reports involved. The labor savings observed through fewer transactions occurring links one-piece flow manufacturing methods with “Lean Accounting” principles as well (Henderson and Larco, 2002 and Maskell, 2002).
  • 7. 3. SUMMARY Aside from the immediate benefit that lower inventory has on cash flow we have outlined additional benefits that can be realized by organizations implementing one-piece flow. With fewer tagging errors and production reporting errors using one-piece flow, the quality of the production data collected from the shop floor will translate into more credible financial data due to the lower levels of uncertainty regarding the data. With lower levels of uncertainty in inventory value resulting in lower WIP and total inventory levels, financial data will be of higher inherent quality. Without the noise that a lower quality financial data can introduce to the measurement of financial performance, improvements or declining performance can be identified as it is occurring. Finally, the financial anomalies discussed regarding inventory value become less a factor in a one-piece flow production system. 4. REFERENCES 1. Bruce Henderson and Jorge Larco, Lean Transformation: How to change your business into a lean enterprise, Oaklea Press, Richmond VA, First Edition, 2002. 2. Azim Houshyar and Bob White, Effectiveness of Japanese Transplants: One-Piece Production, 19th International Conference on Computer and Industrial Engineering, Miami, Florida, March 3-6, 1996. 3. Taiichi Ohno, Toyota Production System: Beyond Large-Scale Production, Productivity Press, Cambridge, 1988. 4. Alan Robinson, Continuous Improvement in Automation, Productivity Press, 1991. 5. Kenichi Sekine, One Piece Flow, Productivity Press, Cambridge, 1992. 6. Brian H. Maskell, President, BMA Inc. and Bruce Baggaley, Senior Partner. Lean Management Accounting, http://www.maskell.com/LAMPath4.htm, 2002.