SlideShare una empresa de Scribd logo
1 de 38
Descargar para leer sin conexión
2
SRT257 Research Project: Into Energy
Efficient Design
Please note; the following document is essential reading for SRT257 that
details its chief assignment task. If you do not read this text you will not be
able to effectively navigate the trimester’s assessment requirements.
(Sheppard Sustainable House – Zen Architects)
Using the noteworthy building allocated to you, as a team of five you are to
investigate the relationship between design decisions, environmental
technologies and constructability.
1. Teamwork
As worldwide issues of environmentalism and socio-cultural need are in global trade-off, the
responses demanded of built environment design teams are increasingly complex and
inherently multidisciplinary. Recognising this, the Royal Australian Institute Of Architects1
and
Institution of Engineers, Australia2
, list multidisciplinary teamwork skills as essential attributes
of graduates able to contribute to a globally sustainable future. It is vital, therefore, that
students of all the built environment professions learn how to make decisions together to
create buildings with low environmental impact. SRT257 teaches and assesses, therefore,
resource efficient design and construction skills in multidisciplinary collaborative team
learning contexts as well through individual assignments and examination.
The teaching and learning of sustainability must address this issue of multidisciplinary
collaboration in order to foster more productive solutions in future professional practice. By
addressing these issues, this unit aims ultimately at the education of graduates who are able
to bring leadership to multidisciplinary design collaborations co-operating across international
boundaries towards a global sustainable future.
For the trimester-long Into Energy Efficient Design project, you are required to work in
multidisciplinary teams of five. You are to select your team members during the Week 1
1
(Education Policy 2005 - (RAIA, 2002))
2
(IEAust, Accreditation 1999, as cited in (Carew & Mitchell, 2002))
3
tutorial in the A&B Studio. All team members must be in the same tutorial group. There
should be a mix of Construction Management and Architecture students in your group – such
that there are two of one and three of the other (where double-degree students count as
both).
2. Assessment
The submission consists of two interim reports, one final report and assessed participation in
the Knowledge Depositories (DSO team discussion threads). These are assessed as follows:
1. Interim Report 1
Team submission individually assessed and worth 12% of unit marks;
2. Interim Report 2
Team submission individually assessed and worth 13% of unit marks;
3. Final Report
Team grade individualised by self-and peer-assessment (SAPA – with instruction on
DSO). The final report is worth 20% of the unit marks;
4. Participation in team discussion thread – 5%.
N.B. Interim Report 2 should include Interim Report 1, and the Final Report should include
both interim reports.
3. Into Energy Efficient Design Reports
(From Group 7B redesign of Sean Godsell’s St. Andrew’s Beach House)
1. Report 1
Each team member is responsible for the initial investigation of one of the five tasks
listed in section 4.1 (Construction and Climate). This will require each team-mate to
make an outline assessment of the existing performance of the architecture with
respect to its construction and site, and show graphically how you have measured
and evaluated this performance – (presented in Interim Report 1 – Construction and
Climate). You will each need, therefore, to draw the parts of the building relating to
the component you are using as the basis for your study. These drawings must be
precise, and consist at least of a reworking in your hand of the plans, sections and
elevations supplied. Report 1 is to be submitted digitally to DSO by midnight on
Wednesday August 5th
AND in paper format by 3pm to the Student Hub (or red drop-
boxes) on Friday August 7th
.
2. Report 2
Having analysed the climate of the site and the construction materials of the house,
you are now in a position to measure the thermal performance of the house –
(presented in Interim Report 2 - Measure). Each team member is responsible for the
initial investigation of one of the five tasks listed in section 4.2 (Measure). Report 2
4
(bound together with Report 1) is to be submitted digitally to DSO by midnight on
Wednesday September 2nd
AND in paper format by 3pm to the Student Hub (or red
drop-boxes) on Friday September 4th
.
3. Report 3
With the thermal performance data from Report 2 you are then as a group to work in
collaboration to re-design the house to make improvements to its environmental
performance and to quantify and illustrate these changes. You should clearly present
in the Final Report (3 - “Redisign and Re-measure”) the effects of these changes by
drawing AND modelling the optimal way of integrating the improvements into the
scheme. These subsequent drawings may be overlays of your initial investigation
drawings or new drawings, and must illustrate the improvement to the building’s
performance. The pros and cons of your changes must measured using the analysis
tools you used for Report 2 and should also be costed. In this collaborative stage
Architecture students may (or may not) play a greater role in drawing while
Construction Management students may play a greater role in costing, tabulations,
justifying changes with calculations etc. All Final Report submissions are to be bound
(together with Reports 1 and 2) and submitted by 4pm to the Student Hub on or
before 4pm Wednesday 23rd
October. All Final Report submissions are to be
submitted digitally to DSO on or before 6pm Wednesday 23rd
October.
4. Submission
All drawings are to be printed at A3 landscape format.
All drawings are to be at an appropriate scale so that A3 drawings can be interpreted at a
distance of 2 meters.
All drawings must be consistently titled and authorship identified.
Supporting written photographic and graphic material to be in A3 format bound with the total
Report set (again with authorship clearly noted).
All Final Report submissions are to be bound and submitted by 4pm to the Student Hub on or
before Wednesday 23rd
October.
All standard submission protocols apply. All groups are to hold at least one full copy of their
submission for their own reference.
Each report must be submitted in paper format and digital format (as a PDF submitted via
DSO).
4.1 Report 1 – “Construction and Climate”
In the first report, you are asked to present, using the tools explained in the lectures, an
analysis of the climatic conditions of the site of your house and an analysis too of the
materials used to build your house. There are five components to this analysis that should be
used to inform the individualisation of tasks within your team. You will receive individual
marks for this first part of the report and you therefore must clearly label each page of the
report. The report should be divided into 4 sections; each will present one of the following
analyses;
1. Shadow diagrams, time-temperature chart and sun angle calculations to demonstrate
appropriate shading. (Tasks 1a and 1b).
2. Ecotect climate report and psychometric chart. (Task 2)
3. Water usage and supply report. (Task 3)
4. Materiality/thermal mass model. Model to be photographed for annotated report. 2-
person task.
5
(i) Model indicating existing interior thermal mass and construction materials of
external envelope. (Task 4)
(ii) Annotated report explaining and analysing the model. (Task 5)
Report 1 is to be submitted digitally to DSO by midnight on Wednesday August 5th
AND in paper format by 3pm to the Student Hub (or red drop-boxes) on Friday
August 7th
.
A detailed explanation of the tasks required for Report 1 is included as Appendix 1 at the
end of this assignment description.
4.2 Report 2 – “Measure”
In the second report, you are asked to present an analysis of the thermal performance of
your house using the tools explained in the lectures. There are five components to this
measuring process that should be used to inform the individualisation of tasks within your
team. You will receive individual marks for this second interim report and you must therefore
clearly label each page of the report. The report should be divided into 5 sections; each will
present one of the following analyses;
1. Heat loss calculations.
2. Cooling calculations.
3. First Rate analysis
4. Fluid Mapping
5. Oppenheim thermal mass analysis
If any member of your team is confident using Ecotect you may choose to submit in addition
to the above a shading and thermal performance analysis using the software. The Heat Loss
and Heat Gain calculations might then be combined as one task.
Report 2 (bound together with Report 1) is to be submitted digitally to DSO by midnight on
Wednesday September 2nd
AND in paper format by 3pm to the Student Hub (or red drop-
boxes) on Friday September 4th
.
A detailed explanation of the tasks required for Report 2 is included as Appendix 2 at the
end of this assignment description.
4.3 Final Report – “Redesign and Re-measure”
In the Final Report, you are to present a team re-design of your Into Design House that
makes improvements to its environmental performance. You are to quantify these design
changes using the measurement tools you used in Report 2 and illustrate the changes
graphically and using models (a “before” and “after” model of the house is by far the most
effective way of communicating your proposed changes). You will find that you will be unable
to optimise the energy efficiency of your house with respect to ALL improvements suggested
by the first two stages. Instead, you will need to reach a compromise – a design balance
between cost and constructability and; good thermal insulation and thermal mass, effective
passive heating and cooling, water collection and usage, and adequate shading. This
balance will also need to take into account the designer’s original aesthetic intent. Here, you
must reflect upon how your proposals may have impacted on the constructability of the
building and on the designer’s original architectural intentions.
You should clearly present in the Final Report the effects of these changes by drawing the
optimal way of integrating the changes into the scheme. These subsequent drawings may be
overlays of your initial investigation drawings or new drawings, and must illustrate the
6
improvement to the building’s performance. For each of the changes there should also be a
short description of the pros and cons of the changes - which must be costed and quantified
as a percentage improvement.
In the integration of the changes, you have studied the essential confluence of design ideas
and this integration of technologies must be displayed and discussed. The final submission
should be a single group presentation, but the component that each member has chosen to
focus on should be clearly identifiable in the labelling of your work.
This project (i.e. all three reports) is worth 50% of the marks for this unit and so it should
represent about 10 week’s effort and therefore constitute about 70 hours work for each team
member. The project will certainly be assessed as such.
All Final Report submissions are to be bound (together with Reports 1 and 2) and submitted
by 4pm to the Student Hub on or before 4pm Wednesday 23rd
October. All Final Report
submissions are to be submitted digitally to DSO on or before 6pm Wednesday 23rd
October.
Make sure all work is referenced from the original source using standard academic
referencing systems.
N.B. In your Final Report please avoid if possible “cut-and-pasting”
technological solutions from web sites. You will receive no credit for this.
Instead, illustrate (or model) these solutions in-situ – i.e. show them used in/on
your house.
5. Summary of Project Aims
• To study energy efficient design strategies in a small-scale domestic or semi-
domestic building in Victoria.
•
To introduce the study of energy efficient buildings in terms of integrated systems.
•
To provide an opportunity for collaboration between architecture and construction
management students.
6. Final Group Design Review
Groups must prepare an oral presentation of their final reports to communicate the outcome
of the group's research coherently and in a unified way. Marks will be deducted for
apparently disjointed presentations and those that communicate the outcome of research
poorly. It will be obvious where the team has not considered construction and design
holistically.
Work together as a team.
You will present to a review panel consisting of your tutors and lecturers, guest experts AND
the architect of the house you have redesigned. You will present in front of the drawings you
have made for your final report and hence these drawings must clearly communicate your
work graphically. A “before” and “after” model of your house is a very effective way of quickly
communicating your redesign to a review panel.
N.B. The majority of the assessment of your final Report will be made at this review.
7.1 Late Submission
Late submissions will be deducted 10% per day for a maximum of three days after which
they will not be accepted.
7
Presentation of Into Design Projects will take place during the last two tutorial days of
trimester. It is possible that you will be asked to present at a time that differs from your usual
tutorial time.
7.2 Assessment Criteria
Depth and accuracy of drawings presenting your research into integrated energy efficient
design strategies.
Effectiveness of group presentation in conveying research and development in a well
presented form.
Teamwork and individual work
For teams where one or more members withdraw from the unit or does not complete the
project, assessment will be undertaken from the remainder of the group. Please inform the
Unit Chair or Tutor if you have any problems.
7.3 Fair Assessment of Team-members Contribution
Team/Individual assessment - In order to make sure that each individual within a team
receives a grade that reflects their contribution to the project we will be using an on-line self-
and-peer-continuous-assessment (SAPCA) tool that has been developed over the course of
the last three years. Every week, each team-member must log in to the SAPCA to rate the
contribution of themselves and their teammates. This register uses two quantitative
measures and one qualitative measure. The first measure asks you to award yourself and
your peers a percentage of a team grade. This first measure is backed up by a second that
asks you to rate one another on a five-point multiple-response Likert scale. Self-assessment
in this process has been shown to encourage learners to take responsibility for their own
learning through the making of reflective judgments. The further purpose of the third
qualitative measure, which asks you to comment on your own performance and that of your
peers, is to elucidate anomalies or unexpected final evaluations.
At the end of the project, an assessment matrix will be generated that awards each team
member a multiplier of a final team grade that had been assessed by the unit coordinator,
tutors and moderators. As the SAPCA is an integral part of team-working process, for each
week that you fail to log in to SAPCA and satisfactorily fill in each of the three
measures (the process takes only about 5-10 minutes), 2 marks will be deducted from
your individualised project grade. When you fail to complete the register, it defaults to
award everyone in the team an equal share of the marks. The register will be open each
week from Thursday morning to midnight on Monday. Eighty-five percent of students in 2006
were awarded multipliers within the range of 0.85 – 1.15, for the only students heavily
penalised were those who were consistently rated by all their team-mates as under-
performing. The assessment register will be demonstrated in the lecture introducing the Into
Energy Efficient Design project. Full instructions for its use can be found on the SRT257
contents page of DSO.
8. Submission tips
• Please check your spelling and grammar. These are formal submissions and we
expect you to proof your own work (e.g. please ensure that the personal pronoun ‘I’ is
always a capital letter and that all sentences begin with a capital letter). All reports
should be bound, as stated in the assignment guide, and your name should be clearly
marked on your work – these are simple requirements.
• If In order to obtain higher marks than a Pass or Credit you need to achieve beyond
what is asked for by show initiative, innovation, imagination and a capacity to direct
your own learning.
• Please make sure that you correctly reference all material. It is expected that the
8
majority of the information you will provide will be sourced from elsewhere, so please
acknowledge those cources in a scholarly fashion.
• If you would like feedback, please do not submit reports on a black background or in
plastic pockets.
• At the end of the description of what is required for each task there is a brief summary
of what an HD submission might contain (if done well).
• In the Course Contents folder of DSO there is a file containing exemplary examples
of past student work towards each of the 10 tasks. Your marker will use these
exemplars as benchmarks and so DO NOT BE TEMPTED TO PLAGIARISE these
documents.
• Many people in previous years have left it quite late to start working on their Report
submissions. It is far easier to make the best of limited teaching resources if you
commence the assignments early. That way you have much more opportunity to ask
questions - especially in tutorials. Two tutors (who are architects well experienced in
the field of Sustainable Design) available for an hour each week represents an
excellent resource that many students do not take advantage of.
8. Web sites
1. Buildings Greening of the White House
http://solstice.crest.org/environment/gotwh/index.html
http://www.caddet-ee.org
Solar products Solahart
http://www.solarhart.com.au/index.html
Solahart Industries was established in 1905, and introduced its first solar hot water heater in 1953.
BP Solar
http://www.bpsolar.com
BP Solar is one of the worlds largest solar energy companies. They make photovoltaic panels.
2. Journals Environmental Building News
http://www.ebuild.com
The electronic version of this excellent USA magazine that has articles, reviews and news stories on
energy efficiency and healthy building practices.
3. Organisations
Sustainable Energy Authority of Victoria
http://www.seav.vic.gov.au
The Victorian Government body that has a very good web site with the following topics: about us;
awards; building; business; energy smart advice; links; products; news; renewable energy; schools;
services; State and Local Government
The International Energy Agency
http://www.iea.com
The Australian Greenhouse Office
http://www.greenhouse.gov.au
4. Weather data International weather data
http://www.weatherpost.com/lomgterm/historical/data
9
Weather data for 2000 sites around the world
Australian Bureau of Meteorology
http://www.bom.gov.au
Detailed weather data for most locations in Australia
5. Links to other sites
The International Energy Agency Greentie directory
http://www.greentie.org
10
APPENDIX 1
Interim Report 1 - Task 1.1
Solar movement, solar access and shading
Final Submission Group 2.1 - 2007
Your first task
1. Solar Access
Your task is to prepare shadow diagrams for your Into Energy Efficient Design house. Show
the shadows created at 11 a.m., 1 p.m. and 3 p.m. on June 22;
(i) by the house (i.e. externally) - to demonstrate Solar Access, and
(ii) in the house by the sunlight through windows. You must take into consideration
whether the site is flat or sloped.
Before you begin, copy by hand the ground floor plan of your house at a scale that will allow
you to show the shadow diagram on an A3. Photocopy the blank plan four times, so that you
can draw the two plans required in this assignment and still have two plans free to use in
case you make mistakes.
On drawing no. 1, draw the shadow diagrams for the three times stated - showing the
shadows created in the house and on the ground to the south of the house. Calculate the
open space (inside and outside the house) that is in full sunshine at each of these three
times, and note them as percentages of; (i) the internal floor area, and (ii) the whole outside
plot area.
11
On drawing no. 2, repeat the exercise for each of the three times and show the space that is
in full sunshine at one metre above ground level, and again note them as percentages of the
respective areas. One way to think of this is to imagine that the plot and house has been
filled with concrete up to a depth of one metre and this has now become the new ground
level. Authorities are interested in this level since this is where human activity takes place
outside (such as on table tops). This analysis might also demonstrate where thermal mass
work-surfaces can take advantage of solar gain.
From the above analyses, suggest how the house might make better use of sunlight.
2. Sizing Shading using Time/Temperature Charts
How do you come to grips with the thermal considerations of a site when you are given a
project in an unfamiliar location with an unfamiliar climate? What are the issues you need to
deal with? What are the preferred building materials? How big should the eaves be?
Should you flood the building with light and heat, or shut it up year round?
Your second task
(1) Using weather data for your Into Energy Efficient Design house, which you will find at
Australian Bureau of Meteorology web site (http://www.bom.gov.au), prepare a psychometric
chart for the site of your house. At the base of the sheet, or on another sheet of paper,
explain the following points: the climate type you think it is; the building typology required for
this climate; your recommendations for building mass; the appropriate heating and cooling
techniques for the site.
(2) Using the data you have found, complete a time-temperature chart for the location of
your Into Energy Efficient Design house. You need not plot the 86% and 14% lines, nor the
mean daily minimum temperatures. Calculate the two shading angles at Points “A” and “B”.
Note that the time temperature chart and the psychometric chart can be completed
independently of each other. Select the appropriate fixed shading angle (not adjustable) for
the equatorial facing façade of the house. Calculate the length of horizontal eaves coming
out from the head of the equatorial facing windows. Discuss in about 300 words this eaves
length, the variations that are possible, how they compare to the design as it stands, and
how you might redesign the house to shade it appropriately. Discuss, too, what type of
shading, if any, might improve the environment of the rooms facing east and west.
N.B. In this discussion, use graphic information (i.e. diagrams etc.) as much as
possible to communicate your recommendations. You will be assessed as much on
the effectiveness of your graphic communication of information as on the quality of
the information.
Feedback from previous years on what an HD submission for this task might include:
• Accurate shadow diagrams, showing percentages of internal floor areas and whole
outside plot areas,
• Shadows for ALL three time increments 1m above ground and on ground, with some
explanation of differences,
• Suggestions of how your house could make better use of sunlight,
• Psychrometric charts – accurate and drawn by hand,
• Time temperature charts – accurate and drawn by hand,
• Explain what these diagrams mean,
12
• Calculate the required eaves WITH DIAGRAMS and cross sections of wall and
eaves. Different design solutions for eaves,
• Clear presentation with diagrams rather than paragraphs of writing if possible,
• Demonstration of an understanding of how these concepts can be applied to the
redesign your house.
Resources
A full explanation of how to complete tasks 1a and 1b above can be found in the Solar Movement
lecture notes and in the Analysing Climate lecture notes.
13
Data for Analysis
Blank psychrometric charts. Firstly, photocopy this page so that you will have a spare in case
you make a mistake while doing the first attempt.
Data for Analysis
Below is a blank time temperature chart. Firstly, photocopy this page so that you will have a
spare in case you make a mistake while doing the first attempt. Use the chart for the location
of your Into Energy Efficient Design house.
14
15
Interim Report 1 - Task 1.2
Ecotect Climate Analysis
Ecotect is a comprehensive architectural and environmental design program that includes
modules for analysing weather data, solar shading, thermal performance, lighting, and
acoustics. SolarTool and WeatherTool can be downloaded as stand alone programs for
specific sun and weather analyses. All three are available from Square One Research at
Cardiff University <http://www.squ1.com/>. SolarTool and WeatherTool can be used as free
shareware for educational purposes. Ecotect is also installed on the computer lab PCs.
Your task
For Report 1, you are to use Ecotect to:
(1) Illustrate complete weather data (wind, rain and sun) for the site of your Into Design
House.
(2) Construct a basic computer model of your house that will enable you to include sun
path and shading diagrams. You might even consider internal lighting levels.
(3) Inform the following points: the climate type you think the location is; the building
typology required for this climate; your recommendations for building mass; the
appropriate heating and cooling techniques for the site.
(4) Inform how these recommendations might be incorporated into the design of the
house. These findings will be used to inform your group’s redesign of the house as
depicted in Report 3.
N.B. In this discussion, use graphic information (i.e. diagrams etc.) as much as
possible to communicate your recommendations. You will be assessed as much on
the effectiveness of your graphic communication of information as on the quality of
the information.
Feedback from previous years on what an HD submission for this task might include:
• Temperature profiles
• Wind wheels
• Diurnal range profile
• Rainfall
• Time Temp charts
• Psychometrics
• Rainfall
• Internal and external shadow diagrams
16
Of course, all of this information is quite easily generated once you have the correct data set
and a block model of the house (with openings), so the report was also to include;
1. Conclusions on what the ideal house typology is for the site (orientation, form, construction
type (lightweight, heavyweight), thermal mass, fenestration and shading.
2. Recommendations on what improvements could be made to YOUR HOUSE (not generic
recommendations) based on your findings (and illustrated with simple diagrams).
The most common shortfall is for students to complete the analyses but fail to apply the
findings to their house.
Some students have difficulties importing DFX models into Ecotect. This can be sensibly
solved by building simplified block models in Ecotect.
Resources
Extensive help file and tutorials provided within the software.
17
Interim Report 1 - Task 1.3
Water usage and supply report
Your task
1. Find out the average rainfall for the specific site of your Into Design House – using
climatic data from the nearest weather station which you will find at Australian Bureau
of Meteorology web site (http://www.bom.gov.au).
2. Illustrate how much water you might expect to collect from the roof of your Into
Design House and any of its related roofs.
3. Determine the water usage you might expect for your Into Design House – assuming
four occupants (unless the house is clearly designed for a different number of
people).
4. Discuss the relationship between usage and supply and how you might redress and
shortfall – i.e. how you might reduce usage or increase collection.
5. Design the water storage taking into account the following – (i) the volume of water
you are collecting as informed by steps 1 to 4 above, (ii) the relationship between the
rate of collection and the rate of use, and (iii) the available volume for storage and its
location. In this discussion, indicate and illustrate where on the property you feel this
storage might best be accommodated.
N.B. In this discussion, use graphic information (i.e. diagrams etc.) as much as
possible to communicate your recommendations. You will be assessed as much on
the effectiveness of your graphic communication of information as on the quality of
the information.
Feedback from previous years on what an HD submission for this task might include:
• Demonstration of a balance between specific knowledge for the house and broader
water supply issues;
• Clear and well illustrated presentation;
18
• Clearly outlined assumption and findings;
• Good understanding of occupancy behaviour and how occupants can cut water use;
• Thoughtful design response considering at least the following;
• Options;
• Costs;
• Brands;
• Location of tanks.
Resources
Use the Water Cycle lecture notes and http://www.greenhouse.gov.au.
19
Interim Report 1 - Task 1.4
Materiality/thermal mass model
Your task
(1) Build a model of your Into Design House
(2) Annotate a report
Task 4 requires two people to build a physical model of your Into Design House and to
compile an annotated report explaining the model. You can divide the work for task 4 as you
wish, but you must make clear who was responsible for what.
1. The Model
The model will illustrate:
(1) The different materials that comprise the external envelope of your house.
(2) The house’s interior thermal mass.
The model is an abstraction of your house, not a replica of it. Therefore, you need only
indicate different materials, not replicate them. For example, if your house has a grass roof –
use, perhaps, green card to show this but do not try to replicate grass by using a grass-like
material.
The roof of the model should be removable so that you can indicate interior thermal mass.
Thermal mass is such dense heavyweight materials as concrete slab floors and brick walls.
Thermal mass needs to be inside the insulation overcoat that is wrapped around the building
to be effective. Thus, thermally massive materials that are uninsulated and exposed to
outside air do not count as thermal mass. Materials that are not considered heavyweight
include timber, insulation, plasterboard / gypsum, etc.
2. Annotated Report
After building the model, use PhotoShop or a similar tool to annotate and render photographs
of your model to indicate:
(i) The different materials of the external envelope.
(ii) Which materials are thermal mass.
20
In your report, indicate the area (in metres squared) of (i) each different material of the
external envelope and of, (ii) thermal mass.
Thermal mass (for these calculations only) is taken to be 100 mm deep. If an internal wall is
200 mm thick and exposed to room air on both sides, both surface areas can be counted for
thermal mass surface area. If the wall is only 100 mm thick and exposed to air on both
sides, only one side can be counted. Thermal mass that is uninsulated and exposed to
outside air does not count as thermal mass in these calculations. Thus an external veneer of
masonry outside the insulation layer in a brick veneer construction does not count as thermal
mass.
You will also need to report on how “green” you think each material is taking into account,
say:
(i) Whether it was made from a renewable source
(ii) The embodied energy it took to make it compared to its predicted life-span
(iii) How recyclable it is and/or whether it could be substituted by a recycled material.
In the report (Report 1), clearly indicate which person was responsible for which of the above
tasks.
N.B. In this discussion, use graphic information (i.e. diagrams etc.) as much as
possible to communicate your recommendations. You will be assessed as much on
the effectiveness of your graphic communication of information as on the quality of
the information.
Feedback from previous years on what an HD submission for this task might include:
• Photographs showing - an accurate and well made model;
• Photographs showing - a model that clearly indicated the components of the external
envelope that had different heat transfer properties;
• Photographs showing - a model that clearly indicated thermal mass and where this
was in relation to the insulation blanket;
• Clearly labelled photographs that highlighted the elements being identified;
• Areas in square metres of the different external envelope materials and of thermal
mass indicated using diagrams of the house;
• Embodied Energy analysis illustrated using diagrams;
• Embodied Water analysis illustrated using diagrams;
• Conclusions on the house’s performance with regards to thermal mass, EE and EW
and recommendations for improvements based on these conclusions.
21
APPENDIX 2
Interim Report 2 - Task 2.1
Heat loss calculations
Before you begin the calculation, you must find out the area of all the different materials that
comprise the external envelope. These should have been recorded in section 4 of interim
Report 1. You will also need to find out the u-values of all these materials. You can find these
values out from the table below. If your material is not listed, use that material that is the
closest to it in terms of its thermal properties – or you might find out u or r-values from
manufacturers data (available via the internet).
Outline assumptions for the house
• Assume 0.5 air changes /hour
• Gas heater is 70% efficient, electric heater 100%
• Indoor design temperature is 21 0
C
Your task
(1) Calculate the peak heat loss rate, the steady heat loss rate and the annual space-
heating load assuming the windows are single glazed.
(2) When you have finished this, redo the calculation with all the windows being double-
glazed. Double glazed windows will reduce the heat loss and even though cost more, they
will result in lower operating costs.
Discuss the implications of your findings for the redesign of your Into Design house.
Resources
A full explanation of how to complete task can be found in the Heat Loss lecture notes. Use
also the tables provided at the end of the explanation of task 2 below.
Feedback from previous years on what an HD submission for this task might include:
• had diagrams showing location / size of different materials
• identified areas of greater heat loss
• explored heat loss calculations for different energy saving options
• analysed space heating costs for single vs double glazing
• analysed reduction in Co2 emissions
• analysed payback period
• provided a discuss on the above results
• clear, concise presentation
• suggestions for reducing heat loss
• explained how u values were derived
Common errors / omissions:
• no source provided for figures used
• difficult to follow format
• not showing full workings for both single and double glazed options
22
Interim Report 2 - Task 2.2
Cooling calculations
Before you begin the calculation, you must find out the area of all the different materials that
comprise the external envelope. These should have been recorded in section 4 of interim
Report 1. You will also need to find out the u-values of all these materials. You can find these
values out from the table below. If your material is not listed, use that material that is the
closest to it in terms of its thermal properties – or you might find out u or r-values from
manufacturers data (available via the internet). All of this information is required for task 2.1,
so you should co-ordinate your efforts with the person in your team responsible for that task.
Note that an awning is a device that provides outdoor shading. Inside shading refers to a
blind (or in our language "a shade" that can be pulled down to block direct sunlight on the
inside of the glass. You are asked to do two calculations. One where there is no
impediment to the sun coming into the building (use values from Table 2 marked "no awnings
or inside shade") and another calculation with all the windows shaded (use values from Table
2 marked "Awnings").
Outline assumptions for the house
• Assume 0.5 air changes /hour
• Internal temperature 25.7 0
C and outside design temperature of 35 0
C
• Temperature range is 12 0
C
• Four occupants, one kitchen
Your task
(1) For your Into Design House, assuming there is no awnings, overhangs, trees, etc. to
shade the windows, calculate the peak cooling load.
(2) When you have finished this, redo the calculation with all the windows appropriately
shaded and obtain the new peak cooling load.
Discuss the implications of your findings for the redesign of your Into Design house.
Resources
A full explanation of how to complete task can be found in the Cooling calculations lecture
notes. Use also the tables provided below.
Feedback from previous years on what an HD submission for this task might include:
• Detailed exploration of alternatives, ie. Double glazing, shaded, un-shaded, shaded
with double glazing etc. How the results may be implemented in the future redesign;
• A description and understanding of what the implications of different options are. Cost
benefit versus performance. Payback periods;
• Accurate calculations of u values for specific building components;
• Suggestions with appropriate research;
• Clear and readable layout.
Common errors / omissions
• Unclear and difficult format (it was as easy as to provide the original format for
tables);
• Spelling and general layout.
23
THERMAL RESISTANCE VALUES FOR VARIOUS MATERIALS - Page 1
(a) Thermal Resistance of Building Materials
Building materials have a thermal resistance for a specified thickness. Refer to the AIRAH Design Manual,
Section 3, Part 1, Heat Transfer Data for Building Components and Elements, Table 3.1 This resistance is called
an R value and is measured in m2 0C / W. (The inverse of an R value is called a U-value and is measured in W/
m2 0
C). The Table below gives the resistance values for some typical building materials with typical thicknesses.
WALL STRUCTURE
R (m
2
C/W) GLASS AND WINDOWS R (m
2
C/W)
Brick, 110 mm, 1760 kg/m3 0.086 Glass, float, 6 mm 0.006
Concrete, 100 mm, 2400 kg/m3 0.069 Timber framed window, single glazed * 0.19
Concrete, lightweight, 100 mm, 1900 kg/m3 0.15 " " " , double glazed * 0.36
Concrete block, hollow, 190 mm 0.19 Aluminium framed window, single glazing * 0.14
Concrete block, hollow, 90 mm 0.14 " " " , double glazed * 0.21
Adobe block, mud brick, 300 mm 0.24 PVC framed window, single glazed * 0.20
Plasterboard, 10 mm 0.059 " " " , double glazed * 0.33
Plasterboard, 13 mm 0.077
Cement render, 15 mm 0.03 INSULATION
Cement render and plaster, 15 mm 0.03 Insulation, glass fibre blanket, 50 mm 1.16
Weatherboards, pine, 12 mm ave 0.086 Insulation, compressed straw, 50 mm 0.62
Fibre cement sheet, 6 mm 0.019
FLOORS Polystyrene, expanded, 25 mm 0.67
Particle board, 18 mm 0.17 Polystyrene, expanded, 50 mm 1.28
Timber flooring, hardwood, 19 mm 0.119 Polystyrene, foamed, aged, 50 mm 2.00
Concrete slab, 100 mm, 2400 kg/m3 0.069 Reflective foil laminate 0.00
Carpet and underlay, 30 mm 0.5
Concrete slab on ground (winter) 1.47 GENERAL
ROOFS Ceramic wall tiles, 12 mm 0.011
Clay tiles, 19 mm 0.023 Timber, ash, 25 mm 0.16
Metal decking 0 Timber, pine, 25 mm 0.25
Bituminous roofing, 10 mm 0.061 Plywood, 5 mm 0.036
Table 3.1 Thermal resistance of building materials
* These R values are for complete constructions including air films
(b) Thermal Resistance of Air Films
Air films have a thermal resistance depending on wind speed, orientation of the surface, direction of the heat flow,
and emittance of the boundary surface (normal building materials have a high emittance). Refer to the AIRAH
Design Manual, Section 3, Part 1, Heat Transfer Data for Building Components and Elements, Table 3.3. This
Table is reproduced below.
Location of air
film and speed
(wind speed in
m/s)
Position
of
surface
Direction of
heat flow
High emittance
surface (normal
bldg materials)
Resistance in
m2.K/W
Low emittance
surface (shiny
surfaces)
Resistance in
m2.K/W)
Inside air film, or still Horizontal Up 0.11 0.23
(0 m/s) " Down 0.16 0.80
450
slope Up 0.11 0.24
" Down 0.13 0.39
22½0
slope Up 0.11 0.24
" Down 0.15 0.60
Vertical Horizontal 0.12 0.30
Inside gently moving air
(0.5 m/s)
Any position Any direction 0.08 0.08
Outside air film in
winter (6 m/s)
" " 0.03 0.03
Outside air film in
summer (3 m/s)
" " 0.04 0.04
Table 3.3 Thermal resistance of air films
In winter only, for pitched tiled roofs with no layer of sarking installed, the outside surface of the composite
construction is considered to be the upper surface of the ceiling lining or bulk insulation, with the surface
resistance of the air film being considered that for still air (0 m/s). The thermal resistance of the roof space and
tiles are ignored.
In winter only, for pitched tiled roofs with a layer of sarking installed, the outside surface of the composite
construction is considered to be the upper side of the foil, with the surface resistance of the air film being
considered that for outside air ( ie 6 m/s). The thermal resistance of the air space and tiles above the foil laminate
are ignored.
24
THERMAL RESISTANCE VALUES FOR VARIOUS MATERIALS - Page 2
(c) Thermal resistance of air spaces
Air spaces have thermal resistances depending on the nature of the boundary surface, direction of heat flow,
orientation of the surface, and the width of the air space. Refer to the AIRAH Design Manual, Section 3, Part 1,
Heat Transfer Data for Building Components and Elements, Table 3.4. This Table is reproduced below.
Nature of
bounding surface
Position of
surface
Direction of heat
flow
20 mm width of
air space:
resistance in
m2.K/W
100 mm width of
air space:
resistance in
m2.K/W
2 high Horizontal Up 0.15 0.17
emittance surfaces " Down 0.15 0.17
(ie both normal 450
slope Up 0.17 0.17
bldg materials) " Down 0.15 0.16
Vertical Horizontal 0.15* 0.16
1 high & 1 low Horizontal Up 0.39 0.48
emittance surface " Down 0.57 1.42
(ie one normal bldg 450
slope Up 0.49 0.53
& one shiny surface) # " Down 0.57 0.77
Vertical Horizontal 0.58* 0.61
2 low Horizontal Up 0.41 0.51
emittance surfaces " Down 0.63 1.75
(ie both shiny 450
slope Up 0.52 0.56
surfaces) # " Down 0.62 0.85
Vertical Horizontal 0.62* 0.66
Table 3.4 Thermal resistance of air spaces
* For vertical air spaces greater than 20 mm, with horizontal heat flow, the value of resistance for 100 mm should
be used.
# Note that for reflective foil that is blue one side and shiny the other, both sides are low emittance surfaces.
(d) Thermal resistance of air spaces in roofs
Air spaces in roofs have a thermal resistance depending on whether they are ventilated or unventilated, the
direction of the heat flow, and the emittance of the surface. Refer to the AIRAH Design Manual, Section 3, Part 1,
Heat Transfer Data for Building Components and Elements, Table 3.5. This table is reproduced below.
Location of space Direction of
heat flow
High emittance surface
(i.e. normal bldg
materials)
Resistance in m2.K/W
Low emittance
surface (i.e. shiny
surfaces)
Resistance in
m2.K/W
Ventilated roof space Up (ie winter) 0.0 0.34
Down (ie summer) 0.46 1.36
Non-ventilated roof space Up 0.18 0.56
Down 0.28 1.09
Table 3.5 Thermal resistance of pitched roof spaces
25
HEAT LOSS CALCULATION SHEET (1)
BUILDING FABRIC LOSS
Location Material Area
(m2)
U-value
(W/m2/deg
C)
Temperature
difference
(deg C)
Heat loss
(W)
Floor
Walls
Windows
Roof/ceiling
Total building
fabric loss
INFILTRATION LOSS
Location Volume of
space (m3)
Air
changes
per hour
Conversion
factor
Temperature
difference
(deg C)
Heat loss
(W)
0.36
Infiltration loss
TOTAL HEAT LOSS
(PEAK HEAT LOSS)
(W)
STEADY STATE HEAT LOSS RATE
(Peak heat loss rate divided by
temperature difference) (W/deg C)
ANNUAL SPACE HEATING LOAD
Heating degree
days
Conversio
n factor for
units
Correction
factors for
occupancy
Steady
state heat
loss rate
(W/deg C)
Annual space
heating load
(MJ) (if reqd
in kWh divide
answer by 3.6)
0.0864
ANNUAL SPACE
HEATING LOAD
26
HEAT LOSS CALCULATION SHEET (2)
BUILDING FABRIC LOSS
Location Material Area
(m2)
U-value
(W/m2/deg
C)
Temperature
difference
(deg C)
Heat loss
(W)
Floor
Walls
Windows
Roof/ceiling
Total building
fabric loss
INFILTRATION LOSS
Location Volume of
space (m3)
Air
changes
per hour
Conversion
factor
Temperature
difference
(deg C)
Heat loss
(W)
0.36
Infiltration loss
TOTAL HEAT LOSS
(PEAK HEAT LOSS)
(W)
STEADY STATE HEAT LOSS RATE
(Peak heat loss rate divided by
temperature difference) (W/deg C)
ANNUAL SPACE HEATING LOAD
Heating degree
days
Conversio
n factor for
units
Correction
factors for
occupancy
Steady
state heat
loss rate
(W/deg C)
Annual space
heating load
(MJ) (if reqd
in kWh divide
answer by 3.6)
0.0864
ANNUAL SPACE
HEATING LOAD
27
TABLES THAT SUPPLY INFORMATION FOR HEATING CALCULATIONS - Page 1
Table 1 - Outdoor design temperature for winter
This Table is derived from AIRAH Design Data Manual, pp 1.4 - 1.7
Location Outside design
temp for winter
(deg C)
Location Outside design
temp for winter
(deg C)
Adelaide 6.5 Melbourne 4.5
Alice Springs 3.5 Newcastle 4.5
Ballarat -1.0 Perth 9.0
Brisbane 10.5 Port Hedland 15.0
Canberra 0.5 Sale 2.0
Darwin 18.5 Sydney 7.0
Hobart 3.0 Townsville 13.0
Kalgoorlie 5.5
Table 2 - Heating Degree Days for some Australian cities
This table is derived from L.F. O'Brien, "Heating Degree Days for some Australian Cities", CSIRO, DBR Reprint
No 506
Location Degree days (deg
C)
Location Degree days (deg
C)
Adelaide 1280 Melbourne 1500
Alice Springs 660 Newcastle 770
Brisbane 310 Perth 775
Canberra 2270 Port Hedland 42
Darwin 0 Sydney 720
Hobart 2300 Townsville 43
Kalgoorlie 1010
Table 3 - Correction factors for Occupancy
This table is from A.B. Coldicutt et al "The Value of Insulation", Chartered Builder, Vol 18, Dec - March 1977.
Structure Occupancy Factor*
Hours of occupancy for 7 days per week
( ) show hours of occupancy 5 days a week with weekend
shutdown
6 hours
per day
12 hours
per day
16 hours
per day
24 hours
per day
Lightweight
structure
0.50
(0.40)
0.75
(0.55)
0.85
(0.65)
1.0
(0.75)
Medium
structure
0.60
(0.55)
0.80
(0.60)
0.90
(0.68)
1.0
(0.75)
Heavy
structure
0.85
(0.65)
0.90
(0.68)
0.95
(0.72)
1.0
(0.75)
28
COOLING LOAD CALCULATION SHEET (1)
The Table below is a simple sheet that can be used for cooling load calculations.
QE COOLING LOAD CAUSED BY HEAT GAIN VIA BUILDING FABRIC
Location Material Area
(m2)
U-value
(W/m
2
/deg
C)
Equivalent
Temp diff
(
0
C) (Table
1)
Heat gain
(W)
Floor
Walls – north
west
south
east
total
Roof/ceiling
Check that fabric gain is about ……. Total fabric
heat gain
Qg COOLING LOAD CAUSED BY HEAT GAIN VIA GLAZING
Location Material Area
(m2)
Combined
SHG+CHG
(W) (Table
2)
Heat gain
(W)
North
West
South
East
Roof
Check that glazing gain is about ……. Total glazing
heat gain
Qv COOLING LOAD CAUSED BY INFILTRATION/VENTILATION GAIN
Volume of
space
(m
3
)(V)
Air changes
per hour (N)
Conversion
factor
Temperature
diff (deg C)
Heat loss
(W)
0.36
Check that infiltration gain is about …… Total infiltr’n
heat gain
QE COOLING LOAD CAUSED BY HEAT GAIN VIA INTERNAL GAINS
Items Number of
items
Heat output
rate (Table
3)
Heat gain
(W)
People
Lights
Equipment
Check that ……. Total internal
heat gain
QC TOTAL COOLING LOAD
Building
fabric
Glazing Infiltration Internal
gains
Total
multiplied by
1.3
Heat gain
(W)
x 1.3
Check that total cooling load is ……. Total cooling
load
29
COOLING LOAD CALCULATION SHEET (2)
The Table below is a simple sheet that can be used for cooling load calculations.
QE COOLING LOAD CAUSED BY HEAT GAIN VIA BUILDING FABRIC
Location Material Area
(m2)
U-value
(W/m
2
/deg
C)
Equivalent
Temp diff
(
0
C) (Table
1)
Heat gain
(W)
Floor
Walls – north
west
south
east
total
Roof/ceiling
Check that fabric gain is about ……. Total fabric
heat gain
Qg COOLING LOAD CAUSED BY HEAT GAIN VIA GLAZING
Location Material Area
(m2)
Combined
SHG+CHG
(W) (Table
2)
Heat gain
(W)
North
West
South
East
Roof
Check that glazing gain is about ……. Total glazing
heat gain
Qv COOLING LOAD CAUSED BY INFILTRATION/VENTILATION GAIN
Volume of
space
(m
3
)(V)
Air changes
per hour (N)
Conversion
factor
Temperature
diff (deg C)
Heat loss
(W)
0.36
Check that infiltration gain is about …… Total infiltr’n
heat gain
QE COOLING LOAD CAUSED BY HEAT GAIN VIA INTERNAL GAINS
Items Number of
items
Heat output
rate (Table
3)
Heat gain
(W)
People
Lights
Equipment
Check that ……. Total internal
heat gain
QC TOTAL COOLING LOAD
Building
fabric
Glazing Infiltration Internal
gains
Total
multiplied by
1.3
Heat gain
(W)
x 1.3
Check that total cooling load is ……. Total cooling
load
30
TABLES THAT SUPPLY INFORMATION FOR COOLING CALCULATIONS - Page 1
Table 1 – Equivalent Temperature Difference ( 0
C )
This Table is derived from ASHRAE Handbook of Fundamentals, p441, Table 50
Design Temperature 29 29 32 32 32 35 35 38 38 41 41
Daily temperature range L M L M H L M H M H H
WALLS AND DOORS
1. Frame and veneer on frame 9.7 7.5 12.5 10.3 7.5 15.3 13.1 10.3 15.9 13.1 15.9
2. Masonry, 200 block or brick 5.7 3.5 8.5 6.3 3.5 11.3 9.0 6.3 11.8 9.0 11.8
3. Frame partitions 5.0 2.8 7.8 5.6 2.8 10.6 8.3 5.6 11.1 8.3 11.1
Masonry partitions 1.4 0.0 4.1 1.9 0.0 6.9 4.7 1.9 7.5 4.7 7.5
4. Wood doors 9.7 7.5 12.5 10.3 7.5 15.3 13.1 10.3 15.9 13.1 15.9
CEILINGS AND ROOFS
1. Under naturally vented attic
or vented flat roof - dark 21.1 18.9 23.8 21.6 18.9 26.6 24.4 21.6 27.2 24.4 27.2
or vented flat roof - light 16.7 14.4 19.4 17.2 14.4 22.2 20.0 17.2 22.8 20.0 22.8
2. Built-up roof, no ceiling – dark 21.1 18.9 23.8 21.6 18.9 26.6 24.4 21.6 27.2 24.4 27.2
– light 16.7 14.4 19.4 17.2 14.4 22.2 20.0 17.2 22.8 20.0 22.8
3. Under unconditioned rooms 5.0 2.8 7.8 5.6 2.8 10.6 8.3 5.6 11.1 8.3 11.1
FLOORS
1. Over unconditioned rooms 5.0 2.8 7.8 5.6 2.8 10.6 8.3 5.6 11.1 8.3 11.1
2. Over basement, enclosed crawl
space or concrete slab on ground
0 0 0 0 0 0 0 0 0 0 0
3. Over open crawl space 5.0 2.8 7.8 5.6 2.8 10.6 8.3 5.6 11.1 8.3 11.1
For the Daily Temperature Range, L (Low) means 6.5 (range less than 8.5), M (medium) means 11 (range between 8.5 and
14) and H (high) means 16.6 (over 14).
For Ceilings and Roofs, for roofs in shade, the eight hour average is 6 deg temperature differential. At 32 C design and
medium daily range, equivalent temperature for light coloured roofs = 17
31
TABLES THAT SUPPLY INFORMATION FOR COOLING CALCULATIONS - Page 2
Table 2 – Solar Heat Gain through windows and Conducted Heat Gain Sensible Cooling Load due to transmitted
and absorbed solar energy due to air to air temperature difference ( W/m2
). This table is derived from ASHRAE
Handbook of Fundamentals, p441, Table 51. NOTE: These tables show orientations for the NORTHERN HEMISPHERE
first, followed by orientations for the SOUTHERN HEMISPHERE in (brackets).
Outdoor Design Temperature Regular single glazing Regular double glazing
29 30 35 38 41 29 30 35 38 41
NO AWNINGS OR INSIDE SHADING
North (South) 72.6 85.2 97.8 110.4 119.9 59.9 66.3 75.7 82.0 88.3
NE and NW (SE and SW) 176.7 189.3 201.9 214.5 224.0 145.1 151.4 160.9 167.2 173.5
East and West 255.6 268.2 280.8 293.4 302.9 214.5 220.9 230.3 236.6 242.9
SE and SW (NE and NW) 220.9 233.5 246.1 258.7 268.2 186.1 192.5 201.9 208.2 214.5
South (North) 126.2 138.8 151.4 164.1 173.5 104.1 110.4 119.9 126.2 132.5
DRAPERIES OR VENETIAN BLINDS
North (South) 47.3 59.9 72.6 85.2 94.7 37.9 44.2 53.6 59.9 66.3
NE and NW (SE and SW) 101.0 113.6 126.2 138.8 148.3 85.2 91.5 101.0 107.3 113.6
East and West 151.4 164.1 176.7 189.3 198.8 132.5 138.9 148.3 154.6 160.9
SE and SW (NE and NW) 126.2 138.8 151.4 164.1 173.5 104.1 110.4 119.9 126.2 132.5
South (North) 72.6 85.2 97.8 110.4 119.9 59.9 66.3 75.7 82.0 88.3
ROLLER SHADES HALF DRAWN
North (South) 56.8 69.4 82.0 94.7 104.1 47.3 53.6 63.1 69.4 75.7
NE and NW (SE and SW) 126.2 138.8 151.4 164.1 173.5 104.1 110.4 119.9 126.2 132.5
East and West 192.5 205.1 217.7 230.3 239.8 170.4 176.7 186.1 192.5 198.8
SE and SW (NE and NW) 164.1 176.7 189.3 201.9 211.4 145.1 151.4 160.9 167.2 173.5
South (North) 91.5 104.1 116.7 129.4 138.8 85.2 91.5 101 107.3 113.6
AWNINGS
North (South) 63.1 75.7 88.3 101.0 110.4 41.0 47.3 56.8 63.1 69.4
NE and NW (SE and SW) 66.3 78.9 91.5 104.1 113.6 44.2 50.5 59.9 66.3 72.6
East and West 69.4 82.0 94.7 107.3 116.7 44.2 50.5 59.9 66.3 72.6
SE and SW (NE and NW) 66.3 78.9 91.5 104.1 113.6 44.2 50.5 59.9 66.3 72.6
South (North) 66.3 75.7 88.3 101.0 110.4 41.0 47.3 56.8 63.1 69.4
Table 3 – Heat output for various heat sources
Heat source Heat output Item Heat output
People, varies 66 Kitchen say 35
Lights wattage of lamps
Table 4 – Outdoor design temperature for various cities
This table is derived from AIRAH Design Data, pp 1.4 – 1.7, Table 1.1. They show the outdoor 3 pm dry-bulb
temperatures which individually are exceeded on 10 days of the year.
Location Outdoor design
temp (deg C)
Location Outdoor design
temp (deg C)
Adelaide 36.0 Melbourne 34.5
Alice Springs 39.5 Newcastle 32.0
Brisbane 31.0 Perth 36.0
Canberra 34.0 Port Hedland 39.5
Darwin 34.5 Sydney 30.5
Hobart 26.0 Townsville 32.0
Kalgoorlie 40.0
32
Interim Report 2 - Task 2.3
First Rate analysis
FirstRate has been developed by the Sustainable Energy Authority of Victoria to help designers conduct
an energy analysis on home designs that is quick and interactive.
Your task
(1) Conduct a FirstRate rating on the house you have been assigned for the Into Design Project.
(2) Make design recommendations, informed by your use of FirstRate, to improve the rating
of your house.
(3) Prepare a short appraisal of the software.
Data to be gathered
In order to give the dwelling a rating, certain data must be gathered as noted below (which means that
your own home may be the best selection). Dimensions that are to the nearest 100 mm should be
sufficient. Clearly, not all the information that you require to make the assessment will be on the
drawings you have been supplied, or in the extra data that you have been able to gather. You will
therefore have to make best-guess assumptions about some of these building elements. It is very
important that you list the assumptions that you have made, and the reasons why you have made them,
in the reporting section of the FirstRate software.
The list below from the FirstRate manual shows the information required to complete the FirstRate
rating.
Floor Plan Floor areas and types Site plan Distance from & height of adjacent bldgs
Doors between heated spaces
Area of opening between floors Elevations Orientation of windows
Perimeter of house Height of windows
Length of internal masonry walls Distance between window head &
overhang
Size of roof glazing/skylights
Size of overhangs Other info Insulation levels
Types of floor coverings Types of curtains
Number of chimneys Extent of weatherstrips to doors &
windows
Number of exhaust fans Types of external walls
Number of vented downlights Extent of external blinds
Extent of cathedral ceilings Types of window frames
Extent of double glazing
33
Section Average ceiling height Type of exhaust fans
Internal & external wall heights Whether skylights are vented or not
Appraisal and Recommendations
Write a short appraisal (approx 150 words) summarising your impressions of the FirstRate system,
including comments on how easy it was to use, any limitations you perceive, and what you have
learned from the use of the software.
Prepare an illustrated Recommendations Report detailing the changes you might make to the
design of your Into Design House to improve its performance and the effect these changes have
on the FirstRate rating and points score.
Submission
Printout of FirstRate rating, report, software appraisal and Recommendations Report to be handed in as
part of Interim Report 2. Only 1 FirstRate appraisal is required per team. You should use the appraisal
and the recommendations you make to inform your redesign of the house you have been assigned.
Resources
Extensive help file and tutorials provided within the software.
Feedback from previous years on what an HD submission for this task might include:
Students generally have a good grasp of the software, however many fail to meet basic requirements
such as submitting a copy of the First Rate report. Students could greatly increase their mark by
demonstrating they have properly read the task and submitting the report as requested.
High distinction:
• original and improved report provided (as required);
• appraisal of software provided (as required);
• discussion of improvements made, and clear indication of what the improvements were;
• clear list of assumptions;
• diagram showing cross ventilation;
• research into suggested improvements;
• plan / section diagrams showing the locations of different materials.
Common errors / omissions:
• not including actual First Rate report (this requirement is clearly stated in the task outline);
• not including software appraisal;
• no clear discussion of improvement options.
34
Interim Report 2 - Task 2.4
Fluid Mapping
Your task
Fluid Mapping: On-site ventilation analysis.
(1) Construct a Plan and Section model to a 1:50 scale of your project. The model represents a thin
slice through your Into Design House. Below are fluid-mapping photographs of a house plan. The Fluid
Mapping model materials will be detailed in the lecture. Models usually consist of small strips of MDF
(representing walls) glued to a sheet of glass.
The flow of the coloured fluid is photographed to provide for analysis.
(2) Test the existing ventilation features of your house in plan and section in a manner that reconstructs
the dominant wind characteristics of the climate of where your house is located. Consider microclimate
influences too, such as site restrictions, adjacent buildings, vegetation or external devices that may
hinder the ventilation design intent. Test the house as it is (before redesign) with windows/doors closed
and then with windows/doors open.
(3) After an analysis of the existing conditions, you should have identified shortcomings in the design (if
any). Now propose alternative solutions to improve ventilation and to test these through additional fluid-
mapping analyses.
Resources
Refer to the two papers posted on DSO:
35
Feedback from previous years on what an HD submission for this task might include:
This task is generally completed quite well, although many students do not explain where their wind
data originates and/or do not properly explore options to improve the design. Successful submissions
included:
• clearly presented ‘before & after’ modelling;
• floor plan and section and/or site plan tested;
• wind speed and direction taken into account;
• demonstrated an understanding of air movement speeds within a house;
• effective, simple proposed solution;
• demonstrated an understanding of how to condition breezes within the house;
• did not view fluid mapping in isolation but understood the broader effects of proposed changes.
Common errors / omissions:
• lack of clear annotations (e.g. plan or section);
• poor presentation, printing in black & white;
• improvement options not explored as fluid mapping models;
• source for wind data not credited.
36
Interim Report 2 - Task 2.5
Calculating Energy Efficient Design using the Oppenheim thermal
mass rule-of-thumb analysis
Final Submission Group 2.1 – 2007
Good energy efficient design for temperate climates can be quickly achieved in the broad brush by
using the Oppenheim Method. Once the brief is known and areas for each space allocated, this quick
calculation method can give approximate areas for north facing glass and the surface areas of the
thermal mass. It can be applied to whole areas, or single rooms.
Your task
For your Into Design House, use the Oppenheim Method to calculate the following:
(a) For a north facing Living/Dining/Kitchen area (or equivalent), calculate:
(1) The zone floor area
(2) The ideal north facing glass area
(3) The ideal surface area of thermal mass required for; (i) the existing glass area and, (ii) the ideal
area of glass.
Discuss then the relationship between the existing thermal mass and:
(i) That required for the existing glass area and,
(ii) That required for the ideal area of glass.
How might the relationship between glass area and thermal mass be improved in both circumstances
(ideal and existing)? In this discussion, consider the following points: If more surface area than a
concrete slab is required, suggest the location of other surfaces that could be used (for example it may
be appropriate to use additional masonry walls in the living space). The surface areas will be masonry
walls, but if a concrete slab is exposed as a ceiling, it too can be used. If greater surface-area is
37
required, as calculated from the Oppenheim method, then additional wall surface-area can be used.
You cannot count the area of windows in these walls, just the surface area of the masonry. After you
have suggested these surfaces, give an indication of how big this additional wall surface area might
need to be in m2
.
N.B. In this discussion, use graphic information (i.e. diagrams etc.) as much as possible to
communicate your recommendations. You will be assessed as much on the effectiveness of
your graphic communication of information as on the quality of the information.
Resources
Use the Residential design in temperate climates lecture notes.
Feedback from previous years on what an HD submission for this task might include:
• Diagrams;
• Clear and colour coded plans of different zones identified correctly;
• Discussion of benefits and negative aspects of the existing design;
• Correct use of the method;
• Discussion of thermal mass ratios;
• Some improvements, taking into account glazing area and thermal mass and the interrelationship of the
two;
• Implications to the redesign;
• Sensitivity to the aesthetics and initial intent of the design; and how to redesign according to this;
• Research and options of appropriate thermal mass materials.
Common errors / omissions
• Spelling
• Unclear presentation / diagrams.
• No information regarding implications of thermal mass vs. glazing.
38
APPENDIX 3
Final Report 3 & Oral Presentation
Final Submission Group 2.1 - 2007
Report 3 is the culmination of your semester’s work and is worth, therefore, 20% of the unit marks. It is
assessed as a group submission, but marks may be individualised by SAPA.
In the Final Report (Report 3), you are to:
(1) Present graphically and using models a team re-design of your Into Design House that makes
improvements to its environmental performance. It is suggested that you make your design
changes clear by presenting them in ‘before’ and ‘after’ illustrations (and models).
(2) Quantify (i.e. demonstrate the effectiveness of) these design changes by (i) using the
measurement tools you used in Report 2, and by (ii) ascertaining budget implications (payback
etc.) and by (ii) ascertaining changes to the overall embodied energy it took to make the house
compared to its predicted life-span.
Please note the following points with regards to the Final Report and your oral presentation of it.
I. No student work will be marked unless it is part of the Report 3 group submission. Thus, work
submitted individually will be ignored. Report 3 is a GROUP submission.
II. Your time for the oral presentation is brief - around 10 to 12 minutes. Thus, be concise.
Concentrate on - what you have changed in the redesign, why you changed this, and what effect
those changes will make.
39
III. All teams must be present for the entire 2-hour session of which their oral presentation is a part of.
Each team must fill out one feedback sheet for each of the other groups in their session. Failure to
do this will result in a mark penalty.
IV. The final report is to be submitted to Marj in the resource centre by 11:30 am on Thursday the 4th
October. There can be no extensions granted.
V. The final report submission must contain the first two Interim Reports in addition to Part 3. You
will, however, only pin-up and present at your review Part 3 of the report – Part 3 being the
redesign (clearly indicating before and after, the reasons for your changes, and the cost
implications of these changes).
VI. If you wish to; (i) pin-up review drawings (A3s) that differ from those submitted in Part 3 of the final
report, (ii) and/or present using PowerPoint – you must submit the review set of drawings and the
PowerPoint when you submit the final report at the Resource Centre. This is to ensure that groups
presenting in Week 13 do not have an advantage over those presenting in Week 10.
VII. The timetable for submission may have your team presenting at a time that differs from your
normal tutorial time. This timetable might not be announced until the day before you present, as
we are waiting to here from the architects who designed the houses about their availability. Thus,
please check DSO regularly for the Review timetable.
VIII. The majority of the assessment of your final Report will be made at the oral review.

Más contenido relacionado

Similar a Into engergy efficient design

A METHODOLOGICAL APPROACH TO SUPPORT BUILDING LIFE CYCLE ANALYSIS - Andy McNa...
A METHODOLOGICAL APPROACH TO SUPPORT BUILDING LIFE CYCLE ANALYSIS - Andy McNa...A METHODOLOGICAL APPROACH TO SUPPORT BUILDING LIFE CYCLE ANALYSIS - Andy McNa...
A METHODOLOGICAL APPROACH TO SUPPORT BUILDING LIFE CYCLE ANALYSIS - Andy McNa...Andy McNamara
 
CONCORDIA UNIVERSITY 
FACULTY OF ENGINEERING AND COMPUTER SC.docx
CONCORDIA UNIVERSITY 
FACULTY OF ENGINEERING AND COMPUTER SC.docxCONCORDIA UNIVERSITY 
FACULTY OF ENGINEERING AND COMPUTER SC.docx
CONCORDIA UNIVERSITY 
FACULTY OF ENGINEERING AND COMPUTER SC.docxmaxinesmith73660
 
SEM 4 : PROJECT 1 BRIEF BUILDING SERVICES
SEM 4 : PROJECT 1 BRIEF BUILDING SERVICESSEM 4 : PROJECT 1 BRIEF BUILDING SERVICES
SEM 4 : PROJECT 1 BRIEF BUILDING SERVICESDarshiini Vig
 
1 IA Swinburne Faculty of Engineering, Science and Techn.docx
1 IA Swinburne Faculty of Engineering, Science and Techn.docx1 IA Swinburne Faculty of Engineering, Science and Techn.docx
1 IA Swinburne Faculty of Engineering, Science and Techn.docxjeremylockett77
 
Project 2 integration
Project 2  integrationProject 2  integration
Project 2 integrationPreston Liew
 
Project 2 integration (1)
Project 2  integration (1)Project 2  integration (1)
Project 2 integration (1)Anthony Chew
 
Project 2 brief b services aug 2015
Project 2 brief b services aug 2015Project 2 brief b services aug 2015
Project 2 brief b services aug 2015Preston Liew
 
Project 2 brief b services aug 2015
Project 2 brief b services aug 2015Project 2 brief b services aug 2015
Project 2 brief b services aug 2015Anthony Chew
 
Assignment Brief 2019S
Assignment Brief 2019SAssignment Brief 2019S
Assignment Brief 2019SSusan Campos
 
SEM 6 : BTECH 2 PROJECT 1
SEM 6 : BTECH 2 PROJECT 1SEM 6 : BTECH 2 PROJECT 1
SEM 6 : BTECH 2 PROJECT 1Darshiini Vig
 
Bsci project 1-brief
Bsci project 1-briefBsci project 1-brief
Bsci project 1-briefPreston Liew
 
AET 3253 Energy TechnologyFinal ProjectObjective To create.docx
AET 3253 Energy TechnologyFinal ProjectObjective To create.docxAET 3253 Energy TechnologyFinal ProjectObjective To create.docx
AET 3253 Energy TechnologyFinal ProjectObjective To create.docxnettletondevon
 
Project 2 design process research & analysis mac 2015
Project 2 design process research & analysis mac 2015Project 2 design process research & analysis mac 2015
Project 2 design process research & analysis mac 2015ALISON TANG
 
Clproject2designprocessresearchanalysismac2015 150719124630-lva1-app6892
Clproject2designprocessresearchanalysismac2015 150719124630-lva1-app6892Clproject2designprocessresearchanalysismac2015 150719124630-lva1-app6892
Clproject2designprocessresearchanalysismac2015 150719124630-lva1-app6892Sheng Zhe
 
Project 2 design process research & analysis mac 2015
Project 2 design process research & analysis mac 2015Project 2 design process research & analysis mac 2015
Project 2 design process research & analysis mac 2015Joeylau97
 
Project 2 design process research & analysis mac 2015 (2)
Project 2 design process research & analysis mac 2015 (2)Project 2 design process research & analysis mac 2015 (2)
Project 2 design process research & analysis mac 2015 (2)brandonliaw97
 
Project 2 design process research & analysis mac 2015
Project 2 design process research & analysis mac 2015Project 2 design process research & analysis mac 2015
Project 2 design process research & analysis mac 2015apongmalik
 
Project 2 brief design process research & analysis mac 2015
Project 2 brief design process research & analysis mac 2015Project 2 brief design process research & analysis mac 2015
Project 2 brief design process research & analysis mac 2015Dana Kan
 

Similar a Into engergy efficient design (20)

A METHODOLOGICAL APPROACH TO SUPPORT BUILDING LIFE CYCLE ANALYSIS - Andy McNa...
A METHODOLOGICAL APPROACH TO SUPPORT BUILDING LIFE CYCLE ANALYSIS - Andy McNa...A METHODOLOGICAL APPROACH TO SUPPORT BUILDING LIFE CYCLE ANALYSIS - Andy McNa...
A METHODOLOGICAL APPROACH TO SUPPORT BUILDING LIFE CYCLE ANALYSIS - Andy McNa...
 
CONCORDIA UNIVERSITY 
FACULTY OF ENGINEERING AND COMPUTER SC.docx
CONCORDIA UNIVERSITY 
FACULTY OF ENGINEERING AND COMPUTER SC.docxCONCORDIA UNIVERSITY 
FACULTY OF ENGINEERING AND COMPUTER SC.docx
CONCORDIA UNIVERSITY 
FACULTY OF ENGINEERING AND COMPUTER SC.docx
 
SEM 4 : PROJECT 1 BRIEF BUILDING SERVICES
SEM 4 : PROJECT 1 BRIEF BUILDING SERVICESSEM 4 : PROJECT 1 BRIEF BUILDING SERVICES
SEM 4 : PROJECT 1 BRIEF BUILDING SERVICES
 
1 IA Swinburne Faculty of Engineering, Science and Techn.docx
1 IA Swinburne Faculty of Engineering, Science and Techn.docx1 IA Swinburne Faculty of Engineering, Science and Techn.docx
1 IA Swinburne Faculty of Engineering, Science and Techn.docx
 
Project 2 integration
Project 2  integrationProject 2  integration
Project 2 integration
 
Project 2 integration (1)
Project 2  integration (1)Project 2  integration (1)
Project 2 integration (1)
 
Project 2 brief b services aug 2015
Project 2 brief b services aug 2015Project 2 brief b services aug 2015
Project 2 brief b services aug 2015
 
Project 2 brief b services aug 2015
Project 2 brief b services aug 2015Project 2 brief b services aug 2015
Project 2 brief b services aug 2015
 
Assignment Brief 2019S
Assignment Brief 2019SAssignment Brief 2019S
Assignment Brief 2019S
 
SEM 6 : BTECH 2 PROJECT 1
SEM 6 : BTECH 2 PROJECT 1SEM 6 : BTECH 2 PROJECT 1
SEM 6 : BTECH 2 PROJECT 1
 
Bsci project 1-brief
Bsci project 1-briefBsci project 1-brief
Bsci project 1-brief
 
AET 3253 Energy TechnologyFinal ProjectObjective To create.docx
AET 3253 Energy TechnologyFinal ProjectObjective To create.docxAET 3253 Energy TechnologyFinal ProjectObjective To create.docx
AET 3253 Energy TechnologyFinal ProjectObjective To create.docx
 
Attachment
AttachmentAttachment
Attachment
 
01.IED
01.IED01.IED
01.IED
 
Project 2 design process research & analysis mac 2015
Project 2 design process research & analysis mac 2015Project 2 design process research & analysis mac 2015
Project 2 design process research & analysis mac 2015
 
Clproject2designprocessresearchanalysismac2015 150719124630-lva1-app6892
Clproject2designprocessresearchanalysismac2015 150719124630-lva1-app6892Clproject2designprocessresearchanalysismac2015 150719124630-lva1-app6892
Clproject2designprocessresearchanalysismac2015 150719124630-lva1-app6892
 
Project 2 design process research & analysis mac 2015
Project 2 design process research & analysis mac 2015Project 2 design process research & analysis mac 2015
Project 2 design process research & analysis mac 2015
 
Project 2 design process research & analysis mac 2015 (2)
Project 2 design process research & analysis mac 2015 (2)Project 2 design process research & analysis mac 2015 (2)
Project 2 design process research & analysis mac 2015 (2)
 
Project 2 design process research & analysis mac 2015
Project 2 design process research & analysis mac 2015Project 2 design process research & analysis mac 2015
Project 2 design process research & analysis mac 2015
 
Project 2 brief design process research & analysis mac 2015
Project 2 brief design process research & analysis mac 2015Project 2 brief design process research & analysis mac 2015
Project 2 brief design process research & analysis mac 2015
 

Más de harrietmaybe

Más de harrietmaybe (8)

Recording studio breif
Recording studio breifRecording studio breif
Recording studio breif
 
Winery design
Winery designWinery design
Winery design
 
Project doc
Project docProject doc
Project doc
 
Measured drawing section
Measured drawing sectionMeasured drawing section
Measured drawing section
 
Domus brief
Domus briefDomus brief
Domus brief
 
Tectonic design brief
Tectonic design briefTectonic design brief
Tectonic design brief
 
Minima Brief
Minima BriefMinima Brief
Minima Brief
 
Peepshow Brief
Peepshow BriefPeepshow Brief
Peepshow Brief
 

Into engergy efficient design

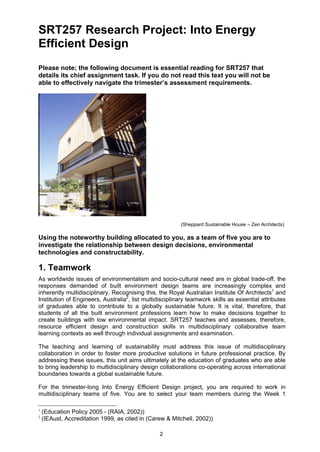
  • 1. 2 SRT257 Research Project: Into Energy Efficient Design Please note; the following document is essential reading for SRT257 that details its chief assignment task. If you do not read this text you will not be able to effectively navigate the trimester’s assessment requirements. (Sheppard Sustainable House – Zen Architects) Using the noteworthy building allocated to you, as a team of five you are to investigate the relationship between design decisions, environmental technologies and constructability. 1. Teamwork As worldwide issues of environmentalism and socio-cultural need are in global trade-off, the responses demanded of built environment design teams are increasingly complex and inherently multidisciplinary. Recognising this, the Royal Australian Institute Of Architects1 and Institution of Engineers, Australia2 , list multidisciplinary teamwork skills as essential attributes of graduates able to contribute to a globally sustainable future. It is vital, therefore, that students of all the built environment professions learn how to make decisions together to create buildings with low environmental impact. SRT257 teaches and assesses, therefore, resource efficient design and construction skills in multidisciplinary collaborative team learning contexts as well through individual assignments and examination. The teaching and learning of sustainability must address this issue of multidisciplinary collaboration in order to foster more productive solutions in future professional practice. By addressing these issues, this unit aims ultimately at the education of graduates who are able to bring leadership to multidisciplinary design collaborations co-operating across international boundaries towards a global sustainable future. For the trimester-long Into Energy Efficient Design project, you are required to work in multidisciplinary teams of five. You are to select your team members during the Week 1 1 (Education Policy 2005 - (RAIA, 2002)) 2 (IEAust, Accreditation 1999, as cited in (Carew & Mitchell, 2002))
  • 2. 3 tutorial in the A&B Studio. All team members must be in the same tutorial group. There should be a mix of Construction Management and Architecture students in your group – such that there are two of one and three of the other (where double-degree students count as both). 2. Assessment The submission consists of two interim reports, one final report and assessed participation in the Knowledge Depositories (DSO team discussion threads). These are assessed as follows: 1. Interim Report 1 Team submission individually assessed and worth 12% of unit marks; 2. Interim Report 2 Team submission individually assessed and worth 13% of unit marks; 3. Final Report Team grade individualised by self-and peer-assessment (SAPA – with instruction on DSO). The final report is worth 20% of the unit marks; 4. Participation in team discussion thread – 5%. N.B. Interim Report 2 should include Interim Report 1, and the Final Report should include both interim reports. 3. Into Energy Efficient Design Reports (From Group 7B redesign of Sean Godsell’s St. Andrew’s Beach House) 1. Report 1 Each team member is responsible for the initial investigation of one of the five tasks listed in section 4.1 (Construction and Climate). This will require each team-mate to make an outline assessment of the existing performance of the architecture with respect to its construction and site, and show graphically how you have measured and evaluated this performance – (presented in Interim Report 1 – Construction and Climate). You will each need, therefore, to draw the parts of the building relating to the component you are using as the basis for your study. These drawings must be precise, and consist at least of a reworking in your hand of the plans, sections and elevations supplied. Report 1 is to be submitted digitally to DSO by midnight on Wednesday August 5th AND in paper format by 3pm to the Student Hub (or red drop- boxes) on Friday August 7th . 2. Report 2 Having analysed the climate of the site and the construction materials of the house, you are now in a position to measure the thermal performance of the house – (presented in Interim Report 2 - Measure). Each team member is responsible for the initial investigation of one of the five tasks listed in section 4.2 (Measure). Report 2
  • 3. 4 (bound together with Report 1) is to be submitted digitally to DSO by midnight on Wednesday September 2nd AND in paper format by 3pm to the Student Hub (or red drop-boxes) on Friday September 4th . 3. Report 3 With the thermal performance data from Report 2 you are then as a group to work in collaboration to re-design the house to make improvements to its environmental performance and to quantify and illustrate these changes. You should clearly present in the Final Report (3 - “Redisign and Re-measure”) the effects of these changes by drawing AND modelling the optimal way of integrating the improvements into the scheme. These subsequent drawings may be overlays of your initial investigation drawings or new drawings, and must illustrate the improvement to the building’s performance. The pros and cons of your changes must measured using the analysis tools you used for Report 2 and should also be costed. In this collaborative stage Architecture students may (or may not) play a greater role in drawing while Construction Management students may play a greater role in costing, tabulations, justifying changes with calculations etc. All Final Report submissions are to be bound (together with Reports 1 and 2) and submitted by 4pm to the Student Hub on or before 4pm Wednesday 23rd October. All Final Report submissions are to be submitted digitally to DSO on or before 6pm Wednesday 23rd October. 4. Submission All drawings are to be printed at A3 landscape format. All drawings are to be at an appropriate scale so that A3 drawings can be interpreted at a distance of 2 meters. All drawings must be consistently titled and authorship identified. Supporting written photographic and graphic material to be in A3 format bound with the total Report set (again with authorship clearly noted). All Final Report submissions are to be bound and submitted by 4pm to the Student Hub on or before Wednesday 23rd October. All standard submission protocols apply. All groups are to hold at least one full copy of their submission for their own reference. Each report must be submitted in paper format and digital format (as a PDF submitted via DSO). 4.1 Report 1 – “Construction and Climate” In the first report, you are asked to present, using the tools explained in the lectures, an analysis of the climatic conditions of the site of your house and an analysis too of the materials used to build your house. There are five components to this analysis that should be used to inform the individualisation of tasks within your team. You will receive individual marks for this first part of the report and you therefore must clearly label each page of the report. The report should be divided into 4 sections; each will present one of the following analyses; 1. Shadow diagrams, time-temperature chart and sun angle calculations to demonstrate appropriate shading. (Tasks 1a and 1b). 2. Ecotect climate report and psychometric chart. (Task 2) 3. Water usage and supply report. (Task 3) 4. Materiality/thermal mass model. Model to be photographed for annotated report. 2- person task.
  • 4. 5 (i) Model indicating existing interior thermal mass and construction materials of external envelope. (Task 4) (ii) Annotated report explaining and analysing the model. (Task 5) Report 1 is to be submitted digitally to DSO by midnight on Wednesday August 5th AND in paper format by 3pm to the Student Hub (or red drop-boxes) on Friday August 7th . A detailed explanation of the tasks required for Report 1 is included as Appendix 1 at the end of this assignment description. 4.2 Report 2 – “Measure” In the second report, you are asked to present an analysis of the thermal performance of your house using the tools explained in the lectures. There are five components to this measuring process that should be used to inform the individualisation of tasks within your team. You will receive individual marks for this second interim report and you must therefore clearly label each page of the report. The report should be divided into 5 sections; each will present one of the following analyses; 1. Heat loss calculations. 2. Cooling calculations. 3. First Rate analysis 4. Fluid Mapping 5. Oppenheim thermal mass analysis If any member of your team is confident using Ecotect you may choose to submit in addition to the above a shading and thermal performance analysis using the software. The Heat Loss and Heat Gain calculations might then be combined as one task. Report 2 (bound together with Report 1) is to be submitted digitally to DSO by midnight on Wednesday September 2nd AND in paper format by 3pm to the Student Hub (or red drop- boxes) on Friday September 4th . A detailed explanation of the tasks required for Report 2 is included as Appendix 2 at the end of this assignment description. 4.3 Final Report – “Redesign and Re-measure” In the Final Report, you are to present a team re-design of your Into Design House that makes improvements to its environmental performance. You are to quantify these design changes using the measurement tools you used in Report 2 and illustrate the changes graphically and using models (a “before” and “after” model of the house is by far the most effective way of communicating your proposed changes). You will find that you will be unable to optimise the energy efficiency of your house with respect to ALL improvements suggested by the first two stages. Instead, you will need to reach a compromise – a design balance between cost and constructability and; good thermal insulation and thermal mass, effective passive heating and cooling, water collection and usage, and adequate shading. This balance will also need to take into account the designer’s original aesthetic intent. Here, you must reflect upon how your proposals may have impacted on the constructability of the building and on the designer’s original architectural intentions. You should clearly present in the Final Report the effects of these changes by drawing the optimal way of integrating the changes into the scheme. These subsequent drawings may be overlays of your initial investigation drawings or new drawings, and must illustrate the
  • 5. 6 improvement to the building’s performance. For each of the changes there should also be a short description of the pros and cons of the changes - which must be costed and quantified as a percentage improvement. In the integration of the changes, you have studied the essential confluence of design ideas and this integration of technologies must be displayed and discussed. The final submission should be a single group presentation, but the component that each member has chosen to focus on should be clearly identifiable in the labelling of your work. This project (i.e. all three reports) is worth 50% of the marks for this unit and so it should represent about 10 week’s effort and therefore constitute about 70 hours work for each team member. The project will certainly be assessed as such. All Final Report submissions are to be bound (together with Reports 1 and 2) and submitted by 4pm to the Student Hub on or before 4pm Wednesday 23rd October. All Final Report submissions are to be submitted digitally to DSO on or before 6pm Wednesday 23rd October. Make sure all work is referenced from the original source using standard academic referencing systems. N.B. In your Final Report please avoid if possible “cut-and-pasting” technological solutions from web sites. You will receive no credit for this. Instead, illustrate (or model) these solutions in-situ – i.e. show them used in/on your house. 5. Summary of Project Aims • To study energy efficient design strategies in a small-scale domestic or semi- domestic building in Victoria. • To introduce the study of energy efficient buildings in terms of integrated systems. • To provide an opportunity for collaboration between architecture and construction management students. 6. Final Group Design Review Groups must prepare an oral presentation of their final reports to communicate the outcome of the group's research coherently and in a unified way. Marks will be deducted for apparently disjointed presentations and those that communicate the outcome of research poorly. It will be obvious where the team has not considered construction and design holistically. Work together as a team. You will present to a review panel consisting of your tutors and lecturers, guest experts AND the architect of the house you have redesigned. You will present in front of the drawings you have made for your final report and hence these drawings must clearly communicate your work graphically. A “before” and “after” model of your house is a very effective way of quickly communicating your redesign to a review panel. N.B. The majority of the assessment of your final Report will be made at this review. 7.1 Late Submission Late submissions will be deducted 10% per day for a maximum of three days after which they will not be accepted.
  • 6. 7 Presentation of Into Design Projects will take place during the last two tutorial days of trimester. It is possible that you will be asked to present at a time that differs from your usual tutorial time. 7.2 Assessment Criteria Depth and accuracy of drawings presenting your research into integrated energy efficient design strategies. Effectiveness of group presentation in conveying research and development in a well presented form. Teamwork and individual work For teams where one or more members withdraw from the unit or does not complete the project, assessment will be undertaken from the remainder of the group. Please inform the Unit Chair or Tutor if you have any problems. 7.3 Fair Assessment of Team-members Contribution Team/Individual assessment - In order to make sure that each individual within a team receives a grade that reflects their contribution to the project we will be using an on-line self- and-peer-continuous-assessment (SAPCA) tool that has been developed over the course of the last three years. Every week, each team-member must log in to the SAPCA to rate the contribution of themselves and their teammates. This register uses two quantitative measures and one qualitative measure. The first measure asks you to award yourself and your peers a percentage of a team grade. This first measure is backed up by a second that asks you to rate one another on a five-point multiple-response Likert scale. Self-assessment in this process has been shown to encourage learners to take responsibility for their own learning through the making of reflective judgments. The further purpose of the third qualitative measure, which asks you to comment on your own performance and that of your peers, is to elucidate anomalies or unexpected final evaluations. At the end of the project, an assessment matrix will be generated that awards each team member a multiplier of a final team grade that had been assessed by the unit coordinator, tutors and moderators. As the SAPCA is an integral part of team-working process, for each week that you fail to log in to SAPCA and satisfactorily fill in each of the three measures (the process takes only about 5-10 minutes), 2 marks will be deducted from your individualised project grade. When you fail to complete the register, it defaults to award everyone in the team an equal share of the marks. The register will be open each week from Thursday morning to midnight on Monday. Eighty-five percent of students in 2006 were awarded multipliers within the range of 0.85 – 1.15, for the only students heavily penalised were those who were consistently rated by all their team-mates as under- performing. The assessment register will be demonstrated in the lecture introducing the Into Energy Efficient Design project. Full instructions for its use can be found on the SRT257 contents page of DSO. 8. Submission tips • Please check your spelling and grammar. These are formal submissions and we expect you to proof your own work (e.g. please ensure that the personal pronoun ‘I’ is always a capital letter and that all sentences begin with a capital letter). All reports should be bound, as stated in the assignment guide, and your name should be clearly marked on your work – these are simple requirements. • If In order to obtain higher marks than a Pass or Credit you need to achieve beyond what is asked for by show initiative, innovation, imagination and a capacity to direct your own learning. • Please make sure that you correctly reference all material. It is expected that the
  • 7. 8 majority of the information you will provide will be sourced from elsewhere, so please acknowledge those cources in a scholarly fashion. • If you would like feedback, please do not submit reports on a black background or in plastic pockets. • At the end of the description of what is required for each task there is a brief summary of what an HD submission might contain (if done well). • In the Course Contents folder of DSO there is a file containing exemplary examples of past student work towards each of the 10 tasks. Your marker will use these exemplars as benchmarks and so DO NOT BE TEMPTED TO PLAGIARISE these documents. • Many people in previous years have left it quite late to start working on their Report submissions. It is far easier to make the best of limited teaching resources if you commence the assignments early. That way you have much more opportunity to ask questions - especially in tutorials. Two tutors (who are architects well experienced in the field of Sustainable Design) available for an hour each week represents an excellent resource that many students do not take advantage of. 8. Web sites 1. Buildings Greening of the White House http://solstice.crest.org/environment/gotwh/index.html http://www.caddet-ee.org Solar products Solahart http://www.solarhart.com.au/index.html Solahart Industries was established in 1905, and introduced its first solar hot water heater in 1953. BP Solar http://www.bpsolar.com BP Solar is one of the worlds largest solar energy companies. They make photovoltaic panels. 2. Journals Environmental Building News http://www.ebuild.com The electronic version of this excellent USA magazine that has articles, reviews and news stories on energy efficiency and healthy building practices. 3. Organisations Sustainable Energy Authority of Victoria http://www.seav.vic.gov.au The Victorian Government body that has a very good web site with the following topics: about us; awards; building; business; energy smart advice; links; products; news; renewable energy; schools; services; State and Local Government The International Energy Agency http://www.iea.com The Australian Greenhouse Office http://www.greenhouse.gov.au 4. Weather data International weather data http://www.weatherpost.com/lomgterm/historical/data
  • 8. 9 Weather data for 2000 sites around the world Australian Bureau of Meteorology http://www.bom.gov.au Detailed weather data for most locations in Australia 5. Links to other sites The International Energy Agency Greentie directory http://www.greentie.org
  • 9. 10 APPENDIX 1 Interim Report 1 - Task 1.1 Solar movement, solar access and shading Final Submission Group 2.1 - 2007 Your first task 1. Solar Access Your task is to prepare shadow diagrams for your Into Energy Efficient Design house. Show the shadows created at 11 a.m., 1 p.m. and 3 p.m. on June 22; (i) by the house (i.e. externally) - to demonstrate Solar Access, and (ii) in the house by the sunlight through windows. You must take into consideration whether the site is flat or sloped. Before you begin, copy by hand the ground floor plan of your house at a scale that will allow you to show the shadow diagram on an A3. Photocopy the blank plan four times, so that you can draw the two plans required in this assignment and still have two plans free to use in case you make mistakes. On drawing no. 1, draw the shadow diagrams for the three times stated - showing the shadows created in the house and on the ground to the south of the house. Calculate the open space (inside and outside the house) that is in full sunshine at each of these three times, and note them as percentages of; (i) the internal floor area, and (ii) the whole outside plot area.
  • 10. 11 On drawing no. 2, repeat the exercise for each of the three times and show the space that is in full sunshine at one metre above ground level, and again note them as percentages of the respective areas. One way to think of this is to imagine that the plot and house has been filled with concrete up to a depth of one metre and this has now become the new ground level. Authorities are interested in this level since this is where human activity takes place outside (such as on table tops). This analysis might also demonstrate where thermal mass work-surfaces can take advantage of solar gain. From the above analyses, suggest how the house might make better use of sunlight. 2. Sizing Shading using Time/Temperature Charts How do you come to grips with the thermal considerations of a site when you are given a project in an unfamiliar location with an unfamiliar climate? What are the issues you need to deal with? What are the preferred building materials? How big should the eaves be? Should you flood the building with light and heat, or shut it up year round? Your second task (1) Using weather data for your Into Energy Efficient Design house, which you will find at Australian Bureau of Meteorology web site (http://www.bom.gov.au), prepare a psychometric chart for the site of your house. At the base of the sheet, or on another sheet of paper, explain the following points: the climate type you think it is; the building typology required for this climate; your recommendations for building mass; the appropriate heating and cooling techniques for the site. (2) Using the data you have found, complete a time-temperature chart for the location of your Into Energy Efficient Design house. You need not plot the 86% and 14% lines, nor the mean daily minimum temperatures. Calculate the two shading angles at Points “A” and “B”. Note that the time temperature chart and the psychometric chart can be completed independently of each other. Select the appropriate fixed shading angle (not adjustable) for the equatorial facing façade of the house. Calculate the length of horizontal eaves coming out from the head of the equatorial facing windows. Discuss in about 300 words this eaves length, the variations that are possible, how they compare to the design as it stands, and how you might redesign the house to shade it appropriately. Discuss, too, what type of shading, if any, might improve the environment of the rooms facing east and west. N.B. In this discussion, use graphic information (i.e. diagrams etc.) as much as possible to communicate your recommendations. You will be assessed as much on the effectiveness of your graphic communication of information as on the quality of the information. Feedback from previous years on what an HD submission for this task might include: • Accurate shadow diagrams, showing percentages of internal floor areas and whole outside plot areas, • Shadows for ALL three time increments 1m above ground and on ground, with some explanation of differences, • Suggestions of how your house could make better use of sunlight, • Psychrometric charts – accurate and drawn by hand, • Time temperature charts – accurate and drawn by hand, • Explain what these diagrams mean,
  • 11. 12 • Calculate the required eaves WITH DIAGRAMS and cross sections of wall and eaves. Different design solutions for eaves, • Clear presentation with diagrams rather than paragraphs of writing if possible, • Demonstration of an understanding of how these concepts can be applied to the redesign your house. Resources A full explanation of how to complete tasks 1a and 1b above can be found in the Solar Movement lecture notes and in the Analysing Climate lecture notes.
  • 12. 13 Data for Analysis Blank psychrometric charts. Firstly, photocopy this page so that you will have a spare in case you make a mistake while doing the first attempt. Data for Analysis Below is a blank time temperature chart. Firstly, photocopy this page so that you will have a spare in case you make a mistake while doing the first attempt. Use the chart for the location of your Into Energy Efficient Design house.
  • 13. 14
  • 14. 15 Interim Report 1 - Task 1.2 Ecotect Climate Analysis Ecotect is a comprehensive architectural and environmental design program that includes modules for analysing weather data, solar shading, thermal performance, lighting, and acoustics. SolarTool and WeatherTool can be downloaded as stand alone programs for specific sun and weather analyses. All three are available from Square One Research at Cardiff University <http://www.squ1.com/>. SolarTool and WeatherTool can be used as free shareware for educational purposes. Ecotect is also installed on the computer lab PCs. Your task For Report 1, you are to use Ecotect to: (1) Illustrate complete weather data (wind, rain and sun) for the site of your Into Design House. (2) Construct a basic computer model of your house that will enable you to include sun path and shading diagrams. You might even consider internal lighting levels. (3) Inform the following points: the climate type you think the location is; the building typology required for this climate; your recommendations for building mass; the appropriate heating and cooling techniques for the site. (4) Inform how these recommendations might be incorporated into the design of the house. These findings will be used to inform your group’s redesign of the house as depicted in Report 3. N.B. In this discussion, use graphic information (i.e. diagrams etc.) as much as possible to communicate your recommendations. You will be assessed as much on the effectiveness of your graphic communication of information as on the quality of the information. Feedback from previous years on what an HD submission for this task might include: • Temperature profiles • Wind wheels • Diurnal range profile • Rainfall • Time Temp charts • Psychometrics • Rainfall • Internal and external shadow diagrams
  • 15. 16 Of course, all of this information is quite easily generated once you have the correct data set and a block model of the house (with openings), so the report was also to include; 1. Conclusions on what the ideal house typology is for the site (orientation, form, construction type (lightweight, heavyweight), thermal mass, fenestration and shading. 2. Recommendations on what improvements could be made to YOUR HOUSE (not generic recommendations) based on your findings (and illustrated with simple diagrams). The most common shortfall is for students to complete the analyses but fail to apply the findings to their house. Some students have difficulties importing DFX models into Ecotect. This can be sensibly solved by building simplified block models in Ecotect. Resources Extensive help file and tutorials provided within the software.
  • 16. 17 Interim Report 1 - Task 1.3 Water usage and supply report Your task 1. Find out the average rainfall for the specific site of your Into Design House – using climatic data from the nearest weather station which you will find at Australian Bureau of Meteorology web site (http://www.bom.gov.au). 2. Illustrate how much water you might expect to collect from the roof of your Into Design House and any of its related roofs. 3. Determine the water usage you might expect for your Into Design House – assuming four occupants (unless the house is clearly designed for a different number of people). 4. Discuss the relationship between usage and supply and how you might redress and shortfall – i.e. how you might reduce usage or increase collection. 5. Design the water storage taking into account the following – (i) the volume of water you are collecting as informed by steps 1 to 4 above, (ii) the relationship between the rate of collection and the rate of use, and (iii) the available volume for storage and its location. In this discussion, indicate and illustrate where on the property you feel this storage might best be accommodated. N.B. In this discussion, use graphic information (i.e. diagrams etc.) as much as possible to communicate your recommendations. You will be assessed as much on the effectiveness of your graphic communication of information as on the quality of the information. Feedback from previous years on what an HD submission for this task might include: • Demonstration of a balance between specific knowledge for the house and broader water supply issues; • Clear and well illustrated presentation;
  • 17. 18 • Clearly outlined assumption and findings; • Good understanding of occupancy behaviour and how occupants can cut water use; • Thoughtful design response considering at least the following; • Options; • Costs; • Brands; • Location of tanks. Resources Use the Water Cycle lecture notes and http://www.greenhouse.gov.au.
  • 18. 19 Interim Report 1 - Task 1.4 Materiality/thermal mass model Your task (1) Build a model of your Into Design House (2) Annotate a report Task 4 requires two people to build a physical model of your Into Design House and to compile an annotated report explaining the model. You can divide the work for task 4 as you wish, but you must make clear who was responsible for what. 1. The Model The model will illustrate: (1) The different materials that comprise the external envelope of your house. (2) The house’s interior thermal mass. The model is an abstraction of your house, not a replica of it. Therefore, you need only indicate different materials, not replicate them. For example, if your house has a grass roof – use, perhaps, green card to show this but do not try to replicate grass by using a grass-like material. The roof of the model should be removable so that you can indicate interior thermal mass. Thermal mass is such dense heavyweight materials as concrete slab floors and brick walls. Thermal mass needs to be inside the insulation overcoat that is wrapped around the building to be effective. Thus, thermally massive materials that are uninsulated and exposed to outside air do not count as thermal mass. Materials that are not considered heavyweight include timber, insulation, plasterboard / gypsum, etc. 2. Annotated Report After building the model, use PhotoShop or a similar tool to annotate and render photographs of your model to indicate: (i) The different materials of the external envelope. (ii) Which materials are thermal mass.
  • 19. 20 In your report, indicate the area (in metres squared) of (i) each different material of the external envelope and of, (ii) thermal mass. Thermal mass (for these calculations only) is taken to be 100 mm deep. If an internal wall is 200 mm thick and exposed to room air on both sides, both surface areas can be counted for thermal mass surface area. If the wall is only 100 mm thick and exposed to air on both sides, only one side can be counted. Thermal mass that is uninsulated and exposed to outside air does not count as thermal mass in these calculations. Thus an external veneer of masonry outside the insulation layer in a brick veneer construction does not count as thermal mass. You will also need to report on how “green” you think each material is taking into account, say: (i) Whether it was made from a renewable source (ii) The embodied energy it took to make it compared to its predicted life-span (iii) How recyclable it is and/or whether it could be substituted by a recycled material. In the report (Report 1), clearly indicate which person was responsible for which of the above tasks. N.B. In this discussion, use graphic information (i.e. diagrams etc.) as much as possible to communicate your recommendations. You will be assessed as much on the effectiveness of your graphic communication of information as on the quality of the information. Feedback from previous years on what an HD submission for this task might include: • Photographs showing - an accurate and well made model; • Photographs showing - a model that clearly indicated the components of the external envelope that had different heat transfer properties; • Photographs showing - a model that clearly indicated thermal mass and where this was in relation to the insulation blanket; • Clearly labelled photographs that highlighted the elements being identified; • Areas in square metres of the different external envelope materials and of thermal mass indicated using diagrams of the house; • Embodied Energy analysis illustrated using diagrams; • Embodied Water analysis illustrated using diagrams; • Conclusions on the house’s performance with regards to thermal mass, EE and EW and recommendations for improvements based on these conclusions.
  • 20. 21 APPENDIX 2 Interim Report 2 - Task 2.1 Heat loss calculations Before you begin the calculation, you must find out the area of all the different materials that comprise the external envelope. These should have been recorded in section 4 of interim Report 1. You will also need to find out the u-values of all these materials. You can find these values out from the table below. If your material is not listed, use that material that is the closest to it in terms of its thermal properties – or you might find out u or r-values from manufacturers data (available via the internet). Outline assumptions for the house • Assume 0.5 air changes /hour • Gas heater is 70% efficient, electric heater 100% • Indoor design temperature is 21 0 C Your task (1) Calculate the peak heat loss rate, the steady heat loss rate and the annual space- heating load assuming the windows are single glazed. (2) When you have finished this, redo the calculation with all the windows being double- glazed. Double glazed windows will reduce the heat loss and even though cost more, they will result in lower operating costs. Discuss the implications of your findings for the redesign of your Into Design house. Resources A full explanation of how to complete task can be found in the Heat Loss lecture notes. Use also the tables provided at the end of the explanation of task 2 below. Feedback from previous years on what an HD submission for this task might include: • had diagrams showing location / size of different materials • identified areas of greater heat loss • explored heat loss calculations for different energy saving options • analysed space heating costs for single vs double glazing • analysed reduction in Co2 emissions • analysed payback period • provided a discuss on the above results • clear, concise presentation • suggestions for reducing heat loss • explained how u values were derived Common errors / omissions: • no source provided for figures used • difficult to follow format • not showing full workings for both single and double glazed options
  • 21. 22 Interim Report 2 - Task 2.2 Cooling calculations Before you begin the calculation, you must find out the area of all the different materials that comprise the external envelope. These should have been recorded in section 4 of interim Report 1. You will also need to find out the u-values of all these materials. You can find these values out from the table below. If your material is not listed, use that material that is the closest to it in terms of its thermal properties – or you might find out u or r-values from manufacturers data (available via the internet). All of this information is required for task 2.1, so you should co-ordinate your efforts with the person in your team responsible for that task. Note that an awning is a device that provides outdoor shading. Inside shading refers to a blind (or in our language "a shade" that can be pulled down to block direct sunlight on the inside of the glass. You are asked to do two calculations. One where there is no impediment to the sun coming into the building (use values from Table 2 marked "no awnings or inside shade") and another calculation with all the windows shaded (use values from Table 2 marked "Awnings"). Outline assumptions for the house • Assume 0.5 air changes /hour • Internal temperature 25.7 0 C and outside design temperature of 35 0 C • Temperature range is 12 0 C • Four occupants, one kitchen Your task (1) For your Into Design House, assuming there is no awnings, overhangs, trees, etc. to shade the windows, calculate the peak cooling load. (2) When you have finished this, redo the calculation with all the windows appropriately shaded and obtain the new peak cooling load. Discuss the implications of your findings for the redesign of your Into Design house. Resources A full explanation of how to complete task can be found in the Cooling calculations lecture notes. Use also the tables provided below. Feedback from previous years on what an HD submission for this task might include: • Detailed exploration of alternatives, ie. Double glazing, shaded, un-shaded, shaded with double glazing etc. How the results may be implemented in the future redesign; • A description and understanding of what the implications of different options are. Cost benefit versus performance. Payback periods; • Accurate calculations of u values for specific building components; • Suggestions with appropriate research; • Clear and readable layout. Common errors / omissions • Unclear and difficult format (it was as easy as to provide the original format for tables); • Spelling and general layout.
  • 22. 23 THERMAL RESISTANCE VALUES FOR VARIOUS MATERIALS - Page 1 (a) Thermal Resistance of Building Materials Building materials have a thermal resistance for a specified thickness. Refer to the AIRAH Design Manual, Section 3, Part 1, Heat Transfer Data for Building Components and Elements, Table 3.1 This resistance is called an R value and is measured in m2 0C / W. (The inverse of an R value is called a U-value and is measured in W/ m2 0 C). The Table below gives the resistance values for some typical building materials with typical thicknesses. WALL STRUCTURE R (m 2 C/W) GLASS AND WINDOWS R (m 2 C/W) Brick, 110 mm, 1760 kg/m3 0.086 Glass, float, 6 mm 0.006 Concrete, 100 mm, 2400 kg/m3 0.069 Timber framed window, single glazed * 0.19 Concrete, lightweight, 100 mm, 1900 kg/m3 0.15 " " " , double glazed * 0.36 Concrete block, hollow, 190 mm 0.19 Aluminium framed window, single glazing * 0.14 Concrete block, hollow, 90 mm 0.14 " " " , double glazed * 0.21 Adobe block, mud brick, 300 mm 0.24 PVC framed window, single glazed * 0.20 Plasterboard, 10 mm 0.059 " " " , double glazed * 0.33 Plasterboard, 13 mm 0.077 Cement render, 15 mm 0.03 INSULATION Cement render and plaster, 15 mm 0.03 Insulation, glass fibre blanket, 50 mm 1.16 Weatherboards, pine, 12 mm ave 0.086 Insulation, compressed straw, 50 mm 0.62 Fibre cement sheet, 6 mm 0.019 FLOORS Polystyrene, expanded, 25 mm 0.67 Particle board, 18 mm 0.17 Polystyrene, expanded, 50 mm 1.28 Timber flooring, hardwood, 19 mm 0.119 Polystyrene, foamed, aged, 50 mm 2.00 Concrete slab, 100 mm, 2400 kg/m3 0.069 Reflective foil laminate 0.00 Carpet and underlay, 30 mm 0.5 Concrete slab on ground (winter) 1.47 GENERAL ROOFS Ceramic wall tiles, 12 mm 0.011 Clay tiles, 19 mm 0.023 Timber, ash, 25 mm 0.16 Metal decking 0 Timber, pine, 25 mm 0.25 Bituminous roofing, 10 mm 0.061 Plywood, 5 mm 0.036 Table 3.1 Thermal resistance of building materials * These R values are for complete constructions including air films (b) Thermal Resistance of Air Films Air films have a thermal resistance depending on wind speed, orientation of the surface, direction of the heat flow, and emittance of the boundary surface (normal building materials have a high emittance). Refer to the AIRAH Design Manual, Section 3, Part 1, Heat Transfer Data for Building Components and Elements, Table 3.3. This Table is reproduced below. Location of air film and speed (wind speed in m/s) Position of surface Direction of heat flow High emittance surface (normal bldg materials) Resistance in m2.K/W Low emittance surface (shiny surfaces) Resistance in m2.K/W) Inside air film, or still Horizontal Up 0.11 0.23 (0 m/s) " Down 0.16 0.80 450 slope Up 0.11 0.24 " Down 0.13 0.39 22½0 slope Up 0.11 0.24 " Down 0.15 0.60 Vertical Horizontal 0.12 0.30 Inside gently moving air (0.5 m/s) Any position Any direction 0.08 0.08 Outside air film in winter (6 m/s) " " 0.03 0.03 Outside air film in summer (3 m/s) " " 0.04 0.04 Table 3.3 Thermal resistance of air films In winter only, for pitched tiled roofs with no layer of sarking installed, the outside surface of the composite construction is considered to be the upper surface of the ceiling lining or bulk insulation, with the surface resistance of the air film being considered that for still air (0 m/s). The thermal resistance of the roof space and tiles are ignored. In winter only, for pitched tiled roofs with a layer of sarking installed, the outside surface of the composite construction is considered to be the upper side of the foil, with the surface resistance of the air film being considered that for outside air ( ie 6 m/s). The thermal resistance of the air space and tiles above the foil laminate are ignored.
  • 23. 24 THERMAL RESISTANCE VALUES FOR VARIOUS MATERIALS - Page 2 (c) Thermal resistance of air spaces Air spaces have thermal resistances depending on the nature of the boundary surface, direction of heat flow, orientation of the surface, and the width of the air space. Refer to the AIRAH Design Manual, Section 3, Part 1, Heat Transfer Data for Building Components and Elements, Table 3.4. This Table is reproduced below. Nature of bounding surface Position of surface Direction of heat flow 20 mm width of air space: resistance in m2.K/W 100 mm width of air space: resistance in m2.K/W 2 high Horizontal Up 0.15 0.17 emittance surfaces " Down 0.15 0.17 (ie both normal 450 slope Up 0.17 0.17 bldg materials) " Down 0.15 0.16 Vertical Horizontal 0.15* 0.16 1 high & 1 low Horizontal Up 0.39 0.48 emittance surface " Down 0.57 1.42 (ie one normal bldg 450 slope Up 0.49 0.53 & one shiny surface) # " Down 0.57 0.77 Vertical Horizontal 0.58* 0.61 2 low Horizontal Up 0.41 0.51 emittance surfaces " Down 0.63 1.75 (ie both shiny 450 slope Up 0.52 0.56 surfaces) # " Down 0.62 0.85 Vertical Horizontal 0.62* 0.66 Table 3.4 Thermal resistance of air spaces * For vertical air spaces greater than 20 mm, with horizontal heat flow, the value of resistance for 100 mm should be used. # Note that for reflective foil that is blue one side and shiny the other, both sides are low emittance surfaces. (d) Thermal resistance of air spaces in roofs Air spaces in roofs have a thermal resistance depending on whether they are ventilated or unventilated, the direction of the heat flow, and the emittance of the surface. Refer to the AIRAH Design Manual, Section 3, Part 1, Heat Transfer Data for Building Components and Elements, Table 3.5. This table is reproduced below. Location of space Direction of heat flow High emittance surface (i.e. normal bldg materials) Resistance in m2.K/W Low emittance surface (i.e. shiny surfaces) Resistance in m2.K/W Ventilated roof space Up (ie winter) 0.0 0.34 Down (ie summer) 0.46 1.36 Non-ventilated roof space Up 0.18 0.56 Down 0.28 1.09 Table 3.5 Thermal resistance of pitched roof spaces
  • 24. 25 HEAT LOSS CALCULATION SHEET (1) BUILDING FABRIC LOSS Location Material Area (m2) U-value (W/m2/deg C) Temperature difference (deg C) Heat loss (W) Floor Walls Windows Roof/ceiling Total building fabric loss INFILTRATION LOSS Location Volume of space (m3) Air changes per hour Conversion factor Temperature difference (deg C) Heat loss (W) 0.36 Infiltration loss TOTAL HEAT LOSS (PEAK HEAT LOSS) (W) STEADY STATE HEAT LOSS RATE (Peak heat loss rate divided by temperature difference) (W/deg C) ANNUAL SPACE HEATING LOAD Heating degree days Conversio n factor for units Correction factors for occupancy Steady state heat loss rate (W/deg C) Annual space heating load (MJ) (if reqd in kWh divide answer by 3.6) 0.0864 ANNUAL SPACE HEATING LOAD
  • 25. 26 HEAT LOSS CALCULATION SHEET (2) BUILDING FABRIC LOSS Location Material Area (m2) U-value (W/m2/deg C) Temperature difference (deg C) Heat loss (W) Floor Walls Windows Roof/ceiling Total building fabric loss INFILTRATION LOSS Location Volume of space (m3) Air changes per hour Conversion factor Temperature difference (deg C) Heat loss (W) 0.36 Infiltration loss TOTAL HEAT LOSS (PEAK HEAT LOSS) (W) STEADY STATE HEAT LOSS RATE (Peak heat loss rate divided by temperature difference) (W/deg C) ANNUAL SPACE HEATING LOAD Heating degree days Conversio n factor for units Correction factors for occupancy Steady state heat loss rate (W/deg C) Annual space heating load (MJ) (if reqd in kWh divide answer by 3.6) 0.0864 ANNUAL SPACE HEATING LOAD
  • 26. 27 TABLES THAT SUPPLY INFORMATION FOR HEATING CALCULATIONS - Page 1 Table 1 - Outdoor design temperature for winter This Table is derived from AIRAH Design Data Manual, pp 1.4 - 1.7 Location Outside design temp for winter (deg C) Location Outside design temp for winter (deg C) Adelaide 6.5 Melbourne 4.5 Alice Springs 3.5 Newcastle 4.5 Ballarat -1.0 Perth 9.0 Brisbane 10.5 Port Hedland 15.0 Canberra 0.5 Sale 2.0 Darwin 18.5 Sydney 7.0 Hobart 3.0 Townsville 13.0 Kalgoorlie 5.5 Table 2 - Heating Degree Days for some Australian cities This table is derived from L.F. O'Brien, "Heating Degree Days for some Australian Cities", CSIRO, DBR Reprint No 506 Location Degree days (deg C) Location Degree days (deg C) Adelaide 1280 Melbourne 1500 Alice Springs 660 Newcastle 770 Brisbane 310 Perth 775 Canberra 2270 Port Hedland 42 Darwin 0 Sydney 720 Hobart 2300 Townsville 43 Kalgoorlie 1010 Table 3 - Correction factors for Occupancy This table is from A.B. Coldicutt et al "The Value of Insulation", Chartered Builder, Vol 18, Dec - March 1977. Structure Occupancy Factor* Hours of occupancy for 7 days per week ( ) show hours of occupancy 5 days a week with weekend shutdown 6 hours per day 12 hours per day 16 hours per day 24 hours per day Lightweight structure 0.50 (0.40) 0.75 (0.55) 0.85 (0.65) 1.0 (0.75) Medium structure 0.60 (0.55) 0.80 (0.60) 0.90 (0.68) 1.0 (0.75) Heavy structure 0.85 (0.65) 0.90 (0.68) 0.95 (0.72) 1.0 (0.75)
  • 27. 28 COOLING LOAD CALCULATION SHEET (1) The Table below is a simple sheet that can be used for cooling load calculations. QE COOLING LOAD CAUSED BY HEAT GAIN VIA BUILDING FABRIC Location Material Area (m2) U-value (W/m 2 /deg C) Equivalent Temp diff ( 0 C) (Table 1) Heat gain (W) Floor Walls – north west south east total Roof/ceiling Check that fabric gain is about ……. Total fabric heat gain Qg COOLING LOAD CAUSED BY HEAT GAIN VIA GLAZING Location Material Area (m2) Combined SHG+CHG (W) (Table 2) Heat gain (W) North West South East Roof Check that glazing gain is about ……. Total glazing heat gain Qv COOLING LOAD CAUSED BY INFILTRATION/VENTILATION GAIN Volume of space (m 3 )(V) Air changes per hour (N) Conversion factor Temperature diff (deg C) Heat loss (W) 0.36 Check that infiltration gain is about …… Total infiltr’n heat gain QE COOLING LOAD CAUSED BY HEAT GAIN VIA INTERNAL GAINS Items Number of items Heat output rate (Table 3) Heat gain (W) People Lights Equipment Check that ……. Total internal heat gain QC TOTAL COOLING LOAD Building fabric Glazing Infiltration Internal gains Total multiplied by 1.3 Heat gain (W) x 1.3 Check that total cooling load is ……. Total cooling load
  • 28. 29 COOLING LOAD CALCULATION SHEET (2) The Table below is a simple sheet that can be used for cooling load calculations. QE COOLING LOAD CAUSED BY HEAT GAIN VIA BUILDING FABRIC Location Material Area (m2) U-value (W/m 2 /deg C) Equivalent Temp diff ( 0 C) (Table 1) Heat gain (W) Floor Walls – north west south east total Roof/ceiling Check that fabric gain is about ……. Total fabric heat gain Qg COOLING LOAD CAUSED BY HEAT GAIN VIA GLAZING Location Material Area (m2) Combined SHG+CHG (W) (Table 2) Heat gain (W) North West South East Roof Check that glazing gain is about ……. Total glazing heat gain Qv COOLING LOAD CAUSED BY INFILTRATION/VENTILATION GAIN Volume of space (m 3 )(V) Air changes per hour (N) Conversion factor Temperature diff (deg C) Heat loss (W) 0.36 Check that infiltration gain is about …… Total infiltr’n heat gain QE COOLING LOAD CAUSED BY HEAT GAIN VIA INTERNAL GAINS Items Number of items Heat output rate (Table 3) Heat gain (W) People Lights Equipment Check that ……. Total internal heat gain QC TOTAL COOLING LOAD Building fabric Glazing Infiltration Internal gains Total multiplied by 1.3 Heat gain (W) x 1.3 Check that total cooling load is ……. Total cooling load
  • 29. 30 TABLES THAT SUPPLY INFORMATION FOR COOLING CALCULATIONS - Page 1 Table 1 – Equivalent Temperature Difference ( 0 C ) This Table is derived from ASHRAE Handbook of Fundamentals, p441, Table 50 Design Temperature 29 29 32 32 32 35 35 38 38 41 41 Daily temperature range L M L M H L M H M H H WALLS AND DOORS 1. Frame and veneer on frame 9.7 7.5 12.5 10.3 7.5 15.3 13.1 10.3 15.9 13.1 15.9 2. Masonry, 200 block or brick 5.7 3.5 8.5 6.3 3.5 11.3 9.0 6.3 11.8 9.0 11.8 3. Frame partitions 5.0 2.8 7.8 5.6 2.8 10.6 8.3 5.6 11.1 8.3 11.1 Masonry partitions 1.4 0.0 4.1 1.9 0.0 6.9 4.7 1.9 7.5 4.7 7.5 4. Wood doors 9.7 7.5 12.5 10.3 7.5 15.3 13.1 10.3 15.9 13.1 15.9 CEILINGS AND ROOFS 1. Under naturally vented attic or vented flat roof - dark 21.1 18.9 23.8 21.6 18.9 26.6 24.4 21.6 27.2 24.4 27.2 or vented flat roof - light 16.7 14.4 19.4 17.2 14.4 22.2 20.0 17.2 22.8 20.0 22.8 2. Built-up roof, no ceiling – dark 21.1 18.9 23.8 21.6 18.9 26.6 24.4 21.6 27.2 24.4 27.2 – light 16.7 14.4 19.4 17.2 14.4 22.2 20.0 17.2 22.8 20.0 22.8 3. Under unconditioned rooms 5.0 2.8 7.8 5.6 2.8 10.6 8.3 5.6 11.1 8.3 11.1 FLOORS 1. Over unconditioned rooms 5.0 2.8 7.8 5.6 2.8 10.6 8.3 5.6 11.1 8.3 11.1 2. Over basement, enclosed crawl space or concrete slab on ground 0 0 0 0 0 0 0 0 0 0 0 3. Over open crawl space 5.0 2.8 7.8 5.6 2.8 10.6 8.3 5.6 11.1 8.3 11.1 For the Daily Temperature Range, L (Low) means 6.5 (range less than 8.5), M (medium) means 11 (range between 8.5 and 14) and H (high) means 16.6 (over 14). For Ceilings and Roofs, for roofs in shade, the eight hour average is 6 deg temperature differential. At 32 C design and medium daily range, equivalent temperature for light coloured roofs = 17
  • 30. 31 TABLES THAT SUPPLY INFORMATION FOR COOLING CALCULATIONS - Page 2 Table 2 – Solar Heat Gain through windows and Conducted Heat Gain Sensible Cooling Load due to transmitted and absorbed solar energy due to air to air temperature difference ( W/m2 ). This table is derived from ASHRAE Handbook of Fundamentals, p441, Table 51. NOTE: These tables show orientations for the NORTHERN HEMISPHERE first, followed by orientations for the SOUTHERN HEMISPHERE in (brackets). Outdoor Design Temperature Regular single glazing Regular double glazing 29 30 35 38 41 29 30 35 38 41 NO AWNINGS OR INSIDE SHADING North (South) 72.6 85.2 97.8 110.4 119.9 59.9 66.3 75.7 82.0 88.3 NE and NW (SE and SW) 176.7 189.3 201.9 214.5 224.0 145.1 151.4 160.9 167.2 173.5 East and West 255.6 268.2 280.8 293.4 302.9 214.5 220.9 230.3 236.6 242.9 SE and SW (NE and NW) 220.9 233.5 246.1 258.7 268.2 186.1 192.5 201.9 208.2 214.5 South (North) 126.2 138.8 151.4 164.1 173.5 104.1 110.4 119.9 126.2 132.5 DRAPERIES OR VENETIAN BLINDS North (South) 47.3 59.9 72.6 85.2 94.7 37.9 44.2 53.6 59.9 66.3 NE and NW (SE and SW) 101.0 113.6 126.2 138.8 148.3 85.2 91.5 101.0 107.3 113.6 East and West 151.4 164.1 176.7 189.3 198.8 132.5 138.9 148.3 154.6 160.9 SE and SW (NE and NW) 126.2 138.8 151.4 164.1 173.5 104.1 110.4 119.9 126.2 132.5 South (North) 72.6 85.2 97.8 110.4 119.9 59.9 66.3 75.7 82.0 88.3 ROLLER SHADES HALF DRAWN North (South) 56.8 69.4 82.0 94.7 104.1 47.3 53.6 63.1 69.4 75.7 NE and NW (SE and SW) 126.2 138.8 151.4 164.1 173.5 104.1 110.4 119.9 126.2 132.5 East and West 192.5 205.1 217.7 230.3 239.8 170.4 176.7 186.1 192.5 198.8 SE and SW (NE and NW) 164.1 176.7 189.3 201.9 211.4 145.1 151.4 160.9 167.2 173.5 South (North) 91.5 104.1 116.7 129.4 138.8 85.2 91.5 101 107.3 113.6 AWNINGS North (South) 63.1 75.7 88.3 101.0 110.4 41.0 47.3 56.8 63.1 69.4 NE and NW (SE and SW) 66.3 78.9 91.5 104.1 113.6 44.2 50.5 59.9 66.3 72.6 East and West 69.4 82.0 94.7 107.3 116.7 44.2 50.5 59.9 66.3 72.6 SE and SW (NE and NW) 66.3 78.9 91.5 104.1 113.6 44.2 50.5 59.9 66.3 72.6 South (North) 66.3 75.7 88.3 101.0 110.4 41.0 47.3 56.8 63.1 69.4 Table 3 – Heat output for various heat sources Heat source Heat output Item Heat output People, varies 66 Kitchen say 35 Lights wattage of lamps Table 4 – Outdoor design temperature for various cities This table is derived from AIRAH Design Data, pp 1.4 – 1.7, Table 1.1. They show the outdoor 3 pm dry-bulb temperatures which individually are exceeded on 10 days of the year. Location Outdoor design temp (deg C) Location Outdoor design temp (deg C) Adelaide 36.0 Melbourne 34.5 Alice Springs 39.5 Newcastle 32.0 Brisbane 31.0 Perth 36.0 Canberra 34.0 Port Hedland 39.5 Darwin 34.5 Sydney 30.5 Hobart 26.0 Townsville 32.0 Kalgoorlie 40.0
  • 31. 32 Interim Report 2 - Task 2.3 First Rate analysis FirstRate has been developed by the Sustainable Energy Authority of Victoria to help designers conduct an energy analysis on home designs that is quick and interactive. Your task (1) Conduct a FirstRate rating on the house you have been assigned for the Into Design Project. (2) Make design recommendations, informed by your use of FirstRate, to improve the rating of your house. (3) Prepare a short appraisal of the software. Data to be gathered In order to give the dwelling a rating, certain data must be gathered as noted below (which means that your own home may be the best selection). Dimensions that are to the nearest 100 mm should be sufficient. Clearly, not all the information that you require to make the assessment will be on the drawings you have been supplied, or in the extra data that you have been able to gather. You will therefore have to make best-guess assumptions about some of these building elements. It is very important that you list the assumptions that you have made, and the reasons why you have made them, in the reporting section of the FirstRate software. The list below from the FirstRate manual shows the information required to complete the FirstRate rating. Floor Plan Floor areas and types Site plan Distance from & height of adjacent bldgs Doors between heated spaces Area of opening between floors Elevations Orientation of windows Perimeter of house Height of windows Length of internal masonry walls Distance between window head & overhang Size of roof glazing/skylights Size of overhangs Other info Insulation levels Types of floor coverings Types of curtains Number of chimneys Extent of weatherstrips to doors & windows Number of exhaust fans Types of external walls Number of vented downlights Extent of external blinds Extent of cathedral ceilings Types of window frames Extent of double glazing
  • 32. 33 Section Average ceiling height Type of exhaust fans Internal & external wall heights Whether skylights are vented or not Appraisal and Recommendations Write a short appraisal (approx 150 words) summarising your impressions of the FirstRate system, including comments on how easy it was to use, any limitations you perceive, and what you have learned from the use of the software. Prepare an illustrated Recommendations Report detailing the changes you might make to the design of your Into Design House to improve its performance and the effect these changes have on the FirstRate rating and points score. Submission Printout of FirstRate rating, report, software appraisal and Recommendations Report to be handed in as part of Interim Report 2. Only 1 FirstRate appraisal is required per team. You should use the appraisal and the recommendations you make to inform your redesign of the house you have been assigned. Resources Extensive help file and tutorials provided within the software. Feedback from previous years on what an HD submission for this task might include: Students generally have a good grasp of the software, however many fail to meet basic requirements such as submitting a copy of the First Rate report. Students could greatly increase their mark by demonstrating they have properly read the task and submitting the report as requested. High distinction: • original and improved report provided (as required); • appraisal of software provided (as required); • discussion of improvements made, and clear indication of what the improvements were; • clear list of assumptions; • diagram showing cross ventilation; • research into suggested improvements; • plan / section diagrams showing the locations of different materials. Common errors / omissions: • not including actual First Rate report (this requirement is clearly stated in the task outline); • not including software appraisal; • no clear discussion of improvement options.
  • 33. 34 Interim Report 2 - Task 2.4 Fluid Mapping Your task Fluid Mapping: On-site ventilation analysis. (1) Construct a Plan and Section model to a 1:50 scale of your project. The model represents a thin slice through your Into Design House. Below are fluid-mapping photographs of a house plan. The Fluid Mapping model materials will be detailed in the lecture. Models usually consist of small strips of MDF (representing walls) glued to a sheet of glass. The flow of the coloured fluid is photographed to provide for analysis. (2) Test the existing ventilation features of your house in plan and section in a manner that reconstructs the dominant wind characteristics of the climate of where your house is located. Consider microclimate influences too, such as site restrictions, adjacent buildings, vegetation or external devices that may hinder the ventilation design intent. Test the house as it is (before redesign) with windows/doors closed and then with windows/doors open. (3) After an analysis of the existing conditions, you should have identified shortcomings in the design (if any). Now propose alternative solutions to improve ventilation and to test these through additional fluid- mapping analyses. Resources Refer to the two papers posted on DSO:
  • 34. 35 Feedback from previous years on what an HD submission for this task might include: This task is generally completed quite well, although many students do not explain where their wind data originates and/or do not properly explore options to improve the design. Successful submissions included: • clearly presented ‘before & after’ modelling; • floor plan and section and/or site plan tested; • wind speed and direction taken into account; • demonstrated an understanding of air movement speeds within a house; • effective, simple proposed solution; • demonstrated an understanding of how to condition breezes within the house; • did not view fluid mapping in isolation but understood the broader effects of proposed changes. Common errors / omissions: • lack of clear annotations (e.g. plan or section); • poor presentation, printing in black & white; • improvement options not explored as fluid mapping models; • source for wind data not credited.
  • 35. 36 Interim Report 2 - Task 2.5 Calculating Energy Efficient Design using the Oppenheim thermal mass rule-of-thumb analysis Final Submission Group 2.1 – 2007 Good energy efficient design for temperate climates can be quickly achieved in the broad brush by using the Oppenheim Method. Once the brief is known and areas for each space allocated, this quick calculation method can give approximate areas for north facing glass and the surface areas of the thermal mass. It can be applied to whole areas, or single rooms. Your task For your Into Design House, use the Oppenheim Method to calculate the following: (a) For a north facing Living/Dining/Kitchen area (or equivalent), calculate: (1) The zone floor area (2) The ideal north facing glass area (3) The ideal surface area of thermal mass required for; (i) the existing glass area and, (ii) the ideal area of glass. Discuss then the relationship between the existing thermal mass and: (i) That required for the existing glass area and, (ii) That required for the ideal area of glass. How might the relationship between glass area and thermal mass be improved in both circumstances (ideal and existing)? In this discussion, consider the following points: If more surface area than a concrete slab is required, suggest the location of other surfaces that could be used (for example it may be appropriate to use additional masonry walls in the living space). The surface areas will be masonry walls, but if a concrete slab is exposed as a ceiling, it too can be used. If greater surface-area is
  • 36. 37 required, as calculated from the Oppenheim method, then additional wall surface-area can be used. You cannot count the area of windows in these walls, just the surface area of the masonry. After you have suggested these surfaces, give an indication of how big this additional wall surface area might need to be in m2 . N.B. In this discussion, use graphic information (i.e. diagrams etc.) as much as possible to communicate your recommendations. You will be assessed as much on the effectiveness of your graphic communication of information as on the quality of the information. Resources Use the Residential design in temperate climates lecture notes. Feedback from previous years on what an HD submission for this task might include: • Diagrams; • Clear and colour coded plans of different zones identified correctly; • Discussion of benefits and negative aspects of the existing design; • Correct use of the method; • Discussion of thermal mass ratios; • Some improvements, taking into account glazing area and thermal mass and the interrelationship of the two; • Implications to the redesign; • Sensitivity to the aesthetics and initial intent of the design; and how to redesign according to this; • Research and options of appropriate thermal mass materials. Common errors / omissions • Spelling • Unclear presentation / diagrams. • No information regarding implications of thermal mass vs. glazing.
  • 37. 38 APPENDIX 3 Final Report 3 & Oral Presentation Final Submission Group 2.1 - 2007 Report 3 is the culmination of your semester’s work and is worth, therefore, 20% of the unit marks. It is assessed as a group submission, but marks may be individualised by SAPA. In the Final Report (Report 3), you are to: (1) Present graphically and using models a team re-design of your Into Design House that makes improvements to its environmental performance. It is suggested that you make your design changes clear by presenting them in ‘before’ and ‘after’ illustrations (and models). (2) Quantify (i.e. demonstrate the effectiveness of) these design changes by (i) using the measurement tools you used in Report 2, and by (ii) ascertaining budget implications (payback etc.) and by (ii) ascertaining changes to the overall embodied energy it took to make the house compared to its predicted life-span. Please note the following points with regards to the Final Report and your oral presentation of it. I. No student work will be marked unless it is part of the Report 3 group submission. Thus, work submitted individually will be ignored. Report 3 is a GROUP submission. II. Your time for the oral presentation is brief - around 10 to 12 minutes. Thus, be concise. Concentrate on - what you have changed in the redesign, why you changed this, and what effect those changes will make.
  • 38. 39 III. All teams must be present for the entire 2-hour session of which their oral presentation is a part of. Each team must fill out one feedback sheet for each of the other groups in their session. Failure to do this will result in a mark penalty. IV. The final report is to be submitted to Marj in the resource centre by 11:30 am on Thursday the 4th October. There can be no extensions granted. V. The final report submission must contain the first two Interim Reports in addition to Part 3. You will, however, only pin-up and present at your review Part 3 of the report – Part 3 being the redesign (clearly indicating before and after, the reasons for your changes, and the cost implications of these changes). VI. If you wish to; (i) pin-up review drawings (A3s) that differ from those submitted in Part 3 of the final report, (ii) and/or present using PowerPoint – you must submit the review set of drawings and the PowerPoint when you submit the final report at the Resource Centre. This is to ensure that groups presenting in Week 13 do not have an advantage over those presenting in Week 10. VII. The timetable for submission may have your team presenting at a time that differs from your normal tutorial time. This timetable might not be announced until the day before you present, as we are waiting to here from the architects who designed the houses about their availability. Thus, please check DSO regularly for the Review timetable. VIII. The majority of the assessment of your final Report will be made at the oral review.