
Recomendados
Más contenido relacionado
La actualidad más candente
La actualidad más candente (18)
Destacado
Destacado (7)
Similar a Charitable Giving En 2005 2004
Similar a Charitable Giving En 2005 2004 (20)
Último
Último (20)
Charitable Giving En 2005 2004
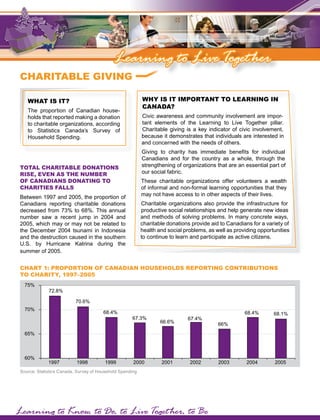
- 1. Learning to Live Toget her CHarItable GIvInG wHy Is It ImPortant to learnInG In wHat Is It? Canada? The proportion of Canadian house- Civic awareness and community involvement are impor- holds that reported making a donation tant elements of the Learning to Live Together pillar. to charitable organizations, according Charitable giving is a key indicator of civic involvement, to Statistics Canada’s Survey of because it demonstrates that individuals are interested in Household Spending. and concerned with the needs of others. Giving to charity has immediate benefits for individual Canadians and for the country as a whole, through the strengthening of organizations that are an essential part of total CHarItable donatIons our social fabric. rIse, even as tHe number These charitable organizations offer volunteers a wealth oF CanadIans donatInG to of informal and non-formal learning opportunities that they CHarItIes Falls may not have access to in other aspects of their lives. Between 1997 and 2005, the proportion of Charitable organizations also provide the infrastructure for Canadians reporting charitable donations decreased from 73% to 68%. This annual productive social relationships and help generate new ideas and methods of solving problems. In many concrete ways, number saw a recent jump in 2004 and 2005, which may or may not be related to charitable donations provide aid to Canadians for a variety of health and social problems, as well as providing opportunities the December 2004 tsunami in Indonesia to continue to learn and participate as active citizens. and the destruction caused in the southern U.S. by Hurricane Katrina during the summer of 2005. CHart 1: ProPortIon oF CanadIan HouseHolds rePortInG ContrIbutIons to CHarIty, 1997–2005 75% 72.8% 70.6% 70% 68.4% 68.4% 68.1% 67.3% 67.4% 66.6% 66% 65% 60% 1997 1998 1999 2000 2001 2002 2003 2004 2005 Source: Statistics Canada, Survey of Household Spending Learning to Know, to Do, to Live Toget her, to Be
- 2. 2007 CLI Despite the eight-year drop in the total number of CanadIans GIve to suPPort tHose In Canadians donating to charity, the total amount of dona- need, or to suPPort a Cause tions from Canadians actually increased to nearly $6.5 According to the CSGVP, most Canadians cite billion in 2005, from just under $6 billion in 1997.1 This “compassion towards people in need” as the chief is believed to be the result of population growth and an reason for deciding to give to charity. In 2004, nearly increase in the number of larger individual donations. four of every five donors made contributions within the This trend is consistent with research undertaken community in which they lived. Canadians were far less using the Canada Survey of Giving, Volunteering and likely to agree that they gave to charities for religious Participating (CSGVP) from Statistics Canada, which reasons or because they would receive a credit on shows that the country can be divided into two groups: their income tax. These findings point to social justice, a small core of citizens who are heavily involved in civic community ties and concern for others as motives activities, and the majority of Canadians who are not.2 behind charitable giving in Canada. table 1: CHarItable donatIons In table 2: reasons For CHarItable Canada, 2005 GIvInG In Canada, 2004 Percentage Percentage of Canadian Reason for giving of respondents Median Province/territory households who agreed donation making Feel compassion towards people 89% donations in need Newfoundland and 83.1% $240 Help a cause in which you Labrador 86% personally believe Prince Edward Island 79.4% $275 Make a contribution to the 79% Saskatchewan 77.6% $250 community New Brunswick 74.7% $220 Personally affected by the cause 63% the organization supports Ontario 73.6% $300 Fulfill religious obligation or beliefs 32% Nova Scotia 72.5% $220 Government will give you a credit Manitoba 72.5% $300 20% on your income tax Canada 68.1% $250 Source: Statistics Canada, Canada Survey of Giving, Volunteering Alberta 71.8% $300 and Participating, 2004 Yukon 66.5% $200 British Columbia 66.1% $300 Quebec 56% $130 Northwest Territories 53.8% $200 Nunavut 25% $220 Source: Statistics Canada, Survey of Household Spending, 2005 www.ccl-cca.ca/cli, May 2007 ________________________ 1 In constant 2005 dollars. 2 Reed, Paul B. and L. Kevin Selbee. The Civic Core in Canada: Disproportionality in Charitable Giving, Volunteering, and Civic Participation (Ottawa: Statistics Canada’s Non-profit Sector Knowledge Base Project, 2002). Full ClI results, data and doCumentatIon avaIlable at www.CCl-CCa.Ca/ClI