1. Korean Coffee Market 1
2001-2011
State of Korea’s Coffee Import
The first issue of Monthly Coffee was published in October 2001 - it has since already been 10 years and
how much did the Korean coffee market grow by 2011? Koreans have visibly become “coffeeholics” unable
to live without coffee and it is easy to find a specialized coffee shop in Korea. To grasp how much coffee was
imported to Korea and how much was exported in the last 10 years, we have examined their growth.
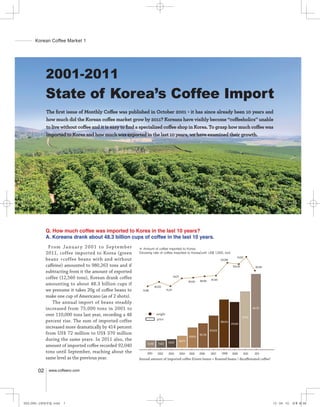
Q. How much coffee was imported to Korea in the last 10 years?
A. Koreans drank about 48.3 billion cups of coffee in the last 10 years.
F ro m Ja n u a r y 2 0 0 1 t o S e p t e m b e r ※ Amount of coffee imported to Korea
2011, coffee imported to Korea (green (Growing rate of coffee imported to Korea/unit: US$ 1,000, ton)
111,625
beans +coffee beans with and without 102,086
caffeine) amounted to 980,263 tons and if 100,576 92,040
subtracting from it the amount of exported
coffee (12,560 tons), Korean drank coffee 84,217
87,345
85,032 86,594
amounting to about 48.3 billion cups if 80,233
we presume it takes 20g of coffee beans to 75,186 75,331
make one cup of Americano (as of 2 shots).
The annual import of beans steadily
increased from 75,000 tons in 2001 to 461,761
over 110,000 tons last year, recording a 48 weight
371,612
price
percent rise. The sum of imported coffee 289,254
276,284
increased more dramatically by 414 percent
203,934
from US$ 72 million to US$ 370 million 162,736
140,604
during the same years. In 2011 also, the 96,074
72,249 71,423 78,597
amount of imported coffee recorded 92,040
tons until September, reaching about the 2001 2002 2003 2004 2005 2006 2007 2008 2009 2010 2011
same level as the previous year. Annual amount of imported coffee (Green beans + Roasted beans / decaffeinated coffee)
02 www.coffeero.com
002,005-그린빈수입.indd 1 12. 04. 10 오후 8:36
2. Roasted beans Roasted beans
Roasted beans (with caffeine) (with caffeine) Roasted beans Roasted beans
Roasted beans
(with caffeine) Roasted beans 4%
0.8%
Green beans (without caffeine) Green beans (without caffeine) Roasted beans (without caffeine)
Green beans (without caffeine) (without caffeine) 0.2%
(without caffeine) (with caffeine)
0.1% 0.8%
(without caffeine) Green beans
1.1%
(without caffeine)
Total Total Total
amount Total
amount
75,186 111,625 980,263 2,224,528
Green beans
(with caffeine) Green beans Green beans Green beans
98% (with caffeine) (with caffeine) (with caffeine)
98% 98% 98%
2001 2010 Weight of imported coffee (T) Value of imported coffee (US $1000)
Growth change of the domestic coffee imports The number of coffee status (2001– 2011)
(1) Green beans ※ Amount of green bean import (with caffeine/unit: US$ 1,000, ton)
Green beans imported to Korea over the last 10 Period Weight of imported green beans Value of imported green beans
2001 73,516 63,550
years amounted to 97 percent of the total import of 2002 78,212 61,142
coffee. The import of green beans recorded steady 2003 73,451 69,077
growth from the change of consumption pattern 2004 80,427 83,443
2005 82,482 126,862
from coffee and Robusta of various producing 2006 83,990 143,682
countries to Arabica and other various types due 2007 83,597 174,295
to the roasting fever in Korea. However, with the 2008 97,039 248,731
2009 96,044 230,593
international rise in the coffee price, the cost of
2010 106,384 313,128
imported coffee increased from an average of US$ 2011 87,502 396,783
860 per ton in 2001 to US$ 4,000 in 2011.
In contrast, the amount of decaffeinated green ※ Amount of imported Roasted beans (with caffeine/unit: US$ 1,000, ton)
bean import is steadily decreasing because only a Period Weight of imported roasted beans Value of imported roasted beans
limited number of shops in Korea sell decaffeinated 2001 598 5,357
2002 721 6,784
coffee and those selling the coffee import and use 2003 775 6,849
beans roasted abroad instead of roasting them in 2004 870 8,203
Korea. 2005 1,148 10,797
2006 1,567 15,427
2007 2,443 24,897
(2) Roasted beans 2008 3,012 35,477
If we look at the amount of roasted coffee beans 2009 3,462 40,738
2010 4,323 52,968
imported to Korea last year, it grew sevenfold 2011 3,897 59,598
from 2001 reaching about 4,300 tons in 2010. The
growth of coffee shops in Korea has supported this increase of which the steady growth of global coffee
chain shops played an important part. However, this is very little compared to the amount of imported
green beans because of own roasting by Korean coffee franchise shops and the fever of roastery business
startups in Korea.
• 2012 03
002,005-그린빈수입.indd 2 12. 04. 10 오후 8:36
3. ① 2001~2011 State of total import of green beans by country
(Countries from which more than 100 tons of green beans were
imported to Korea /unit: US$ 1,000, ton)
Weight of imported Value of imported Year with the largest
green beans green beans amount of import (weight)
Vietnam 387,062 487,860 2008 (47,055)
Brazil 143,320 355,122 2010 (19,849)
Colombia 117,518 370,649 2010 (14,361)
Honduras 95,678 256,511 2010 (12,172)
Indonesia 63,249 64,937 2002 (16,606)
Peru 54,536 148,246 2008 (8,011)
Mexico 12,917 23,570 2004 (2,491)
Ethiopia 12,208 40,324 2010 (2,908)
Guatemala 10,056 39,287 2010 (5,096)
Thailand 8,921 4,116 2001 (8,629)
PapuaNew Guinea 7,474 19,400 2008 (1,766)
Costa Rica 7,205 23,643 2001 (1,546)
China 6,554 21,193 2009 (2,017)
El Salvador 4,636 10,011 2003 (1,403)
India 4,466 14,223 2011 (1,475)
Kenya 1,742 10,755 2009 (433)
Tanzania 1,632 5,661 2011 (385)
Japan 688 1,786 2007 (303)
Nicaragua 658 2,673 2010 (299)
Spain 338 821 2001 (218)
United States 310 1,905 2001 (131)
Nepal 204 1,043 2011 (124)
Timor 180 546 2009 (46)
Uganda 176 782 2011 (97)
② Import trends of green beans in the last three years
(Countries from which more than 100 tons of green beans were
imported to Korea/unit: US$ 1,000, ton)
Country
Q. From which country did Korea
2009 2010 2011 Total Weight
imported from
import coffee the most in the last 10 Vietnam 33,349 33,632 28,776 95,757
years?
Brazil 17,333 19,849 18,230 55,412
Colombia 13,733 14,361 13,214 41,308
A. For green beans, Vietnam, Brazil, Honduras 11,116 12,172 10,746 34,034
Colombia, Honduras, Indonesia and Peru 6,538 7,333 4,195 18,066
Peru, for coffee beans, the United Indonesia 6,272 5,972 1,090 13,334
States, Italy, Japan and Switzerland
Guatemala 919 5,096 1,988 8,003
Ethiopia 1,886 2,908 2,659 7,453
China 2,017 578 1,562 4,157
State of coffee import by country Costa Rica 914 808 1,227 2,949
India 6 683 1,475 2,164
(1) Green beans PapuaNew Guinea 750 1,174 129 2,053
(except for decaffeinated) Kenya 433 390 414 1,237
Countries that exported the largest amount Mexico 305 284 258 847
Tanzania 175 187 385 747
of green beans to Korea in the last 10 years Nicaragua 61 299 238 598
were in the order of Vietnam, Brazil, Colombia, El Salvador 14 405 428 428
Honduras, Indonesia and Peru. These six Nepal 38 19 124 181
Uganda 19 60 97 176
countries accounted for about 91 percent of
all imported green beans to Korea in the last
10 years. In particular, imported green beans not on the top list, Korean consumers have also shown
from Vietnam in 2008 alone was twice the total great interest in coffee from Nicaragua, El Salvador, India,
amount of imported coffee beans in the last Ethiopia, Kenya, Costa Rica, and Tanzania, which showed
10 years, showing amazing growth. Although large growth rates. Though not in large amounts, coffee
04 www.coffeero.com
002,005-그린빈수입.indd 3 12. 04. 10 오후 8:36
4. import from El Salvador, Uganda, Rwanda, ① 2001~2011 State of total import of coffee beans by country
(Countries from which over 50 tons of coffee beans were
Laos, Dominican Republic, Bolivia, Myanmar, imported to Korea/unit: US$ 1,000, ton)
and Panama also recently visibly increased. Weight of imported Value of imported Year with the largest
Countries that exported the most green beans coffee beans coffee beans amount of import (weight)
to Korea last year or until September 2011 United States 12,643 128,522 2010 (2,214)
Italy 4,133 52,537 2010 (773)
were Brazil, Colombia, Honduras, Ethiopia,
Japan 1,593 15,194 2010 (554)
Guatemala, Tanzania, Nicaragua, Nepal and Switzerland 1,334 35,958 2011 (373)
Uganda. Brazil 634 5,989 2011 (404)
Germany 577 6,074 2011 (88)
Canada 326 3,142 2010 (41)
(2) Roasted beans Australia 319 3,629 2010 (59)
(except for decaffeinated) United Kingdom 295 5,227 2011 (194)
Countries which expor ted the largest Guatemala 134 1,899 2011 (134)
amount of coffee beans to Korea in the last Colombia 127 1,263 2011 (83)
France 115 1,319 2011 (22)
10 years were in the order of the United Indonesia 92 726 2011 (54)
States, Italy, Japan, and Switzerland. Coffee Vietnam 68 396 2008 (34)
beans exported from these four countries Netherlands 62 763 2002 (12)
Poland 54 488 2008 (19)
to Korea accounted for about 86 percent
of total import. In particular, the amount
② Import trends of coffee beans in the last three years
of coffee beans imported from the United (Of countries from which more than 30 tons of coffee beans
States in 2010 alone was three times that of were imported to Korea)
Italy, the hometown of espresso, showing
Country
the popularity of coffee chain shops from the imported from
2009 2010 2011 Total Weight
United States. United States 2,050 2,214 1,558 5,822
Data o f many co ffe e b ean ex p or ting Italy 620 773 622 2,015
Japan 306 554 190 1,050
c o u n t r i e s s u c h a s S w i t z e r l a n d , B ra z i l , Switzerland 215 340 373 928
Germany and the United Kingdom, have Brazil 9 118 404 531
not been calculated yet for 2011, but they United Kingdom 26 41 194 261
have already recorded the highest amount Germany 69 86 88 243
Australia 49 59 39 147
of export to Korea until September 2011. If Guatemala 0 0 134 134
during the left months of 2011, import of Colombia 11 24 83 118
coffee beans from the United States, Italy and Canada 26 41 30 97
Indonesia 5 6 54 65
Japan recovers the level of 2010, the amount
France 12 22 22 56
of coffee bean import to Korea is expected to Mexico 0 0 32 32
break the record of 2010 in 2011. Peru 0 0 30 30
• 2012 05
002,005-그린빈수입.indd 4 12. 04. 10 오후 8:36