SlideShare una empresa de Scribd logo
1 de 56
1


 A STUDY ON EFFECT OF WELFARE MEASURES
              ON EMPLOYEE
                   TABLE OF CONTENT


LIST OF TABLES
LIST OF CHARTS


                                                PAGE
CHAPTER                    TITLE
                                                 NO.

    1       INTRODUCTION                         1
    2       REVIEW OF LITERATURE                 8
    3       OBJECTIVES OF THE STUDY              16
    4       RESEARCH METHODOLOGY                 17
    5       DATA ANALYSIS AND INTERPRETATION     21
            FINDINGS, SUGGESTIONS AND
    6       RECOMMENDATIONS OF THE STUDY         42

    7       CONCLUSION                           44
            LIMITATION OF THE STUDY AND SCOPE
    8       FOR FURTHER STUDY                    45


ANNEXURES

1. QUESTIONNAIRE
2. BIBLIOGRAPHY
2


         LIST OF TABLES


TABLE                                                 PAGE
                           TITLE
 NO.                                                   NO.
5.1      EXPERIENCE OF RESPONDENT                      21
5.2      LEVEL OF SATISFACTION OF SAFETY MEASURES      22
5.3      LEVEL OF SATISFACTION OF MEDICAL FACILITY     23
         LEVEL OF SATISFACTION OF WORKING
5.4      ENVIRONMENT                                   24
         LEVEL OF SATISFACTION OF RELATIONSHIP
5.5      BETWEEN SUPERVISOR AND WORKER                 25
         LEVEL OF SATISFACTION OF RELATIONSHIP
5.6      BETWEEN WORKERS                               26
5.7      LEVEL OF MOTIVATION GIVEN TO EMPLOYEE         27
5.8      LEVEL OF FREEDOM GIVEN TO THE EMPLOYEES       28
         STATUS OF GRIEVANCE HANDLING IN THE
5.9      COMPANY                                       29
5.10     WORK SATISFACTION LEVEL OF THE EMPLOYEE       30
         SATISFACTION OF EMPLOYEES ABOUT WELFARE
5.11     MEASURES                                      31
         ANALYSIS OF OPINION OF RESPONDENTS
         REGARDING COMMUNICATION IN WORK PLACE
         AND WORK SATISFACTION
5.12.1   (USING CHI-SQUARE) –OBSERVED COUNT TABLE      32
5.12.2   EXPECTED COUNT TABLE                          32
5.12.3   CHI- SQUARE TABLE                             32
         ANALYSIS OF OPINION OF RESPONDENTS
         REGARDING WELFARE SATISFACTION AND WORK
         SATISFACTION (USING CHI-SQUARE) - OBSERVED
5.13.1   COUNT TABLE                                   34
5.13.2   EXPECTED COUNT TABLE                          34
5.13.3   CHI- SQUARE TABLE                             34
         ANALYSIS OF OPINION OF RESPONDENTS
         REGARDING EXPERIENCE OF RESPONDENT AND
         WORK SATISFACTION (USING CHI-SQUARE) -
5.14.1   OBSERVED COUNT TABLE                          35
5.14.2   EXPECTED COUNT TABLE                          35
3


                       LIST OF TABLES


                                                     PAGE
TABLE                       TITLE
                                                      NO.
 NO.

5.14.3   CHI- SQUARE TABLE                            36
         ANALYSIS OF OPINION OF RESPONDENTS
         REGARDING MOTIVATION GIVEN TO EMPLOYEE
5.15.1   AND WORK SATISFACTION (USING CORRELATION)    37

5.15.2   CORRELATION TABLE                            37
         ANALYSIS OF RANKING GIVEN BY RESPONDENTS
         REGARDING SATISFACTION OF WELFARE
         MEASURES (USING WEIGHTED AVERAGE
5.16.1   METHOD)                                      39

5.16.2   WEIGHTED AVERAGE TABLE                       39
         ANALYSIS OF OPINION GIVEN BY RESPONDENTS
         REGARDING SATISFACTION OF WELFARE
         MEASURES AND EMPLOYEE MORALE (USING
5.17.1   REGRESSION METHOD)                           40

5.17.2   REGRESSION TABLE                             40
4


                     LIST OF CHARTS


                                                    PAGE
CHART                      TITLE
                                                     NO.
 NO.

5.1     EXPERIENCE OF RESPONDENT                     21

5.2     LEVEL OF SATISFACTION OF SAFETY MEASURES     22

5.3     LEVEL OF SATISFACTION OF MEDICAL FACILITY    23
        LEVEL OF SATISFACTION OF WORKING
5.4     ENVIRONMENT                                  24
        LEVEL OF SATISFACTION OF RELATIONSHIP
5.5     BETWEEN SUPERVISOR AND WORKER                25
        LEVEL OF SATISFACTION OF RELATIONSHIP
5.6     BETWEEN WORKERS                              26

5.7     LEVEL OF MOTIVATION GIVEN TO EMPLOYEE        27

5.8     LEVEL OF FREEDOM GIVEN TO THE EMPLOYEES      28
        STATUS OF GRIEVANCE HANDLING IN THE
5.9     COMPANY                                      29

5.10    WORK SATISFACTION LEVELOF THE EMPLOYEE       30
        SATISFACTION OF EMPLOYEES ABOUT WELFARE
5.11    MEASURES                                     31
5


                       CHAPTER-1
                      INTRODUCTION


1.1 COMPANY PROFILE
6

1.2 INTRODUCTION TO THE STUDY


                   The study was conducted in HIDESIGN in othiampet, puducherry to
find the effect of welfare measures on employee morale.

                   The study intends to see the satisfaction level of the employee on the
facilities provided by the company and how these welfare measures boost the employee
morale.

                   The study on effect of welfare measure on employee morale gives the
management an indication of the level of satisfaction among the employees regarding the
general working condition and the other facilities provided by the organization. This helps
the management to know the general morale of the employees.
7


                                     CHAPTER -2

                           REVIEW OF LITERATURE


           Human Resource Management is the process of procuring, developing,
maintaining, and controlling human resources for effective achievement of organizational
goals. This project is focused on employee welfare measure and employee morale.


2.1 EMPLOYEE WELFARE – DEFINITION

           Employee welfare means “the effort to make life worth living for workmen”.
When all basic facilities are provided and employees obtain satisfaction then the
productivity can be increased and development of the organization will be possible

CONDITIONS OF WORK ENVIRONMENT

1) Working conditions
   •   Temperature
   •   Ventilation
   •   Lighting
   •   Dust
   •   Smoke
   •   Fumes and gases
   •   Noise
   •   Humidity
   •   Posture – simple
   •   Hazard and safety complex devices

2) Factory Sanitation and Cleanliness:
   •   Provision of urinals in factories
   •   Provision of spittoons
   •   Provision for the disposal of waste and rubbish
   •   Provision for water disposal (drainage)
   •   Provision of proper bathing and washing facilities
8

   •   Cleanliness, white- washing and repair of buildings and workshops
   •   Care and maintenance of open spaces, gardens, roads, etc

3) Welfare Amenities
   •   Provision and care of drinking water
   •   Canteen services
   •   Lunch
   •   Rest room
   •   Crèches
   •   Cloak rooms
   •   Other amenities


2.1.1 EMPLOYEES’ HEALTH SERVICES

1) Factory health services
   •   Medical examination of employees
   •   Factory dispensary and clinic treatment
   •   First aid and ambulance room
   •   Treatment of accidents and
   •   Health education and research

2) Recreation
   •   Playgrounds for physical recreation (athletics, games, gymnastics, etc)
   •   Social and cultural recreation (music, singing, dancing, drama, etc)

3) Workers education
   •   Education to improve skills and earning capacity
   •   Literacy
   •   Library, audio visual education, lecture programmes and
   •   Workers educational scheme and its working

4) Economic Services
   •   Employees’ co-operative societies
   •   Grain shops and fair price shops and
9

   •   Housing co-operatives

5) Housing for employees and community services
10

6) Study of the working of welfare Acts
   •   Factories Act
   •   Employees state insurance act
   •   Minimum wages act

7) Social Work in industrial Setting
   •   Family Planning
   •   Employee counseling

2.1.2 EMPLOYEE SERVICES AND BENEFITS

              These are concerned with the process of sustaining and maintaining the work
force in an organization. They include
1) Safety provision inside the workshop
2) Employee counseling
3) The medical services
4) The recreational and other welfare facilities
5) Fringe benefits and supplementary items

2.1.3 EMPLOYEE MORALE - DEFINITION

              According to Yoder “morale is a feeling, somewhat related to esprit de corps,
enthusiasm or zeal.Fippo has described morale “As a mental condition or attitude of
individuals and groups which determines their willingness to co-operate. Good morale is
evidenced by employee enthusiasm, voluntary conformance with regulations and orders,
and a willingness to co-operate with others in the accomplishment of an organization’s
objectives.

2.1.4 FACTORS AFFECTING MORALE

       According to McFarland, the important factors which have a bearing on morale are

   •   The attitude of the executives and managers towards their subordinates.
   •   working conditions, including pay, hours of work, and safety rules
   •   effective leadership and an intelligent distribution of authority and responsibility in
       the organization
   •   the design of the organization’s structure which facilities the flow of work and
   •   The size of the organization.
11


2.1.5 CRITERIA THAT DETERMINES MORALE

            Several criteria seem important in the determination of levels of workers
morale, such as
    •   The organization itself
    •   The nature of the work
    •   The level of satisfaction
    •   The supervision received
    •   The perception of the self
    •   Workers perception of the past awards and future opportunities for rewards
    •   The employees age
    •   The employee’s educational level and occupational level.

2.1.6 TYPES OF MORALE

            Morale is generally referred to as high morale. According to McFarland, “high
morale exists when employee attitudes are favorable to the total situation of a group and to
the attainment of its objectives low morale exists when attitudes inhibit the willingness and
ability of an organization to attain its objectives

            High morale is represented by the use of such term spirit, zest, enthusiasm,
loyalty, dependability and resistance to frustration. Low morale, on the other hand, is
described by such words and phrases as apathy, bickering, jealously, pessimism, fighting,
disloyalty to the organization, disobedience of the orders of the leaders, dislike of, or lack
of interest in, one’s job, and laziness.

2.1.7 MORALE AND PERFORMANCE

            It has been pointed that “there is a little evidence in the available literature that
employee attitudes bear any relationship to performance on the job.

            First, there are some who assert that high satisfaction leads to high
performance. The “Hawthorne” studies of 1930s seem to support this view, as do findings
of other studies.
12

             Second, others take an opposite view. For example, Lyman Porter and Lawler
say that satisfaction results from high performance, because most people experience
satisfaction by accomplishing more tasks, like building a radio, or clinching a sale.
             Third, still others claim that there is no consistent relationship between morale
and performance. Vroom found significant relationship between morale and performance
in only 5 out of 22 studies undertaken by him.

2.1.8 WARNING SIGNS OF LOW MORALE

             Among the more significant of the warning signals of low morale are
   •   High rate absenteeism
   •   Tardiness
   •   High Labour turnover
   •   Strike and sabotage
   •   Lack of pride in work and
   •   Wastage and spoilage.

2.1.9 IMPROVING MORALE

             A three-fold action may be initiated. In the first place, it is essential to change
the policy or to correct it immediately. Employees do not lose their respect for the boss
who admits his mistakes but they cannot respect one who makes too many, and they may
have contempt for one who refuses to admit his mistakes.

             Second, misconceptions should be removed, and the correct position should be
explained to the employees.

             Third, a reasonable attempt should be made to educate and convince the
employees.
13

2.2 REVIEW OF LITERATURE FROM JOURNALS AND ARTICLES

Preserving Employee Morale during Downsizing

Karen E. Mishra, Gretchen M. Spreitzer and Aneil K. Mishra
Topic: Human Resource Management and Industrial Relations
Reprint 3927; winter 1998, Vol. 39, No. 2, pp. 83–95
       Mishra propose a four-stage approach to downsizing, gleaned from interviews and
surveys that will retain workers' trust and sense of empowerment. The company should
consider all stakeholders' needs — survivors, laid-off employees, the community, local and
national press, and any affected government agencies.        The implementation of all the
above, is the most important. Management should communicate frequently and be open
and honest.


How to Boost Employee Morale
By Betsy Gallup
April 9, 2006

The following are the ways to boost the employee morale.
   •   Treat employees with respect
   •   Show interest in your employees' personal lives
   •   Allow your employees to gain ownership of their jobs by being part of the
       decision-making process
   •   Create a pleasant work environment
   •   Establish an employee recognition program
   •   Give clear direction and set priorities.
   •   Stand behind your employees. Be their greatest advocate.
14


Boost Employee Morale with an Employee Incentive Program
By: Trevor Marshall
        Good managers know from their own observations that employee attitude affects
their work and eventually the company’s output.
        It is essential that your incentive program will actually inspire and motivate them to
work efficiently and not just be competitive with each other. Healthy competition among
the company’s employees is good but too much of it may also cause the company to
disintegrate.
        The company should still be very much hands-on with the whole employee
incentive program to ensure that the outcome of the employee incentive program will be
good.


Employee Welfare
By Regina Barr
        Employee Welfare program is based on the management policy which is aimed
shaping perfect employees. Therefore the concept of employee welfare includes to aspects
namely physical and mental welfares


1. Applications of merit system or work performance system as the basis for employee
rewarding.
2. Providing the retired employees with the old age allowance.
3. Employee insurance program to provide the employee with better security.
4. Improvement in health security for the employees and their families so that they can
work confidently and productively.
5. Increase in basic salaries and pension as adjustment to the needs providing all work
units and their officials with vehicles to help support smooth mobility.
15


2.3 DIAGRAMATIC REPRESENTATION OF THE STUDY


                                              JOB
CANTEEN      MEDICAL                          SATISFACTION
FACILITY     FACILITY          MOTIVATION

                         Effect of
                         welfare
            WELFARE                   EMPLOYEE
SAFETY      MEASURES                  MORALE
                         measure on
                         morale

                                              WORK
INFRA         CREDIT           INTER          ENVIRONMENT
STRUCTURE     FACILITY         RELATIOSHIP
16


                                 CHAPTER-3


                     OBJECTIVES OF THE STUDY


•   To study and analyze the safety and welfare measures of the employee.


•   To evaluate the effect of the welfare measures on employee morale.


•   To evaluate the satisfaction level of employee about the work environment.


•   To find the level of satisfaction of employee about the facilities given by the

    company.
17


                                     CHAPTER -4

                            RESEARCH METHODOLOGY


4.1 RESEARCH – MEANING

       Research is an art of scientific investigation. According to Redmen and Mary
defines research as a “systematic effort to gain knowledge”.

       Research methodology is way to systematically solve the research problem. It is a
plan of action for a research project and explains in detail how data are collected and
analyzed. This research study is a descriptive research study.


4.2 RESEARCH DESIGN

       A research design is a plan that specifies the objectives of the study, method to be
adopted in the data collection, tools in data analysis and hypothesis to be framed.

       “A research design is an arrangement of condition for collection and analysis of
data in a manner that aims to combine relevance to research purpose with economy in
procedure”.

4.3 NATURE OF DATA

4.3.1 Primary data

       The primary data are collected from the employees of HIDESIGN through a direct
structured questionnaire.

4.3.2 Secondary data

       Company profiles, websites, magazines, articles were used widely as a support to
primary data.

4.4 SAMPLING SIZE AND TECHNIQUE

4.4.1 Size of the sample

       It refers to the number of items to be selected from the universe to constitute as a
sample. In this study 50 employees of HIDESIGN in Puducherry was selected as size of
sample.
18

4.4.2 Sample design

         The sampling technique used in this study is simple random sampling method.
This method is also called as the method of chance selection. Each and every item of
population has equal chance to be included in the sample.

4.4.3 Population design

         The population of this study is the total employee in the company. It is finite
population. There are four production centers for the organization for this study I have
taken only employees in one production centre.

4.4.3 Questionnaire

         The questions are arranged logical sequence. The questionnaire consists of a
variety of questions presented to the employees for the response. Dichotomous questions,
multiple choice questions, rating scale questions were used in constructing questionnaire.


4.5 STATISTICAL TOOLS USED

         To analyze and interpret collected data the following statistical tools were used.
     1) Percentage method
     2) Weighted average method
     3) Chi-square analysis
     4) Correlation
     5) Regression


4.5.1 Percentage method

                The percentage is used for making comparison between two or more series
of data. It is used to classify the opinion of the respondent for different factors. It is
calculated as


                                           No. of respondents favorable
                                                                             x 100
            Percentage of respondent =
                                           Total no of respondents
19

4.5.2 Weighted average method

        The weighted average method can be calculated by the following formula. This tool
is used to find the rank given by the respondents to the welfare measures. It can be
calculated as

                        XW = ∑ WX / ∑ X


          Here

                 XW represents the weighted average
                 X represents the value of variable
                 W represents the weight given to the variable.


4.5.3 Chi-square analysis

        Chi-square analysis in statistics is to test the goodness of fit to verify the
distribution of observed data with assumed theoretical distribution. Therefore it is a
measure to study the divergence of actual and expected frequencies.

        The formula for computing chi-square is as follows.

                      Chi-square = ∑ {(O-E)2 / E}


        The calculated value of chi-square is compared with the table of chi-square for the
given degrees of freedom at the specified level of significance. If the calculated value is
greater than the tabulated value then the difference between the observed frequency and
the expected frequency are significant. The degrees of freedom is (n-2) where ‘n’ is
number of observed frequencies and in case of contingency table the degrees of freedom is
(C-1)   (R-1) where C is number of columns and R is number of rows.

        It is used to find the relation between communication in work place and work
satisfaction. It is used to find the relation between welfare satisfaction and work
satisfaction it is used to find the relation between experience of respondents and work
satisfaction
20

4.5.4 Correlation

           The correlation analysis deals with association between two or more variables.
The correlation does not necessary imply causation or functional relationship though the
existence of causation always implies correlation. By itself it establishes only co- variance.
It is used to find the degree of relationship between motivation and work satisfaction.

                    Cov(x, y) = 1/n ∑ x y – x y
                     σx = √1/n Σ x2 – x 2

                     σy = √1/n Σ y2 – y 2
                            Cov(x, y)
                     r=      σx X σy


Here,
     r = co-efficient of correlation


4.5.5 Regression

               The Regression analysis deals with the nature of association between two or
more variables. In regression analysis we are concerned with the estimation of one variable
for a given value of another variable on the basis of an average mathematical relationship
between the two variables.

                            Y= a + bX
21


                            CHAPTER- 5

        DATA ANALYSIS AND INTERPRETATION


                              TABLE 5.1
                  EXPERIENCE OF RESPONDENT

       Experience              Frequency           Percentage (%)
0-1                                2                      4.0
2-5                                5                     10.0
6-10                               17                    34.0
Above 10                           26                    52.0
Total                              50                    100.0


Inference:
        From the table it infers that 52% of respondent are experienced above 10
years and 4% are less than one year.

                             CHART-5.1
                  EXPERIENCE OF RESPONDENT
22


             60


             50


             40
Percentage


             30


             20


             10


              0
                  0-1   2-5        6-10   above 10


                          Experience
23

                               TABLE 5.2
       LEVEL OF SATISFACTION OF SAFETY MEASURES

          Opinion              Frequency               Percentage (%)

  Highly satisfied                  1                       2.0

  Satisfied                         12                      24.0

  Neutral                           12                      24.0

  Dissatisfied                      19                      38.0

  Highly dissatisfied               6                       12.0

  Total                             50                     100.0


Inference:
       From the table it infers that 38%of respondent are dissatisfied with the
safety measures and 24% of respondent are satisfied.


                       CHART-5.2
       LEVEL OF SATISFACTION OF SAFETY MEASURES
24


             50


Percentage   40


             30


             20


             10


             0
                  Highly Satisfied               neutral              Highly dissatisfied
                                     Satisfied             Dissatisfied


                                            Safety Measures
25

                                                          TABLE 5.3
                        LEVEL OF SATISFACTION OF MEDICAL FACILITY


                     Opinion                           Frequency                  Percentage (%)

  Highly satisfied                                         10                              20.0

  Satisfied                                                28                              56.0

  Neutral                                                  3                                6.0

  Dissatisfied                                             6                               12.0

  Highly dissatisfied                                      3                                6.0

  Total                                                    50                             100.0

 Inference:
            From the table it infers that 56%of respondent are satisfied with the medical
facility and 12% of respondent are dissatisfied.

                                                         CHART 5.3
                        LEVEL OF SATISFACTION OF MEDICAL FACILITY


                60


                50


                40
   Percentage


                30


                20


                10


                0
                       Highly satisfied                  Neutral              Highly dissatisfied
                                           Satisfied               Dissatisfied


                                          Medical Facility in the Company
26

                                            TABLE 5.4
         LEVEL OF SATISFACTION OF WORKING ENVIRONMENT


                Opinion                     Frequency                       Percent
Satisfied                                      40                            80.0
Neutral                                         8                            16.0
Dissatisfied                                    2                             4.0
                                               50                            100.0
Total

Inference:
                      From the table it infers that 80%of respondent are satisfied with the
 working condition and 4% of respondent are dissatisfied.

                                            CHART 5.4
        LEVEL OF SATISFACTION OF WORKING ENVIRONMENT


                100


                80


                60
   Percentage


                40


                20


                 0
                                Satisfied       Neutral      Dissatisfied


                                 Working Environment in the Company
27

                                          TABLE 5.5
LEVEL OF SATISFACTION OF RELATIONSHIP BETWEEN SUPERVISOR
                                         AND WORKER


                    Opinion              Frequency          Percentage (%)

    Cordial                                 39                    78.0

    Moderate                                10                    20.0

    Indifference                             1                    2.0

    Total                                   50                   100.0

    Inference:
           From the table it infers that 78%of respondent are satisfied with the
   supervisor and 2% of respondent are dissatisfied.


                                          CHART 5.5
LEVEL OF SATISFACTION OF RELATIONSHIP BETWEEN SUPERVISOR
                                         AND WORKER


                    100


                     80


                     60
       Percentage


                     40


                     20


                     0
                               cordial           moderate     indifference


                              Relation Between Supervisor and Worker
28

                                 TABLE 5.6
LEVEL OF SATISFACTION OF RELATIONSHIP BETWEEN WORKERS

            Opinion              Frequency           Percentage (%)

                                      41                   82.0
    Cordial
                                      8                    16.0
    Moderate
                                      1                    2.0
    Indifference
                                      50                  100.0
    Total


     Inference:
            From the table it infers that 82%of respondent are satisfied with the
  workers and 2% of respondent are dissatisfied.


                                 CHART 5.6
LEVEL OF SATISFACTION OF RELATIONSHIP BETWEEN WORKERS
29


             100


             80


             60
Percentage


             40


             20


              0
                   Cordial           Moderate      Indifference


                             Relation Between Workers
30

                               TABLE 5.7
         LEVEL OF MOTIVATION GIVEN TO EMPLOYEE

         Opinion                   Frequency        Percentage (%)
  Very high                             7                 14.0
  High                                 17                 34.0
  Moderate                             12                 24.0
  Low                                  10                 20.0
  Very low                              4                  8.0
  Total                                50                100.0


  Inference:
        From the table it infers that 14%of respondent are highly motivated and 8%
of respondent are not motivated.


                               CHART 5.7
         LEVEL OF MOTIVATION GIVEN TO EMPLOYEE
31


             40


             30

Percentage


             20


             10


             0
                  very high    high     moderate     low     very low


                              Motivation given to Employee
32

                                                 TABLE 5.8
                       LEVEL OF FREEDOM GIVEN TO THE EMPLOYEES


        Opinion                                 Frequency                       Percentage (%)
Very High                                            2                                 4
High                                                11                                22
Moderate                                            15                                30
Low                                                 18                                36
Very Low                                             4                                 8
Total                                               50                               100

Inference:
                From the table it infers that 22% of the respondent feels that freedom given to them
to express their ideas is high and 36% of the feel as low.

                                                 CHART 5.8
                       LEVEL OF FREEDOM GIVEN TO THE EMPLOYEES

                40


                30
   Percentage


                20


                10


                 0
                        Very high     High     Moderate     Low      Very low


                                    Freedom to express thier ideas
33


                                            TABLE 5.9
           STATUS OF GRIEVANCE HANDLING IN THE COMPANY


                 Opinion                      Frequency                   Percentage
Always                                            10                          20
Sometimes                                         20                          40
Rarely                                            13                          26
Never                                              7                          14
Total                                              50                         100

  Inference:
                     From the table we infer that 40% of the respondents are satisfied with the
  grievance handling and 14% of the respondents are dissatisfied.


                                          CHART 5.9
           STATUS OF GRIEVANCE HANDLING IN THE COMPANY


                     50


                     40


                     30
        Percentage


                     20


                     10


                      0
                                alw ays    sometimes      rarely      never


                                     Grievance Handling in the Company
34

                                       TABLE 5.10
                WORK SATISFACTION LEVELOF THE EMPLOYEE


               Opinion                Frequency              Percent

Always                                   23                    46.0

Sometimes                                23                    46.0

Rarely                                    4                     8.0

Total                                    50                   100.0

Inference:
                From the table it infers that 46%of respondent are always satisfied with
work and 8% of respondent are rarely satisfied.


                                        CHART 5.10

               WORK SATISFACTION LEVEL OF THE EMPLOYEE


               60


               50


               40
  Percentage


               30


               20


               10


                0
                            alw ays           sometimes        rarely


                               Work Satisfaction of the Employees
35

                                          TABLE 5.11
 SATISFACTION OF EMPLOYEES ABOUT WELFARE MEASURES


                   Opinion                    Frequency               Percentage (%)

                                                 33                        66.0
Yes
                                                 17                        34.0
No
                                                 50                       100.0
Total


Inference:
                        From the table it infers that 33%of respondent are always satisfied with
welfare and 34% of respondent are not satisfied.


                                              CHART 5.11
 SATISFACTION OF EMPLOYEES ABOUT WELFARE MEASURES


                   70


                   60


                   50
      Percentage


                   40


                   30


                   20


                   10


                    0
                                        yes                      no


                                         Satisfaction about Welfare
36

ANALYSIS OF OPINION OF RESPONDENTS REGARDING COMMUNICATION
            IN WORK PLACE AND WORK SATISFACTION
                       (USING CHI-SQUARE)


  Observed count

                                    TABLE 5.12.1
            Opinion        Always       Sometimes        Rarely        Total
        Cordial               9             5              0            14
        Moderate              9             6              6            21
        Indifference          7             7              1            15
        Total                25            18              7            50

   Expected count

                                    TABLE 5.12.2
           Opinion        Always       Sometimes        Rarely          Total
         Cordial             7             5              2              14
         Moderate          10.5           7.6            2.9             21
         Indifference       7.5           5.4            2.1             15
         Total              25            18              7              50


Null Hypothesis:

           H0: There is no significant difference between communication in work place
and work satisfaction.


                             CHI-SQUARE TESTS
                                    TABLE 5.12.3
                 O             E              (O-E)2              (O-E)2/E
                 9             7                 4                  0.57
                 5             5                 0                    0
                 0             2                 4                    2
                 9           10.5              2.25                 0.21
                 6            7.6              2.56                 0.34
                 6            2.9              9.61                 3.31
                 7            7.5              0.25                 0.03
                 7            5.4              2.56                 0.47
                 1            2.1              1.21                 0.58
37

                Calculated value = ∑ (O-E) 2 / E = 7.51
                Degrees of Freedom = (R -1) (C-1) = 4
                Tabulated value for 4 degrees of freedom at 5% level of significance is
        9.48


   Inference:

                The calculated value is less than the tabulated value. H0 is accepted.
Therefore there is no association between communication in work place and work
satisfaction.
38

     ANALYSIS OF OPINION OF RESPONDENTS REGARDING WELFARE
                    SATISFACTION AND WORK SATISFACTION
                                 (USING CHI-SQUARE)

Observed count:

                                TABLE 5.13.1
        Opinion      Always           Sometimes             Rarely      Total
        Yes            20                12                   1          33
        No              7                 6                   4          17
        Total          27                18                   5          50

Expected count:

                                TABLE 5.13.2
        Opinion      Always           Sometimes             Rarely      Total
        Yes           17.8              11.9                 3.3         33
        No             9.2               6.1                 1.7         17
        Total          27                18                   5          50

Null Hypothesis:
        H0: There is no significant difference between welfare satisfaction and work
satisfaction.
                                 CHI-SQUARE TESTS
                                     TABLE 5.13.3

                     O                E            (O-E)2            (O-E)2/E
                     20             17.8            4.84               0.27
                     12             11.9            0.01                 0
                      1              3.3            5.29               1.60
                      7              9.2            4.84               0.53
                      6              6.1            0.01                 0
                      4              1.7            5.29               3.11


                Calculated value = ∑ (O-E) 2 / E = 5.51
                Degrees of Freedom = (R -1) (C-1) = 2
                Tabulated value for 2 degrees of freedom at 5% level of significance is 5.99

 Inference:
39


       The calculated value is less than the tabulated value. H0 is accepted. Therefore there
is no association between welfare satisfaction and work satisfaction.


 ANALYSIS OF OPINION OF RESPONDENTS REGARDING EXPERIENCE OF
              RESPONDENT AND WORK SATISFACTION
                       (USING CHI-SQUARE)


Observed count:

                              TABLE 5.14.1
       Opinion          Always     Sometimes       Rarely         Total
       0-1                 1           1             0              2
       2-5                 2           2             1              5
       6-10                6          10             1             17
       Above 10           14          10             2             26
       Total              23          23             4             50


Expected count:

                              TABLE 5.14.2
       Opinion          Always     Sometimes       Rarely         Total
       0-1                0.9         0.9           0.2             2
       2-5                2.3         2.3           0.4             5
       6-10               7.8         7.8           1.4            17
       Above 10           12          12            2.1            26
       Total              23          23             4             50


Null Hypothesis:
           H0: There is no significant difference between experience of respondent and
work satisfaction.
40

                               CHI-SQUARE TESTS
                                   TABLE 5.14.3

                    O                E            (O-E)2         (O-E)2/E
                     1              0.9            0.01            0.01
                     1              0.9            0.01            0.01
                     0              0.2            0.04             0.2
                     2              2.3            0.09            0.04
                     2              2.3            0.09            0.04
                     1              0.4            0.36             0.9
                     6              7.8            3.24            0.41
                    10              7.8             4.8            0.62
                     1              1.4            0.16            0.11
                    14              12               4             0.33
                    10              12               4             0.33
                     2              2.1            0.01           0.004


               Calculated value = ∑ (O-E) 2 / E = 3
               Degrees of Freedom = (R -1) (C-1) = 6
               Tabulated value for 6 degrees of freedom at 5% level of significance is
       12.59


 Inference:

           The calculated value is less than the tabulated value. H 0 is accepted. Therefore
there is no association between experience of the respondent and work satisfaction
41

       ANALYSIS OF OPINION OF RESPONDENTS REGARDING
    MOTIVATION GIVEN TO EMPLOYEE AND WORK SATISFACTION
                    (USING CORRELATION)


Observed Count

                                   TABLE 5.15.1

    OPINION

                        ALWAYS          SOMETIMES        NEVER    TOTAL

   FACTORS
MOTIVATION(X)              24                 12          14           50

WORK                       28                 19           3           50
SATISFACTION(Y)


                           CORRELATION TABLE
                                   TABLE 5.15.2


     X              Y                   X2          Y2           XY

     24            28                   576         784          672

     12            19                   144         361          228

     14             3                   196          9           42

                  Cov(x, y) = 1/n ∑ x y – x y
                          = 1/3 (942-278)
                                 = 35

                   σx = √1/n Σ x2 – x 2
                        = √1/3(916-278)
                        = 5.14

                   σy = √1/n Σ y2 – y 2
                        = √ 1/3(1154-278)
                        =10.28
42


                          Cov(x, y)
                     r=    σx X σy
                          = 0.66


Inference:

             The motivation given to employees and work satisfaction are positively
correlated. The increase in motivation will increase the work satisfaction also.
43


       ANALYSIS OF RANKING GIVEN BY RESPONDENTS REGARDING
                SATISFACTION OF WELFARE MEASURES
                 (USING WEIGHTED AVERAGE METHOD)


Observed Count

                                          TABLE 5.16.1
    OPINION

                       SATISFIED NEUTRAL DISSATISFIED                      TOTAL

   FACTORS
MEDICAL                     35               4              11                50
FACILITY
INFRA                       27               9              14                50
STRUCTURE
CANTEEN                     21               9              14                50
FACILITY
CREDIT                      26               10             14                50
FACILITY


                             WEIGHTED AVERAGE TABLE
                                          TABLE 5.16.2
                                                      FACTORS
                               Medical           Infra      Canteen           Credit
RANK         WEIGHTS
                               Facility       structures    Facility          Facility
                                                Facility
   X              W           X1       WX1    X2      WX2  X3     WX3       X4       WX4
   1              3           35       105    27       81  21      63       26        78
   2              2            4         8     9       18  14      28       10        20
   3              1           11        14    14       14  15      15       14        14
        TOTAL                 50       124    50      113  50     106       50       112
         CW                        2.48           2.26        2.12               2.24
        RANK                         1              2           4                  3

                CW (CALCULATED WEIGHT) = ∑ WXn / ∑ Xn

Inference:

                From the table it is inferred that employees ranks medical facility followed
by infra structure with the canteen facility as last.
44

     ANALYSIS OF OPINION GIVEN BY RESPONDENTS REGARDING
   SATISFACTION OF WELFARE MEASURES AND EMPLOYEE MORALE
                        (USING REGRESSION METHOD)


       Let X be the morale of the employee
       Let Y be the satisfaction of welfare measures.

Observed Count

                                   TABLE 5.17.1

         OPINION

                            SATISFIED        NEUTRAL           DISSATISFIED

        FACTORS
     EMPLOYEE
                                 116                36                 48
     MORALE(X)
     WELFARE                      28                19                 13
     MEASURES(Y)


                              REGRESSION TABLE
                                 TABLE 5.17.2
                                                                            (X-X)
                                                2                      2
           X            Y        X-X      X-X            Y-Y     Y-Y        (Y-Y)

          116          28         49       2440          11      130        563

           36           9        -31       936           -8      58         233

           48          13        -19       346           -4      13          67


     Formula
45


               bxy = ∑ ( x-x )( y-y )

                       ∑ ( x-x )2
                   = 863/201
                   = 4.29


    Regression Equation

             X-X = bxy (Y-Y)
             X = 4.3Y -6.1


Inference:

        Excluding the constant, from the above equation we can infer that effect of
welfare measure on morale is measure is found as1:4. Therefore we can conclude that the
effect of welfare measure on employee morale is about 25%.
46


                                       CHAPTER -6


6.1 FINDINGS OF THE STUDY


        Most of the employees in the company are female. More than 50% of respondent
are working for more than 10 years. Most of the respondents are highly satisfied with the
medical facility. Most of the respondents are dissatisfied with the safety measure and only
few are satisfied.

        Most of the employees are satisfied with the working condition. Most of the
respondents are satisfied with the motivation given by the company. Most of the
respondents are satisfied with the relation between supervisor and workers. Most of the
employees are satisfied with the relation between workers.

        Most of the respondents are satisfied with the work. Most of the respondents are
satisfied with the welfare measures. Most of the respondents are satisfied with the canteen
facility. Most of the respondents are satisfied with the credit facility.

        The communication in work place has no effect on work satisfaction. The welfare
measure satisfaction has no effect on work satisfaction. The increase in employee
motivation will increase the work satisfaction. The effect of welfare measures is about
25% on employee morale.
47


6.2 SUGGESIONS AND RECOMMENDATIONS


      •   Since most of the employees are married the company can concentrate on
          crèche facility.
      •   The company can improve the grievance handling system so that they can
          increase the employee satisfaction.
      •   The company can provide safety equipments to the employees.
      •   The salary increment for employees will increase the employee satisfaction
          and which in turn increase the employee morale.
48


                                     CHAPTER - 7
                                     CONCLUSION


                      The study on effect of welfare measure on employee morale helps
the management to know the satisfaction level of the employees about the welfare measure
provided by the company. From this study we can infer that the majority of the employees
are satisfied with the welfare measures. The company can concentrate on other facility like
crèche facility, uniform, and safety measures to boost the employee morale. The employee
morale is good in the company. It is found that the effect of welfare measure on employee
morale in this study is about 25%.
49


                                       CHAPTER -8


8.1 LIMITATIONS OF THE STUDY

  •   The time period of the study is very short, so elaborate study was not made.

  •   Only certain factors are considered in this study to measure the effect of welfare

      measure on employee morale.

  •   The conclusions and suggestions were formed based on employee’s spot response.

  •   Some false information may be given by the employee
50


8.2 SCOPE FOR FURTHER STUDY

  •   The sample size taken for this study is only 50, it can be extended to a larger

      sample

  •   The study can be done by considering some other factors to measure the employee

      morale

  •   This study can be used to measure the satisfaction level of employee.

  •   This study can also be extended to the other production centers of the company.
51


                                     APPENDICES
                                        ANNEXURE -1
A STUDY ON EFFECT OF WELFARE MEASURES ON EMPLOYEE
                                               MORALE
                                    QUESTIONNAIRE


PERSONAL DATA
   1. Name               :
   2. Age                :
      (a) 18-25      (b) 26-35     (c) 36-45        (d) Above 45
   3. Gender             :
      (a) Male                             (b) Female
   4. Educational Qualification            :
      (a) Below Hr Sec         (b) Hr Sec           (c) UG         (d) PG
   5. Experience         :
      (a) 0-1 Yrs            (b) 1-5 Yrs            (c) 5-10 Yrs        (d) Above 10 Yrs
   6. Total Salary       :
   7. Designation        :
   8. Safety Measures                      :
        8.1.          Are you satisfied with the safety appliances in work place?
               a) Highly satisfied b) Satisfied c) Neutral d) Dissatisfied
               e) Highly Dissatisfied
   9. Medical Facility
        9.1 Specify the level of satisfaction
            a) Highly satisfied b) Satisfied c) Neutral d) Dissatisfied
            e) Highly Dissatisfied
        9.2 Is there any periodical medical check up given to you
               (a) Yes                     (b) No
10. ESI Benefits         :
        10.1 Do you have ESI car
               (a) Yes                     (b) No
        10.2 Do you get all the ESI benefits?
                (a) Yes                        (b) No
52

11. Canteen facility
               Specify the level of satisfaction
                  Highly                                                          Highly
                                   Satisfied         Neutral     Dissatisfied
                 Satisfied                                                      Dissatisfied
Cleanliness
 Hygienic
 Serving
   Price

12. Credit facility
       12.1. Is any Advances and loan given to you are satisfied
              (a) Very high b) high c) moderate d) low e) very low


Specify the level of satisfaction of other allowances
                               Highly                                             Highly
                                         Satisfied    Neutral    Dissatisfied
                             Satisfied                                          Dissatisfied
 Transport allowance
Attendance allowance
Punctuality allowance
Education allowance

13. Infra-structural facility :
        Specify the level of satisfaction

                      Highly                                                      Highly
                                   Satisfied         Neutral     Dissatisfied
                  Satisfied                                                     Dissatisfied
  Rest room
Drinking water
 Ventilation
   Lighting
    Toilets
   Working
 environment
Transportation
14. Inter-relationship:

     14.1. Relationship between co-workers

         (a) Cordial         (b) Moderate      (c) Indifferent

     14.2. Relationship between supervisor and workers.
53

         (a) Cordial      (b) Moderate        (c) Indifferent

      14.3. Level of communication between supervisor and employee

         (a) High (b) Very high (c) Low (d) Very low (e)Moderate

15. Level of motivation given to employee

        (a) High     b) Very high (c) Low (d) Very low (e) Moderate

16. Are u informed about all the management policies?

        (a) Always     (b) Sometimes     (c) Rarely      (d) Never

17. Does the management solve all your grievances?

        (a) Always     (b) Sometimes     (c) Rarely      (d) Never

18. Level of freedom to express your ideas?

        (a) High (b) Very high (c) Low (d) Very low (e) Moderate

19. Are you satisfied with the work you do.

       (a) Always      (b) Sometimes     (c) Rarely     (d) Never

20. In general are you satisfied with the welfare and safety measures given by
        Management?

         (a) Yes                       (b) No

21. Suggestion for Improvements
54


                                     ANNEXURE-2

                                    BIBLIOGRAPHY


BOOKS

1. Kothari C.R., Research methodology, published by Tata Mc Graw-Hill Publishing
Company Ltd., 13th Edition, 1982.
2. Gupta, S.P., and Gupta, M.P., Business Statistics, Published by Sultan Chand & Sons,
7th Edition, 1989.
3. Personnel Management by C.B.Mamoria & S.V.Gankar, Published by Himalaya
Publishing House.


WEBSITES

1. www.ncr.com

Más contenido relacionado

La actualidad más candente

project report employee welfare (mithun kumar sheel
project report employee welfare (mithun kumar sheelproject report employee welfare (mithun kumar sheel
project report employee welfare (mithun kumar sheelmithun sheel
 
Lic training and development(s@n@nd)
Lic training and development(s@n@nd)Lic training and development(s@n@nd)
Lic training and development(s@n@nd)sanandsachidanandan
 
case analysis mahindra and mahindra and nokia (Trade unions)
case analysis mahindra and mahindra and nokia (Trade unions)case analysis mahindra and mahindra and nokia (Trade unions)
case analysis mahindra and mahindra and nokia (Trade unions)Sakshi Sharma
 
Project on labour welfare at wcl
Project on labour welfare at wclProject on labour welfare at wcl
Project on labour welfare at wclProjects Kart
 
Project Report on Labour Welfare Planning, summer internship MBA HR
Project Report on Labour Welfare Planning, summer internship MBA HRProject Report on Labour Welfare Planning, summer internship MBA HR
Project Report on Labour Welfare Planning, summer internship MBA HRDigvijay V. Jaykar
 
hr practices in ford & hyundai
hr practices in ford & hyundaihr practices in ford & hyundai
hr practices in ford & hyundaiGarima Kumari
 
Employee retention strategy in bpo industry
Employee retention strategy in bpo industryEmployee retention strategy in bpo industry
Employee retention strategy in bpo industryDamyanti Vaishnav
 
A study on grievance management system conducted at abc pvt ltd
A study on grievance management  system conducted at abc pvt ltdA study on grievance management  system conducted at abc pvt ltd
A study on grievance management system conducted at abc pvt ltdProjects Kart
 
employee retention project Questionnaire pdf
employee retention project Questionnaire pdfemployee retention project Questionnaire pdf
employee retention project Questionnaire pdfashwin bas
 
A project report on labour welfare
A project report on labour welfareA project report on labour welfare
A project report on labour welfareProjects Kart
 
Study On Automobile Market of India
Study On Automobile Market of India Study On Automobile Market of India
Study On Automobile Market of India Priyank Thada
 
Questionnaire on training and development
Questionnaire on training and developmentQuestionnaire on training and development
Questionnaire on training and developmentSusmitha Chowdary
 
Case study of toyata industrial dispute
Case study of toyata industrial dispute Case study of toyata industrial dispute
Case study of toyata industrial dispute Devesh Hari
 

La actualidad más candente (20)

project report employee welfare (mithun kumar sheel
project report employee welfare (mithun kumar sheelproject report employee welfare (mithun kumar sheel
project report employee welfare (mithun kumar sheel
 
LIC HR POLICIES
LIC HR POLICIESLIC HR POLICIES
LIC HR POLICIES
 
Lic training and development(s@n@nd)
Lic training and development(s@n@nd)Lic training and development(s@n@nd)
Lic training and development(s@n@nd)
 
IR Case Study
IR Case StudyIR Case Study
IR Case Study
 
case analysis mahindra and mahindra and nokia (Trade unions)
case analysis mahindra and mahindra and nokia (Trade unions)case analysis mahindra and mahindra and nokia (Trade unions)
case analysis mahindra and mahindra and nokia (Trade unions)
 
Project on labour welfare at wcl
Project on labour welfare at wclProject on labour welfare at wcl
Project on labour welfare at wcl
 
Industrial Disputes
Industrial DisputesIndustrial Disputes
Industrial Disputes
 
Project Report on Labour Welfare Planning, summer internship MBA HR
Project Report on Labour Welfare Planning, summer internship MBA HRProject Report on Labour Welfare Planning, summer internship MBA HR
Project Report on Labour Welfare Planning, summer internship MBA HR
 
Impact of leadership style on employee performance "A Study on Uttara Bank"
Impact of leadership style on employee performance "A Study on Uttara Bank"  Impact of leadership style on employee performance "A Study on Uttara Bank"
Impact of leadership style on employee performance "A Study on Uttara Bank"
 
hr practices in ford & hyundai
hr practices in ford & hyundaihr practices in ford & hyundai
hr practices in ford & hyundai
 
Welfare administration
Welfare administrationWelfare administration
Welfare administration
 
Employee retention strategy in bpo industry
Employee retention strategy in bpo industryEmployee retention strategy in bpo industry
Employee retention strategy in bpo industry
 
Gobinda Chandra Das FCA
Gobinda Chandra Das FCAGobinda Chandra Das FCA
Gobinda Chandra Das FCA
 
A study on grievance management system conducted at abc pvt ltd
A study on grievance management  system conducted at abc pvt ltdA study on grievance management  system conducted at abc pvt ltd
A study on grievance management system conducted at abc pvt ltd
 
employee retention project Questionnaire pdf
employee retention project Questionnaire pdfemployee retention project Questionnaire pdf
employee retention project Questionnaire pdf
 
A project report on labour welfare
A project report on labour welfareA project report on labour welfare
A project report on labour welfare
 
Study On Automobile Market of India
Study On Automobile Market of India Study On Automobile Market of India
Study On Automobile Market of India
 
Questionnaire on training and development
Questionnaire on training and developmentQuestionnaire on training and development
Questionnaire on training and development
 
Case study of toyata industrial dispute
Case study of toyata industrial dispute Case study of toyata industrial dispute
Case study of toyata industrial dispute
 
Questionnaire on Performance Management System
Questionnaire on Performance Management SystemQuestionnaire on Performance Management System
Questionnaire on Performance Management System
 

Destacado

A study on employee welfare measures in arignar anna sugar mills,tanjore
A study on employee welfare measures in arignar anna sugar mills,tanjoreA study on employee welfare measures in arignar anna sugar mills,tanjore
A study on employee welfare measures in arignar anna sugar mills,tanjoreN K7
 
Employee welfare measures
Employee welfare measuresEmployee welfare measures
Employee welfare measuresVijesh Koottar
 
EMPLOYEE WELFARE FACILITY
EMPLOYEE WELFARE FACILITY EMPLOYEE WELFARE FACILITY
EMPLOYEE WELFARE FACILITY GANESH AWATADE
 
Employee welfare facility upload
Employee welfare facility uploadEmployee welfare facility upload
Employee welfare facility uploadGANESH AWATADE
 
welfare activity at mahindra and mahindra ltd, nashik
welfare activity at mahindra and mahindra ltd, nashikwelfare activity at mahindra and mahindra ltd, nashik
welfare activity at mahindra and mahindra ltd, nashikSaket Rathi
 
Project report on training and development
Project report on training and developmentProject report on training and development
Project report on training and developmentYOGENDRA RAGHAV
 
statutory and non-statutory welfare measure
statutory and non-statutory welfare measurestatutory and non-statutory welfare measure
statutory and non-statutory welfare measureMuthukannan160899
 
Final employee welfare schemes
Final employee welfare schemesFinal employee welfare schemes
Final employee welfare schemesAditya Suresh
 
uma final project 1.06.2016
uma final project  1.06.2016uma final project  1.06.2016
uma final project 1.06.2016uma mano
 
Study on Employee Involvement & Welfare Measures at ABNL
Study on Employee Involvement & Welfare Measures at ABNLStudy on Employee Involvement & Welfare Measures at ABNL
Study on Employee Involvement & Welfare Measures at ABNLKrishna Kumar C
 
Impact of welfare facilities on employee satisfaction @ forbes project report
Impact of welfare facilities on employee satisfaction @ forbes project reportImpact of welfare facilities on employee satisfaction @ forbes project report
Impact of welfare facilities on employee satisfaction @ forbes project reportBabasab Patil
 
Welfare facilities and employee satisfaction in hll project report mba
Welfare facilities and employee satisfaction in hll project report mbaWelfare facilities and employee satisfaction in hll project report mba
Welfare facilities and employee satisfaction in hll project report mbaBabasab Patil
 
employee welfare at mysore sandals
employee welfare at mysore sandalsemployee welfare at mysore sandals
employee welfare at mysore sandalsNeenu Wahid
 
Trainingdevelopmentdhanu 120823041856-phpapp01
Trainingdevelopmentdhanu 120823041856-phpapp01Trainingdevelopmentdhanu 120823041856-phpapp01
Trainingdevelopmentdhanu 120823041856-phpapp01Vish Rughoobur
 
Social welfare initiatives in JSW
Social welfare initiatives in JSWSocial welfare initiatives in JSW
Social welfare initiatives in JSWJayashree Prabhu
 
Employee Absenteeism and Welfare Measures
Employee Absenteeism and Welfare MeasuresEmployee Absenteeism and Welfare Measures
Employee Absenteeism and Welfare MeasuresShweta Sajjanar
 
Employee welfare scheme hr hero motors & other companies (1) (1)
Employee welfare scheme hr   hero motors & other companies (1) (1)Employee welfare scheme hr   hero motors & other companies (1) (1)
Employee welfare scheme hr hero motors & other companies (1) (1)11ice047
 
summer-training-report-on-employees-welfare-activities-at-godrej
summer-training-report-on-employees-welfare-activities-at-godrejsummer-training-report-on-employees-welfare-activities-at-godrej
summer-training-report-on-employees-welfare-activities-at-godrejAnita Sharma
 
Study on "Effect of Employee welfare measures on J.R.T rock products"
Study on "Effect of Employee welfare measures on J.R.T rock products"Study on "Effect of Employee welfare measures on J.R.T rock products"
Study on "Effect of Employee welfare measures on J.R.T rock products"abinmp8060
 

Destacado (20)

A study on employee welfare measures in arignar anna sugar mills,tanjore
A study on employee welfare measures in arignar anna sugar mills,tanjoreA study on employee welfare measures in arignar anna sugar mills,tanjore
A study on employee welfare measures in arignar anna sugar mills,tanjore
 
Chapter ii
Chapter iiChapter ii
Chapter ii
 
Employee welfare measures
Employee welfare measuresEmployee welfare measures
Employee welfare measures
 
EMPLOYEE WELFARE FACILITY
EMPLOYEE WELFARE FACILITY EMPLOYEE WELFARE FACILITY
EMPLOYEE WELFARE FACILITY
 
Employee welfare facility upload
Employee welfare facility uploadEmployee welfare facility upload
Employee welfare facility upload
 
welfare activity at mahindra and mahindra ltd, nashik
welfare activity at mahindra and mahindra ltd, nashikwelfare activity at mahindra and mahindra ltd, nashik
welfare activity at mahindra and mahindra ltd, nashik
 
Project report on training and development
Project report on training and developmentProject report on training and development
Project report on training and development
 
statutory and non-statutory welfare measure
statutory and non-statutory welfare measurestatutory and non-statutory welfare measure
statutory and non-statutory welfare measure
 
Final employee welfare schemes
Final employee welfare schemesFinal employee welfare schemes
Final employee welfare schemes
 
uma final project 1.06.2016
uma final project  1.06.2016uma final project  1.06.2016
uma final project 1.06.2016
 
Study on Employee Involvement & Welfare Measures at ABNL
Study on Employee Involvement & Welfare Measures at ABNLStudy on Employee Involvement & Welfare Measures at ABNL
Study on Employee Involvement & Welfare Measures at ABNL
 
Impact of welfare facilities on employee satisfaction @ forbes project report
Impact of welfare facilities on employee satisfaction @ forbes project reportImpact of welfare facilities on employee satisfaction @ forbes project report
Impact of welfare facilities on employee satisfaction @ forbes project report
 
Welfare facilities and employee satisfaction in hll project report mba
Welfare facilities and employee satisfaction in hll project report mbaWelfare facilities and employee satisfaction in hll project report mba
Welfare facilities and employee satisfaction in hll project report mba
 
employee welfare at mysore sandals
employee welfare at mysore sandalsemployee welfare at mysore sandals
employee welfare at mysore sandals
 
Trainingdevelopmentdhanu 120823041856-phpapp01
Trainingdevelopmentdhanu 120823041856-phpapp01Trainingdevelopmentdhanu 120823041856-phpapp01
Trainingdevelopmentdhanu 120823041856-phpapp01
 
Social welfare initiatives in JSW
Social welfare initiatives in JSWSocial welfare initiatives in JSW
Social welfare initiatives in JSW
 
Employee Absenteeism and Welfare Measures
Employee Absenteeism and Welfare MeasuresEmployee Absenteeism and Welfare Measures
Employee Absenteeism and Welfare Measures
 
Employee welfare scheme hr hero motors & other companies (1) (1)
Employee welfare scheme hr   hero motors & other companies (1) (1)Employee welfare scheme hr   hero motors & other companies (1) (1)
Employee welfare scheme hr hero motors & other companies (1) (1)
 
summer-training-report-on-employees-welfare-activities-at-godrej
summer-training-report-on-employees-welfare-activities-at-godrejsummer-training-report-on-employees-welfare-activities-at-godrej
summer-training-report-on-employees-welfare-activities-at-godrej
 
Study on "Effect of Employee welfare measures on J.R.T rock products"
Study on "Effect of Employee welfare measures on J.R.T rock products"Study on "Effect of Employee welfare measures on J.R.T rock products"
Study on "Effect of Employee welfare measures on J.R.T rock products"
 

Similar a Effectofwelfaremeasuresonemployeemorale

Training and Development in KAL
Training and Development in KALTraining and Development in KAL
Training and Development in KALMidhin Manoharan
 
Employee perception towards .docx (1)
Employee perception towards .docx (1)Employee perception towards .docx (1)
Employee perception towards .docx (1)Ravi Dwivedy
 
Human resource
Human resourceHuman resource
Human resourceArun Kumar
 
Effectiveness of performance management system
Effectiveness of performance management systemEffectiveness of performance management system
Effectiveness of performance management systemIAEME Publication
 
Effectiveness of performance management system
Effectiveness of performance management systemEffectiveness of performance management system
Effectiveness of performance management systemiaemedu
 
Effectiveness of performance management system
Effectiveness of performance management systemEffectiveness of performance management system
Effectiveness of performance management systemiaemedu
 
Effectiveness of performance management system
Effectiveness of performance management systemEffectiveness of performance management system
Effectiveness of performance management systemiaemedu
 
Erp implementation methodologies_ph_d_book
Erp implementation methodologies_ph_d_bookErp implementation methodologies_ph_d_book
Erp implementation methodologies_ph_d_booknages waran
 
It competencies a study on malaysian university oke
It competencies a study on malaysian university okeIt competencies a study on malaysian university oke
It competencies a study on malaysian university okeBambang Purwantho
 

Similar a Effectofwelfaremeasuresonemployeemorale (13)

Dhanasekaran - Copy
Dhanasekaran - CopyDhanasekaran - Copy
Dhanasekaran - Copy
 
Osram naman
Osram namanOsram naman
Osram naman
 
Training and Development in KAL
Training and Development in KALTraining and Development in KAL
Training and Development in KAL
 
Benchmarking
BenchmarkingBenchmarking
Benchmarking
 
Employee perception towards .docx (1)
Employee perception towards .docx (1)Employee perception towards .docx (1)
Employee perception towards .docx (1)
 
Human resource
Human resourceHuman resource
Human resource
 
Effectiveness of performance management system
Effectiveness of performance management systemEffectiveness of performance management system
Effectiveness of performance management system
 
Effectiveness of performance management system
Effectiveness of performance management systemEffectiveness of performance management system
Effectiveness of performance management system
 
Effectiveness of performance management system
Effectiveness of performance management systemEffectiveness of performance management system
Effectiveness of performance management system
 
Effectiveness of performance management system
Effectiveness of performance management systemEffectiveness of performance management system
Effectiveness of performance management system
 
EPP
EPPEPP
EPP
 
Erp implementation methodologies_ph_d_book
Erp implementation methodologies_ph_d_bookErp implementation methodologies_ph_d_book
Erp implementation methodologies_ph_d_book
 
It competencies a study on malaysian university oke
It competencies a study on malaysian university okeIt competencies a study on malaysian university oke
It competencies a study on malaysian university oke
 

Effectofwelfaremeasuresonemployeemorale

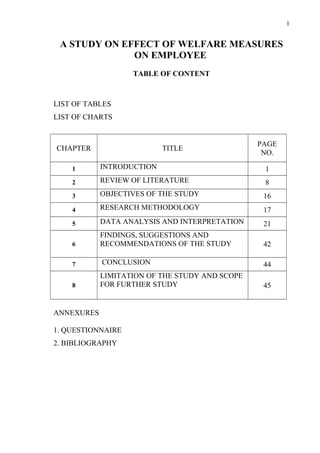
  • 1. 1 A STUDY ON EFFECT OF WELFARE MEASURES ON EMPLOYEE TABLE OF CONTENT LIST OF TABLES LIST OF CHARTS PAGE CHAPTER TITLE NO. 1 INTRODUCTION 1 2 REVIEW OF LITERATURE 8 3 OBJECTIVES OF THE STUDY 16 4 RESEARCH METHODOLOGY 17 5 DATA ANALYSIS AND INTERPRETATION 21 FINDINGS, SUGGESTIONS AND 6 RECOMMENDATIONS OF THE STUDY 42 7 CONCLUSION 44 LIMITATION OF THE STUDY AND SCOPE 8 FOR FURTHER STUDY 45 ANNEXURES 1. QUESTIONNAIRE 2. BIBLIOGRAPHY
  • 2. 2 LIST OF TABLES TABLE PAGE TITLE NO. NO. 5.1 EXPERIENCE OF RESPONDENT 21 5.2 LEVEL OF SATISFACTION OF SAFETY MEASURES 22 5.3 LEVEL OF SATISFACTION OF MEDICAL FACILITY 23 LEVEL OF SATISFACTION OF WORKING 5.4 ENVIRONMENT 24 LEVEL OF SATISFACTION OF RELATIONSHIP 5.5 BETWEEN SUPERVISOR AND WORKER 25 LEVEL OF SATISFACTION OF RELATIONSHIP 5.6 BETWEEN WORKERS 26 5.7 LEVEL OF MOTIVATION GIVEN TO EMPLOYEE 27 5.8 LEVEL OF FREEDOM GIVEN TO THE EMPLOYEES 28 STATUS OF GRIEVANCE HANDLING IN THE 5.9 COMPANY 29 5.10 WORK SATISFACTION LEVEL OF THE EMPLOYEE 30 SATISFACTION OF EMPLOYEES ABOUT WELFARE 5.11 MEASURES 31 ANALYSIS OF OPINION OF RESPONDENTS REGARDING COMMUNICATION IN WORK PLACE AND WORK SATISFACTION 5.12.1 (USING CHI-SQUARE) –OBSERVED COUNT TABLE 32 5.12.2 EXPECTED COUNT TABLE 32 5.12.3 CHI- SQUARE TABLE 32 ANALYSIS OF OPINION OF RESPONDENTS REGARDING WELFARE SATISFACTION AND WORK SATISFACTION (USING CHI-SQUARE) - OBSERVED 5.13.1 COUNT TABLE 34 5.13.2 EXPECTED COUNT TABLE 34 5.13.3 CHI- SQUARE TABLE 34 ANALYSIS OF OPINION OF RESPONDENTS REGARDING EXPERIENCE OF RESPONDENT AND WORK SATISFACTION (USING CHI-SQUARE) - 5.14.1 OBSERVED COUNT TABLE 35 5.14.2 EXPECTED COUNT TABLE 35
  • 3. 3 LIST OF TABLES PAGE TABLE TITLE NO. NO. 5.14.3 CHI- SQUARE TABLE 36 ANALYSIS OF OPINION OF RESPONDENTS REGARDING MOTIVATION GIVEN TO EMPLOYEE 5.15.1 AND WORK SATISFACTION (USING CORRELATION) 37 5.15.2 CORRELATION TABLE 37 ANALYSIS OF RANKING GIVEN BY RESPONDENTS REGARDING SATISFACTION OF WELFARE MEASURES (USING WEIGHTED AVERAGE 5.16.1 METHOD) 39 5.16.2 WEIGHTED AVERAGE TABLE 39 ANALYSIS OF OPINION GIVEN BY RESPONDENTS REGARDING SATISFACTION OF WELFARE MEASURES AND EMPLOYEE MORALE (USING 5.17.1 REGRESSION METHOD) 40 5.17.2 REGRESSION TABLE 40
  • 4. 4 LIST OF CHARTS PAGE CHART TITLE NO. NO. 5.1 EXPERIENCE OF RESPONDENT 21 5.2 LEVEL OF SATISFACTION OF SAFETY MEASURES 22 5.3 LEVEL OF SATISFACTION OF MEDICAL FACILITY 23 LEVEL OF SATISFACTION OF WORKING 5.4 ENVIRONMENT 24 LEVEL OF SATISFACTION OF RELATIONSHIP 5.5 BETWEEN SUPERVISOR AND WORKER 25 LEVEL OF SATISFACTION OF RELATIONSHIP 5.6 BETWEEN WORKERS 26 5.7 LEVEL OF MOTIVATION GIVEN TO EMPLOYEE 27 5.8 LEVEL OF FREEDOM GIVEN TO THE EMPLOYEES 28 STATUS OF GRIEVANCE HANDLING IN THE 5.9 COMPANY 29 5.10 WORK SATISFACTION LEVELOF THE EMPLOYEE 30 SATISFACTION OF EMPLOYEES ABOUT WELFARE 5.11 MEASURES 31
  • 5. 5 CHAPTER-1 INTRODUCTION 1.1 COMPANY PROFILE
  • 6. 6 1.2 INTRODUCTION TO THE STUDY The study was conducted in HIDESIGN in othiampet, puducherry to find the effect of welfare measures on employee morale. The study intends to see the satisfaction level of the employee on the facilities provided by the company and how these welfare measures boost the employee morale. The study on effect of welfare measure on employee morale gives the management an indication of the level of satisfaction among the employees regarding the general working condition and the other facilities provided by the organization. This helps the management to know the general morale of the employees.
  • 7. 7 CHAPTER -2 REVIEW OF LITERATURE Human Resource Management is the process of procuring, developing, maintaining, and controlling human resources for effective achievement of organizational goals. This project is focused on employee welfare measure and employee morale. 2.1 EMPLOYEE WELFARE – DEFINITION Employee welfare means “the effort to make life worth living for workmen”. When all basic facilities are provided and employees obtain satisfaction then the productivity can be increased and development of the organization will be possible CONDITIONS OF WORK ENVIRONMENT 1) Working conditions • Temperature • Ventilation • Lighting • Dust • Smoke • Fumes and gases • Noise • Humidity • Posture – simple • Hazard and safety complex devices 2) Factory Sanitation and Cleanliness: • Provision of urinals in factories • Provision of spittoons • Provision for the disposal of waste and rubbish • Provision for water disposal (drainage) • Provision of proper bathing and washing facilities
  • 8. 8 • Cleanliness, white- washing and repair of buildings and workshops • Care and maintenance of open spaces, gardens, roads, etc 3) Welfare Amenities • Provision and care of drinking water • Canteen services • Lunch • Rest room • Crèches • Cloak rooms • Other amenities 2.1.1 EMPLOYEES’ HEALTH SERVICES 1) Factory health services • Medical examination of employees • Factory dispensary and clinic treatment • First aid and ambulance room • Treatment of accidents and • Health education and research 2) Recreation • Playgrounds for physical recreation (athletics, games, gymnastics, etc) • Social and cultural recreation (music, singing, dancing, drama, etc) 3) Workers education • Education to improve skills and earning capacity • Literacy • Library, audio visual education, lecture programmes and • Workers educational scheme and its working 4) Economic Services • Employees’ co-operative societies • Grain shops and fair price shops and
  • 9. 9 • Housing co-operatives 5) Housing for employees and community services
  • 10. 10 6) Study of the working of welfare Acts • Factories Act • Employees state insurance act • Minimum wages act 7) Social Work in industrial Setting • Family Planning • Employee counseling 2.1.2 EMPLOYEE SERVICES AND BENEFITS These are concerned with the process of sustaining and maintaining the work force in an organization. They include 1) Safety provision inside the workshop 2) Employee counseling 3) The medical services 4) The recreational and other welfare facilities 5) Fringe benefits and supplementary items 2.1.3 EMPLOYEE MORALE - DEFINITION According to Yoder “morale is a feeling, somewhat related to esprit de corps, enthusiasm or zeal.Fippo has described morale “As a mental condition or attitude of individuals and groups which determines their willingness to co-operate. Good morale is evidenced by employee enthusiasm, voluntary conformance with regulations and orders, and a willingness to co-operate with others in the accomplishment of an organization’s objectives. 2.1.4 FACTORS AFFECTING MORALE According to McFarland, the important factors which have a bearing on morale are • The attitude of the executives and managers towards their subordinates. • working conditions, including pay, hours of work, and safety rules • effective leadership and an intelligent distribution of authority and responsibility in the organization • the design of the organization’s structure which facilities the flow of work and • The size of the organization.
  • 11. 11 2.1.5 CRITERIA THAT DETERMINES MORALE Several criteria seem important in the determination of levels of workers morale, such as • The organization itself • The nature of the work • The level of satisfaction • The supervision received • The perception of the self • Workers perception of the past awards and future opportunities for rewards • The employees age • The employee’s educational level and occupational level. 2.1.6 TYPES OF MORALE Morale is generally referred to as high morale. According to McFarland, “high morale exists when employee attitudes are favorable to the total situation of a group and to the attainment of its objectives low morale exists when attitudes inhibit the willingness and ability of an organization to attain its objectives High morale is represented by the use of such term spirit, zest, enthusiasm, loyalty, dependability and resistance to frustration. Low morale, on the other hand, is described by such words and phrases as apathy, bickering, jealously, pessimism, fighting, disloyalty to the organization, disobedience of the orders of the leaders, dislike of, or lack of interest in, one’s job, and laziness. 2.1.7 MORALE AND PERFORMANCE It has been pointed that “there is a little evidence in the available literature that employee attitudes bear any relationship to performance on the job. First, there are some who assert that high satisfaction leads to high performance. The “Hawthorne” studies of 1930s seem to support this view, as do findings of other studies.
  • 12. 12 Second, others take an opposite view. For example, Lyman Porter and Lawler say that satisfaction results from high performance, because most people experience satisfaction by accomplishing more tasks, like building a radio, or clinching a sale. Third, still others claim that there is no consistent relationship between morale and performance. Vroom found significant relationship between morale and performance in only 5 out of 22 studies undertaken by him. 2.1.8 WARNING SIGNS OF LOW MORALE Among the more significant of the warning signals of low morale are • High rate absenteeism • Tardiness • High Labour turnover • Strike and sabotage • Lack of pride in work and • Wastage and spoilage. 2.1.9 IMPROVING MORALE A three-fold action may be initiated. In the first place, it is essential to change the policy or to correct it immediately. Employees do not lose their respect for the boss who admits his mistakes but they cannot respect one who makes too many, and they may have contempt for one who refuses to admit his mistakes. Second, misconceptions should be removed, and the correct position should be explained to the employees. Third, a reasonable attempt should be made to educate and convince the employees.
  • 13. 13 2.2 REVIEW OF LITERATURE FROM JOURNALS AND ARTICLES Preserving Employee Morale during Downsizing Karen E. Mishra, Gretchen M. Spreitzer and Aneil K. Mishra Topic: Human Resource Management and Industrial Relations Reprint 3927; winter 1998, Vol. 39, No. 2, pp. 83–95 Mishra propose a four-stage approach to downsizing, gleaned from interviews and surveys that will retain workers' trust and sense of empowerment. The company should consider all stakeholders' needs — survivors, laid-off employees, the community, local and national press, and any affected government agencies. The implementation of all the above, is the most important. Management should communicate frequently and be open and honest. How to Boost Employee Morale By Betsy Gallup April 9, 2006 The following are the ways to boost the employee morale. • Treat employees with respect • Show interest in your employees' personal lives • Allow your employees to gain ownership of their jobs by being part of the decision-making process • Create a pleasant work environment • Establish an employee recognition program • Give clear direction and set priorities. • Stand behind your employees. Be their greatest advocate.
  • 14. 14 Boost Employee Morale with an Employee Incentive Program By: Trevor Marshall Good managers know from their own observations that employee attitude affects their work and eventually the company’s output. It is essential that your incentive program will actually inspire and motivate them to work efficiently and not just be competitive with each other. Healthy competition among the company’s employees is good but too much of it may also cause the company to disintegrate. The company should still be very much hands-on with the whole employee incentive program to ensure that the outcome of the employee incentive program will be good. Employee Welfare By Regina Barr Employee Welfare program is based on the management policy which is aimed shaping perfect employees. Therefore the concept of employee welfare includes to aspects namely physical and mental welfares 1. Applications of merit system or work performance system as the basis for employee rewarding. 2. Providing the retired employees with the old age allowance. 3. Employee insurance program to provide the employee with better security. 4. Improvement in health security for the employees and their families so that they can work confidently and productively. 5. Increase in basic salaries and pension as adjustment to the needs providing all work units and their officials with vehicles to help support smooth mobility.
  • 15. 15 2.3 DIAGRAMATIC REPRESENTATION OF THE STUDY JOB CANTEEN MEDICAL SATISFACTION FACILITY FACILITY MOTIVATION Effect of welfare WELFARE EMPLOYEE SAFETY MEASURES MORALE measure on morale WORK INFRA CREDIT INTER ENVIRONMENT STRUCTURE FACILITY RELATIOSHIP
  • 16. 16 CHAPTER-3 OBJECTIVES OF THE STUDY • To study and analyze the safety and welfare measures of the employee. • To evaluate the effect of the welfare measures on employee morale. • To evaluate the satisfaction level of employee about the work environment. • To find the level of satisfaction of employee about the facilities given by the company.
  • 17. 17 CHAPTER -4 RESEARCH METHODOLOGY 4.1 RESEARCH – MEANING Research is an art of scientific investigation. According to Redmen and Mary defines research as a “systematic effort to gain knowledge”. Research methodology is way to systematically solve the research problem. It is a plan of action for a research project and explains in detail how data are collected and analyzed. This research study is a descriptive research study. 4.2 RESEARCH DESIGN A research design is a plan that specifies the objectives of the study, method to be adopted in the data collection, tools in data analysis and hypothesis to be framed. “A research design is an arrangement of condition for collection and analysis of data in a manner that aims to combine relevance to research purpose with economy in procedure”. 4.3 NATURE OF DATA 4.3.1 Primary data The primary data are collected from the employees of HIDESIGN through a direct structured questionnaire. 4.3.2 Secondary data Company profiles, websites, magazines, articles were used widely as a support to primary data. 4.4 SAMPLING SIZE AND TECHNIQUE 4.4.1 Size of the sample It refers to the number of items to be selected from the universe to constitute as a sample. In this study 50 employees of HIDESIGN in Puducherry was selected as size of sample.
  • 18. 18 4.4.2 Sample design The sampling technique used in this study is simple random sampling method. This method is also called as the method of chance selection. Each and every item of population has equal chance to be included in the sample. 4.4.3 Population design The population of this study is the total employee in the company. It is finite population. There are four production centers for the organization for this study I have taken only employees in one production centre. 4.4.3 Questionnaire The questions are arranged logical sequence. The questionnaire consists of a variety of questions presented to the employees for the response. Dichotomous questions, multiple choice questions, rating scale questions were used in constructing questionnaire. 4.5 STATISTICAL TOOLS USED To analyze and interpret collected data the following statistical tools were used. 1) Percentage method 2) Weighted average method 3) Chi-square analysis 4) Correlation 5) Regression 4.5.1 Percentage method The percentage is used for making comparison between two or more series of data. It is used to classify the opinion of the respondent for different factors. It is calculated as No. of respondents favorable x 100 Percentage of respondent = Total no of respondents
  • 19. 19 4.5.2 Weighted average method The weighted average method can be calculated by the following formula. This tool is used to find the rank given by the respondents to the welfare measures. It can be calculated as XW = ∑ WX / ∑ X Here XW represents the weighted average X represents the value of variable W represents the weight given to the variable. 4.5.3 Chi-square analysis Chi-square analysis in statistics is to test the goodness of fit to verify the distribution of observed data with assumed theoretical distribution. Therefore it is a measure to study the divergence of actual and expected frequencies. The formula for computing chi-square is as follows. Chi-square = ∑ {(O-E)2 / E} The calculated value of chi-square is compared with the table of chi-square for the given degrees of freedom at the specified level of significance. If the calculated value is greater than the tabulated value then the difference between the observed frequency and the expected frequency are significant. The degrees of freedom is (n-2) where ‘n’ is number of observed frequencies and in case of contingency table the degrees of freedom is (C-1) (R-1) where C is number of columns and R is number of rows. It is used to find the relation between communication in work place and work satisfaction. It is used to find the relation between welfare satisfaction and work satisfaction it is used to find the relation between experience of respondents and work satisfaction
  • 20. 20 4.5.4 Correlation The correlation analysis deals with association between two or more variables. The correlation does not necessary imply causation or functional relationship though the existence of causation always implies correlation. By itself it establishes only co- variance. It is used to find the degree of relationship between motivation and work satisfaction. Cov(x, y) = 1/n ∑ x y – x y σx = √1/n Σ x2 – x 2 σy = √1/n Σ y2 – y 2 Cov(x, y) r= σx X σy Here, r = co-efficient of correlation 4.5.5 Regression The Regression analysis deals with the nature of association between two or more variables. In regression analysis we are concerned with the estimation of one variable for a given value of another variable on the basis of an average mathematical relationship between the two variables. Y= a + bX
  • 21. 21 CHAPTER- 5 DATA ANALYSIS AND INTERPRETATION TABLE 5.1 EXPERIENCE OF RESPONDENT Experience Frequency Percentage (%) 0-1 2 4.0 2-5 5 10.0 6-10 17 34.0 Above 10 26 52.0 Total 50 100.0 Inference: From the table it infers that 52% of respondent are experienced above 10 years and 4% are less than one year. CHART-5.1 EXPERIENCE OF RESPONDENT
  • 22. 22 60 50 40 Percentage 30 20 10 0 0-1 2-5 6-10 above 10 Experience
  • 23. 23 TABLE 5.2 LEVEL OF SATISFACTION OF SAFETY MEASURES Opinion Frequency Percentage (%) Highly satisfied 1 2.0 Satisfied 12 24.0 Neutral 12 24.0 Dissatisfied 19 38.0 Highly dissatisfied 6 12.0 Total 50 100.0 Inference: From the table it infers that 38%of respondent are dissatisfied with the safety measures and 24% of respondent are satisfied. CHART-5.2 LEVEL OF SATISFACTION OF SAFETY MEASURES
  • 24. 24 50 Percentage 40 30 20 10 0 Highly Satisfied neutral Highly dissatisfied Satisfied Dissatisfied Safety Measures
  • 25. 25 TABLE 5.3 LEVEL OF SATISFACTION OF MEDICAL FACILITY Opinion Frequency Percentage (%) Highly satisfied 10 20.0 Satisfied 28 56.0 Neutral 3 6.0 Dissatisfied 6 12.0 Highly dissatisfied 3 6.0 Total 50 100.0 Inference: From the table it infers that 56%of respondent are satisfied with the medical facility and 12% of respondent are dissatisfied. CHART 5.3 LEVEL OF SATISFACTION OF MEDICAL FACILITY 60 50 40 Percentage 30 20 10 0 Highly satisfied Neutral Highly dissatisfied Satisfied Dissatisfied Medical Facility in the Company
  • 26. 26 TABLE 5.4 LEVEL OF SATISFACTION OF WORKING ENVIRONMENT Opinion Frequency Percent Satisfied 40 80.0 Neutral 8 16.0 Dissatisfied 2 4.0 50 100.0 Total Inference: From the table it infers that 80%of respondent are satisfied with the working condition and 4% of respondent are dissatisfied. CHART 5.4 LEVEL OF SATISFACTION OF WORKING ENVIRONMENT 100 80 60 Percentage 40 20 0 Satisfied Neutral Dissatisfied Working Environment in the Company
  • 27. 27 TABLE 5.5 LEVEL OF SATISFACTION OF RELATIONSHIP BETWEEN SUPERVISOR AND WORKER Opinion Frequency Percentage (%) Cordial 39 78.0 Moderate 10 20.0 Indifference 1 2.0 Total 50 100.0 Inference: From the table it infers that 78%of respondent are satisfied with the supervisor and 2% of respondent are dissatisfied. CHART 5.5 LEVEL OF SATISFACTION OF RELATIONSHIP BETWEEN SUPERVISOR AND WORKER 100 80 60 Percentage 40 20 0 cordial moderate indifference Relation Between Supervisor and Worker
  • 28. 28 TABLE 5.6 LEVEL OF SATISFACTION OF RELATIONSHIP BETWEEN WORKERS Opinion Frequency Percentage (%) 41 82.0 Cordial 8 16.0 Moderate 1 2.0 Indifference 50 100.0 Total Inference: From the table it infers that 82%of respondent are satisfied with the workers and 2% of respondent are dissatisfied. CHART 5.6 LEVEL OF SATISFACTION OF RELATIONSHIP BETWEEN WORKERS
  • 29. 29 100 80 60 Percentage 40 20 0 Cordial Moderate Indifference Relation Between Workers
  • 30. 30 TABLE 5.7 LEVEL OF MOTIVATION GIVEN TO EMPLOYEE Opinion Frequency Percentage (%) Very high 7 14.0 High 17 34.0 Moderate 12 24.0 Low 10 20.0 Very low 4 8.0 Total 50 100.0 Inference: From the table it infers that 14%of respondent are highly motivated and 8% of respondent are not motivated. CHART 5.7 LEVEL OF MOTIVATION GIVEN TO EMPLOYEE
  • 31. 31 40 30 Percentage 20 10 0 very high high moderate low very low Motivation given to Employee
  • 32. 32 TABLE 5.8 LEVEL OF FREEDOM GIVEN TO THE EMPLOYEES Opinion Frequency Percentage (%) Very High 2 4 High 11 22 Moderate 15 30 Low 18 36 Very Low 4 8 Total 50 100 Inference: From the table it infers that 22% of the respondent feels that freedom given to them to express their ideas is high and 36% of the feel as low. CHART 5.8 LEVEL OF FREEDOM GIVEN TO THE EMPLOYEES 40 30 Percentage 20 10 0 Very high High Moderate Low Very low Freedom to express thier ideas
  • 33. 33 TABLE 5.9 STATUS OF GRIEVANCE HANDLING IN THE COMPANY Opinion Frequency Percentage Always 10 20 Sometimes 20 40 Rarely 13 26 Never 7 14 Total 50 100 Inference: From the table we infer that 40% of the respondents are satisfied with the grievance handling and 14% of the respondents are dissatisfied. CHART 5.9 STATUS OF GRIEVANCE HANDLING IN THE COMPANY 50 40 30 Percentage 20 10 0 alw ays sometimes rarely never Grievance Handling in the Company
  • 34. 34 TABLE 5.10 WORK SATISFACTION LEVELOF THE EMPLOYEE Opinion Frequency Percent Always 23 46.0 Sometimes 23 46.0 Rarely 4 8.0 Total 50 100.0 Inference: From the table it infers that 46%of respondent are always satisfied with work and 8% of respondent are rarely satisfied. CHART 5.10 WORK SATISFACTION LEVEL OF THE EMPLOYEE 60 50 40 Percentage 30 20 10 0 alw ays sometimes rarely Work Satisfaction of the Employees
  • 35. 35 TABLE 5.11 SATISFACTION OF EMPLOYEES ABOUT WELFARE MEASURES Opinion Frequency Percentage (%) 33 66.0 Yes 17 34.0 No 50 100.0 Total Inference: From the table it infers that 33%of respondent are always satisfied with welfare and 34% of respondent are not satisfied. CHART 5.11 SATISFACTION OF EMPLOYEES ABOUT WELFARE MEASURES 70 60 50 Percentage 40 30 20 10 0 yes no Satisfaction about Welfare
  • 36. 36 ANALYSIS OF OPINION OF RESPONDENTS REGARDING COMMUNICATION IN WORK PLACE AND WORK SATISFACTION (USING CHI-SQUARE) Observed count TABLE 5.12.1 Opinion Always Sometimes Rarely Total Cordial 9 5 0 14 Moderate 9 6 6 21 Indifference 7 7 1 15 Total 25 18 7 50 Expected count TABLE 5.12.2 Opinion Always Sometimes Rarely Total Cordial 7 5 2 14 Moderate 10.5 7.6 2.9 21 Indifference 7.5 5.4 2.1 15 Total 25 18 7 50 Null Hypothesis: H0: There is no significant difference between communication in work place and work satisfaction. CHI-SQUARE TESTS TABLE 5.12.3 O E (O-E)2 (O-E)2/E 9 7 4 0.57 5 5 0 0 0 2 4 2 9 10.5 2.25 0.21 6 7.6 2.56 0.34 6 2.9 9.61 3.31 7 7.5 0.25 0.03 7 5.4 2.56 0.47 1 2.1 1.21 0.58
  • 37. 37 Calculated value = ∑ (O-E) 2 / E = 7.51 Degrees of Freedom = (R -1) (C-1) = 4 Tabulated value for 4 degrees of freedom at 5% level of significance is 9.48 Inference: The calculated value is less than the tabulated value. H0 is accepted. Therefore there is no association between communication in work place and work satisfaction.
  • 38. 38 ANALYSIS OF OPINION OF RESPONDENTS REGARDING WELFARE SATISFACTION AND WORK SATISFACTION (USING CHI-SQUARE) Observed count: TABLE 5.13.1 Opinion Always Sometimes Rarely Total Yes 20 12 1 33 No 7 6 4 17 Total 27 18 5 50 Expected count: TABLE 5.13.2 Opinion Always Sometimes Rarely Total Yes 17.8 11.9 3.3 33 No 9.2 6.1 1.7 17 Total 27 18 5 50 Null Hypothesis: H0: There is no significant difference between welfare satisfaction and work satisfaction. CHI-SQUARE TESTS TABLE 5.13.3 O E (O-E)2 (O-E)2/E 20 17.8 4.84 0.27 12 11.9 0.01 0 1 3.3 5.29 1.60 7 9.2 4.84 0.53 6 6.1 0.01 0 4 1.7 5.29 3.11 Calculated value = ∑ (O-E) 2 / E = 5.51 Degrees of Freedom = (R -1) (C-1) = 2 Tabulated value for 2 degrees of freedom at 5% level of significance is 5.99 Inference:
  • 39. 39 The calculated value is less than the tabulated value. H0 is accepted. Therefore there is no association between welfare satisfaction and work satisfaction. ANALYSIS OF OPINION OF RESPONDENTS REGARDING EXPERIENCE OF RESPONDENT AND WORK SATISFACTION (USING CHI-SQUARE) Observed count: TABLE 5.14.1 Opinion Always Sometimes Rarely Total 0-1 1 1 0 2 2-5 2 2 1 5 6-10 6 10 1 17 Above 10 14 10 2 26 Total 23 23 4 50 Expected count: TABLE 5.14.2 Opinion Always Sometimes Rarely Total 0-1 0.9 0.9 0.2 2 2-5 2.3 2.3 0.4 5 6-10 7.8 7.8 1.4 17 Above 10 12 12 2.1 26 Total 23 23 4 50 Null Hypothesis: H0: There is no significant difference between experience of respondent and work satisfaction.
  • 40. 40 CHI-SQUARE TESTS TABLE 5.14.3 O E (O-E)2 (O-E)2/E 1 0.9 0.01 0.01 1 0.9 0.01 0.01 0 0.2 0.04 0.2 2 2.3 0.09 0.04 2 2.3 0.09 0.04 1 0.4 0.36 0.9 6 7.8 3.24 0.41 10 7.8 4.8 0.62 1 1.4 0.16 0.11 14 12 4 0.33 10 12 4 0.33 2 2.1 0.01 0.004 Calculated value = ∑ (O-E) 2 / E = 3 Degrees of Freedom = (R -1) (C-1) = 6 Tabulated value for 6 degrees of freedom at 5% level of significance is 12.59 Inference: The calculated value is less than the tabulated value. H 0 is accepted. Therefore there is no association between experience of the respondent and work satisfaction
  • 41. 41 ANALYSIS OF OPINION OF RESPONDENTS REGARDING MOTIVATION GIVEN TO EMPLOYEE AND WORK SATISFACTION (USING CORRELATION) Observed Count TABLE 5.15.1 OPINION ALWAYS SOMETIMES NEVER TOTAL FACTORS MOTIVATION(X) 24 12 14 50 WORK 28 19 3 50 SATISFACTION(Y) CORRELATION TABLE TABLE 5.15.2 X Y X2 Y2 XY 24 28 576 784 672 12 19 144 361 228 14 3 196 9 42 Cov(x, y) = 1/n ∑ x y – x y = 1/3 (942-278) = 35 σx = √1/n Σ x2 – x 2 = √1/3(916-278) = 5.14 σy = √1/n Σ y2 – y 2 = √ 1/3(1154-278) =10.28
  • 42. 42 Cov(x, y) r= σx X σy = 0.66 Inference: The motivation given to employees and work satisfaction are positively correlated. The increase in motivation will increase the work satisfaction also.
  • 43. 43 ANALYSIS OF RANKING GIVEN BY RESPONDENTS REGARDING SATISFACTION OF WELFARE MEASURES (USING WEIGHTED AVERAGE METHOD) Observed Count TABLE 5.16.1 OPINION SATISFIED NEUTRAL DISSATISFIED TOTAL FACTORS MEDICAL 35 4 11 50 FACILITY INFRA 27 9 14 50 STRUCTURE CANTEEN 21 9 14 50 FACILITY CREDIT 26 10 14 50 FACILITY WEIGHTED AVERAGE TABLE TABLE 5.16.2 FACTORS Medical Infra Canteen Credit RANK WEIGHTS Facility structures Facility Facility Facility X W X1 WX1 X2 WX2 X3 WX3 X4 WX4 1 3 35 105 27 81 21 63 26 78 2 2 4 8 9 18 14 28 10 20 3 1 11 14 14 14 15 15 14 14 TOTAL 50 124 50 113 50 106 50 112 CW 2.48 2.26 2.12 2.24 RANK 1 2 4 3 CW (CALCULATED WEIGHT) = ∑ WXn / ∑ Xn Inference: From the table it is inferred that employees ranks medical facility followed by infra structure with the canteen facility as last.
  • 44. 44 ANALYSIS OF OPINION GIVEN BY RESPONDENTS REGARDING SATISFACTION OF WELFARE MEASURES AND EMPLOYEE MORALE (USING REGRESSION METHOD) Let X be the morale of the employee Let Y be the satisfaction of welfare measures. Observed Count TABLE 5.17.1 OPINION SATISFIED NEUTRAL DISSATISFIED FACTORS EMPLOYEE 116 36 48 MORALE(X) WELFARE 28 19 13 MEASURES(Y) REGRESSION TABLE TABLE 5.17.2 (X-X) 2 2 X Y X-X X-X Y-Y Y-Y (Y-Y) 116 28 49 2440 11 130 563 36 9 -31 936 -8 58 233 48 13 -19 346 -4 13 67 Formula
  • 45. 45 bxy = ∑ ( x-x )( y-y ) ∑ ( x-x )2 = 863/201 = 4.29 Regression Equation X-X = bxy (Y-Y) X = 4.3Y -6.1 Inference: Excluding the constant, from the above equation we can infer that effect of welfare measure on morale is measure is found as1:4. Therefore we can conclude that the effect of welfare measure on employee morale is about 25%.
  • 46. 46 CHAPTER -6 6.1 FINDINGS OF THE STUDY Most of the employees in the company are female. More than 50% of respondent are working for more than 10 years. Most of the respondents are highly satisfied with the medical facility. Most of the respondents are dissatisfied with the safety measure and only few are satisfied. Most of the employees are satisfied with the working condition. Most of the respondents are satisfied with the motivation given by the company. Most of the respondents are satisfied with the relation between supervisor and workers. Most of the employees are satisfied with the relation between workers. Most of the respondents are satisfied with the work. Most of the respondents are satisfied with the welfare measures. Most of the respondents are satisfied with the canteen facility. Most of the respondents are satisfied with the credit facility. The communication in work place has no effect on work satisfaction. The welfare measure satisfaction has no effect on work satisfaction. The increase in employee motivation will increase the work satisfaction. The effect of welfare measures is about 25% on employee morale.
  • 47. 47 6.2 SUGGESIONS AND RECOMMENDATIONS • Since most of the employees are married the company can concentrate on crèche facility. • The company can improve the grievance handling system so that they can increase the employee satisfaction. • The company can provide safety equipments to the employees. • The salary increment for employees will increase the employee satisfaction and which in turn increase the employee morale.
  • 48. 48 CHAPTER - 7 CONCLUSION The study on effect of welfare measure on employee morale helps the management to know the satisfaction level of the employees about the welfare measure provided by the company. From this study we can infer that the majority of the employees are satisfied with the welfare measures. The company can concentrate on other facility like crèche facility, uniform, and safety measures to boost the employee morale. The employee morale is good in the company. It is found that the effect of welfare measure on employee morale in this study is about 25%.
  • 49. 49 CHAPTER -8 8.1 LIMITATIONS OF THE STUDY • The time period of the study is very short, so elaborate study was not made. • Only certain factors are considered in this study to measure the effect of welfare measure on employee morale. • The conclusions and suggestions were formed based on employee’s spot response. • Some false information may be given by the employee
  • 50. 50 8.2 SCOPE FOR FURTHER STUDY • The sample size taken for this study is only 50, it can be extended to a larger sample • The study can be done by considering some other factors to measure the employee morale • This study can be used to measure the satisfaction level of employee. • This study can also be extended to the other production centers of the company.
  • 51. 51 APPENDICES ANNEXURE -1 A STUDY ON EFFECT OF WELFARE MEASURES ON EMPLOYEE MORALE QUESTIONNAIRE PERSONAL DATA 1. Name : 2. Age : (a) 18-25 (b) 26-35 (c) 36-45 (d) Above 45 3. Gender : (a) Male (b) Female 4. Educational Qualification : (a) Below Hr Sec (b) Hr Sec (c) UG (d) PG 5. Experience : (a) 0-1 Yrs (b) 1-5 Yrs (c) 5-10 Yrs (d) Above 10 Yrs 6. Total Salary : 7. Designation : 8. Safety Measures : 8.1. Are you satisfied with the safety appliances in work place? a) Highly satisfied b) Satisfied c) Neutral d) Dissatisfied e) Highly Dissatisfied 9. Medical Facility 9.1 Specify the level of satisfaction a) Highly satisfied b) Satisfied c) Neutral d) Dissatisfied e) Highly Dissatisfied 9.2 Is there any periodical medical check up given to you (a) Yes (b) No 10. ESI Benefits : 10.1 Do you have ESI car (a) Yes (b) No 10.2 Do you get all the ESI benefits? (a) Yes (b) No
  • 52. 52 11. Canteen facility Specify the level of satisfaction Highly Highly Satisfied Neutral Dissatisfied Satisfied Dissatisfied Cleanliness Hygienic Serving Price 12. Credit facility 12.1. Is any Advances and loan given to you are satisfied (a) Very high b) high c) moderate d) low e) very low Specify the level of satisfaction of other allowances Highly Highly Satisfied Neutral Dissatisfied Satisfied Dissatisfied Transport allowance Attendance allowance Punctuality allowance Education allowance 13. Infra-structural facility : Specify the level of satisfaction Highly Highly Satisfied Neutral Dissatisfied Satisfied Dissatisfied Rest room Drinking water Ventilation Lighting Toilets Working environment Transportation 14. Inter-relationship: 14.1. Relationship between co-workers (a) Cordial (b) Moderate (c) Indifferent 14.2. Relationship between supervisor and workers.
  • 53. 53 (a) Cordial (b) Moderate (c) Indifferent 14.3. Level of communication between supervisor and employee (a) High (b) Very high (c) Low (d) Very low (e)Moderate 15. Level of motivation given to employee (a) High b) Very high (c) Low (d) Very low (e) Moderate 16. Are u informed about all the management policies? (a) Always (b) Sometimes (c) Rarely (d) Never 17. Does the management solve all your grievances? (a) Always (b) Sometimes (c) Rarely (d) Never 18. Level of freedom to express your ideas? (a) High (b) Very high (c) Low (d) Very low (e) Moderate 19. Are you satisfied with the work you do. (a) Always (b) Sometimes (c) Rarely (d) Never 20. In general are you satisfied with the welfare and safety measures given by Management? (a) Yes (b) No 21. Suggestion for Improvements
  • 54. 54 ANNEXURE-2 BIBLIOGRAPHY BOOKS 1. Kothari C.R., Research methodology, published by Tata Mc Graw-Hill Publishing Company Ltd., 13th Edition, 1982. 2. Gupta, S.P., and Gupta, M.P., Business Statistics, Published by Sultan Chand & Sons, 7th Edition, 1989. 3. Personnel Management by C.B.Mamoria & S.V.Gankar, Published by Himalaya Publishing House. WEBSITES 1. www.ncr.com
  • 55. 54 ANNEXURE-2 BIBLIOGRAPHY BOOKS 1. Kothari C.R., Research methodology, published by Tata Mc Graw-Hill Publishing Company Ltd., 13th Edition, 1982. 2. Gupta, S.P., and Gupta, M.P., Business Statistics, Published by Sultan Chand & Sons, 7th Edition, 1989. 3. Personnel Management by C.B.Mamoria & S.V.Gankar, Published by Himalaya Publishing House. WEBSITES 1. www.ncr.com
  • 56. 54 ANNEXURE-2 BIBLIOGRAPHY BOOKS 1. Kothari C.R., Research methodology, published by Tata Mc Graw-Hill Publishing Company Ltd., 13th Edition, 1982. 2. Gupta, S.P., and Gupta, M.P., Business Statistics, Published by Sultan Chand & Sons, 7th Edition, 1989. 3. Personnel Management by C.B.Mamoria & S.V.Gankar, Published by Himalaya Publishing House. WEBSITES 1. www.ncr.com