
Recomendados
Más contenido relacionado
Similar a Coke
Similar a Coke (20)
Último
Último (20)
Coke
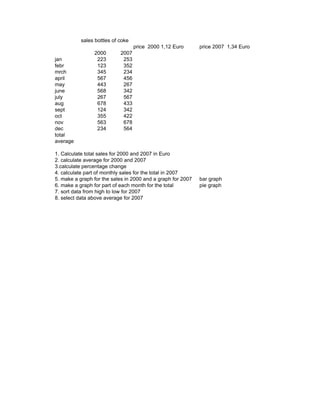
- 1. sales bottles of coke price 2000 1,12 Euro price 2007 1,34 Euro 2000 2007 jan 223 253 febr 123 352 mrch 345 234 april 567 456 may 443 267 june 568 342 july 267 567 aug 678 433 sept 124 342 oct 355 422 nov 563 678 dec 234 564 total average 1. Calculate total sales for 2000 and 2007 in Euro 2. calculate average for 2000 and 2007 3.calculate percentage change 4. calculate part of monthly sales for the total in 2007 5. make a graph for the sales in 2000 and a graph for 2007 bar graph 6. make a graph for part of each month for the total pie graph 7. sort data from high to low for 2007 8. select data above average for 2007
- 2. % change % part of 2007
- 3. Uganda Population year size 1948 5 1959 6.5 1969 9.5 1980 12.6 1991 16.7 2002 24.2 2009 31.2 2011 33 2012 34.1 2014 36.6 2015 37.9 wolfram alpha population http://www.wolframalpha.com/input/?i=population+uganda public data population growth http://www.google.com/publicdata/explore?ds=d5bncppjof8f9_&ctype=l&strail=false&nselm=h&met_y=s population http://www.google.com/publicdata/explore?ds=d5bncppjof8f9_&ctype=l&strail=false&nselm=h&met_y=s
- 6. year size 1948 5 1959 6.5 1969 9.5 1980 12.6 1991 16.7 size 2002 24.2 40 2009 31.2 2011 33 35 2012 34.1 30 2014 36.6 2015 37.9 25 20 15 10 5 0 1948 1959 1969 1980 1991 2002 2009 2
- 7. size size 0 1991 2002 2009 2011 2012 2014 2015
- 8. price 2000 1,12 Euro price 2007 1,34 Eurochange % 2000 2007 jan 223 253 249.76 339.02 35.74% febr 123 352 137.76 471.68 133.70% mrch 345 234 386.4 313.56 -29.16% april 567 456 635.04 611.04 -9.61% may 443 267 496.16 357.78 -55.41% june 568 342 636.16 458.28 -71.22% july 267 567 299.04 759.78 184.47% aug 678 433 759.36 580.22 -71.72% sept 124 342 138.88 458.28 127.88% oct 355 422 397.6 565.48 67.22% nov 563 678 630.56 908.52 111.29% dec 234 564 262.08 755.76 197.66% total 5028.8 6579.4 average 419.07 548.28 sales 2000 800 700 600 500 400 300 Column C 200 100 0 ne t pt h g n v ay ly c br ri l oc de no au rc ja ju se fe m ap ju m 2000 2007 mrch 345 234 386.4 jan 223 253 249.76 may 443 267 496.16 sept 124 342 138.88 june 568 342 636.16 febr 123 352 137.76 oct 355 422 397.6 aug 678 433 759.36 april 567 456 635.04 dec 234 564 262.08 july 267 567 299.04 nov 563 678 630.56 total 5028.8 average 419.07
- 9. % part of 2007 jan 5.15% febr 7.17% mrch 4.77% april 9.29% 5.44% may 6.97% june 11.55% july 8.82% aug 6.97% sept 8.59% oct 13.81% nov 11.49% dec 800 700 600 500 400 Column C 300 Column D 200 100 0 ne t pt g n h ay ly v br c ri l oc de no au rc ja ju se fe m ju ap m