co:op-READ-Convention Marburg - Daniel Shakespeare
•
1 recomendación•965 vistas

Daniel Shakespeare (Freelance programmer, DE): Interactive Genealogy Explorer. Visualization of migration of ancestors and relatives co:op-READ-Convention Marburg Technology meets Scholarship, or how Handwritten Text Recognition will Revolutionize Access to Archival Collections. With a special focus on biographical data in archives Hessian State Archives Marburg Friedrichsplatz 15, D - 35037 Marburg 19-21 January 2016

Recomendados
Recomendados
Más contenido relacionado
Destacado
Similar a co:op-READ-Convention Marburg - Daniel Shakespeare
Similar a co:op-READ-Convention Marburg - Daniel Shakespeare (20)
Más de ICARUS - International Centre for Archival Research
Más de ICARUS - International Centre for Archival Research (20)
Último
Último (20)
co:op-READ-Convention Marburg - Daniel Shakespeare
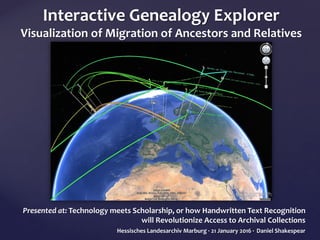
- 1. Interactive Genealogy Explorer Visualization of Migration of Ancestors and Relatives Presented at: Technology meets Scholarship, or how Handwritten Text Recognition will Revolutionize Access to Archival Collections Hessisches Landesarchiv Marburg · 21 January 2016 · Daniel Shakespear
- 2. Introduction and background Genealogies have been visualized in various ways, appropriate for particular data sets and observations. Nearly all represent time by generations rather than actual years, and until recently, few showed any geographic data. http://www.scifres.com/2010/01/genealogy-visualizations/ http://www.aviz.fr/geneaquilts/ http://infosthetics.com/archives/2006/07/l argescale_genealogical_history.html http://janasgenealogyandfamilyhistory.blogs pot.de/2013/10/tech-tuesday- rootsmappercom-ya-this-is.html?spref=fb Rootsmapper
- 3. Motivation and starting point Existing genealogy software (2011) provided interesting but limited geographical display of genealogical information Images: My Heritage Family Tree Builder, ver. 7.0 Locations have linked information, but no visual time context or connection to other events or people Typical consumer genealogy software Each person’s life is illustrated by a colored tube tracing events in chronological order. The color and altitude correspond to the date of the events, and each event is plotted above the globe where it occurred. Interactive Genealogy Explorer Vision and goal: interactive 3D genealogy visualization, based on GEDCOM data
- 4. Technical process: Overview Genealogy information is entered using standard consumer software (here, My Heritage Family Tree Builder) and exported to a GEDCOM file Events with date and location added where known „Lifelines“ for individuals are parametrically generated by Google SketchUp using Ruby script and HTML/Javascript code Interactive Genealogy Viewer (HTML/Javascript) is then used in a web browser to interactively portray lifelines on a Google Earth globe
- 5. CAD Google SketchUp WEB BROWSER Internet Explorer Google Earth Plugin LOCAL WEBSERVER Abyss GEOMETRY CALCULATOR GeneIn.rb LOCATION LOOK-UP www.geonames.org GENERATOR UI GeneToGraph GEOGRAPHIC DATA Google Earth VIEWER UI GeneToGraphView GEOMETRY GENERATION INTERACTIVE VISUALIZATION LOCAL APPLICATIONS WEB SERVICES / EXTERNAL CODE IGE CODE MODULES Available upon request RUBY CSV FILE CODE CSV.RB IGE applications, code and web services Copyright (C) 2000-2004 NAKAMURA, Hiroshi <nakahiro@sarion.co.jp>
- 6. Generation of “lifelines”: SketchUp Select GEDCOM file Options for individual selection Perform latitude/ longitude lookups Generate list for SketchUp Lifeline generated automatically for each selected person and stored for web server
- 7. Interactive Genealogy Explorer GUI Interaction controls | Selection controlsGoogle Earth Plug-In View and navigate with basic Google Earth controls Search for and select individuals to show, or plot connections between related individuals Go directly to events, show details on the globe, „fly“ from event to event, change to children / parents / spouse, etc.
- 9. Resulting visualization: All data
- 10. Complete path: Daniel Shakespear to Dorothy Shakespear
- 11. Example: Highlights of Richmond Campbell Shakespear The video linked below shows the user clicking on an event and then stepping through selected events in the life of Richmond Campbell Shakespear. At the birth of his son Talbot Powney Shakespear, the user switches to following Talbot’s life line.
- 12. Initial results and issues Discernibility issue when many people or events are close by • Improved by “spiraling” nearby events Limited interactivity (lifelines not clickable) • Improved by adding clickable Google Earth Placemarks with flag icons and persons’ initials, in space, by each event
- 13. Initial results and issues Initial lack of perspective on time and location • Time not easily discernible from the height of a lifeline: Significantly improved with use of color to indicate dates rather than last names or random sequence • Location on globe not clear unless viewing event with earth directly below (perpendicular): improved with use of lines from events to surface
- 14. Example connection: David Cameron to William Makepeace Thackeray This image shows some of the limitations of the visualization when numerous people come from one area. Colors and spacing help differentiate, to some extent.
- 15. Comparisons to other visualizations Comparison to traditional trees and similar generation-based charts • Lineage is easier to read in a traditional diagram since it is generation-based and does not depict location or non-genealogical events. However, traditional charts have very limited interactivity, and do not depict time linearly Compared to Rootsmapper • Rootsmapper (launched Fall 2013) has the advantage that it offers a simpler generation process with no local software or webserver required • The resulting visualization is limited in content (no names or events, no dates), and does not directly reflect time (colors indicate gender) • As it is two-dimensional, this visualization could get cluttered when displaying a larger set of people http://janasgenealogyandfamilyhistory.blogs pot.de/2013/10/tech-tuesday- rootsmappercom-ya-this-is.html?spref=fb http://blog.rootsmapper.com/
- 16. Observations and personal learnings The IGE visualization highlighted the extensive migration between England and India, and the timing of my ancestors’ arrivals in the US The visualization also helped me place various events among ancestors and relatives better in time and space • Realized that my brother lived in California near a distant relative (3rd cousin) with whom we had no contact, in the early 1990s Others who have seen or used the tool generally find the visualization more interesting and engaging than traditional trees and maps. Two paths from India to the US in the 19th century: the connection between Michael Shakespear and Donald Helmey From 1975 until 1995, the two lived a little over 100 km apart
- 17. Limitations • As with any visualized data, care must be taken to assess any conclusions against the completeness of the input data • Results not very interesting for genealogies of families with minimal migration • Can only plot events in the GEDCOM file which have understandable dates and places (resulting lifelines are incomplete if dates or places missing) • Visualization may be accurate geographically, but Google Earth shows nations and borders in their current state, not accounting for earlier divisions (e.g. Prussia)
- 18. Limitations Technical issues - Google Earth Plug-In: • Limitations in interaction and requires a web server to load data (unnecessarily complex) • Plug-In has been deprecated and no replacement from Google is forthcoming – investigating rewriting the code for Cesium (also provides additional features) Open issues and further development: • Consolidation into a one-step solution • Elimination of need for local web server if possible • Improved presentation, features and user friendliness • Parsing additional types of GEDCOM events and relationships
- 19. To make it easier to study certain times in history, a translucent, scalable globe with time-appropriate maps could be developed • This would visualize a snapshot in time, showing the actual geopolitical borders as they were • It would also highlight the people alive at that time (newer events would be visible but dimmed inside the translucent globe) • This would require a different source for globe data, as the Google Earth Plug-In is not able to render scalable dynamic objects Further ideas: Genealogy application
- 20. Related concept: visualizing war Another possible application would be to plot battles and military movements in a traditional war • This would provide a 3D overview of the fundamental events and movements • Troops and/or weaponry could be quantified by the size of the tubes • Impact of a battle on each army would be indicated then by the change in size of the tube • A translucent, map which could be set to any altitude (time) with the corresponding fronts and borders shown would give a snapshot in time at any desired phase of the war (here a flat map, rather than a globe, would likely be appropriate)
- 21. A larger-scale application could be used to graphically show the progression of migration over time (e.g. potato famine, or migration of early ancestor groups out of Africa). In this case, the size of the shape at a given height would correlate to population at a given time. http://commons.wikimedia.org/wiki/File:Spreading_homo_sapiens_la.svg The map above shows when homo sapiens arrived in various areas over time. A 3D version with time as the third axis, would allow the depiction of populations as shapes spreading out in space and time, and if generated for all three species, provide a sense of when and where they interacted. An ambitious programmer could generate dynamic “sections” or shapes, to highlight conditions at a point in time. Such an approach could be used to track and visualize the spread of languages, diseases, ideas, or anything which permeates our planet and its people. Related concept: visualizing mass migration
- 22. BACKUP
- 23. ADDITIONAL LINKS Project on Bēhance https://www.behance.net/gallery/22589523/Interactive-Genealogy-Explorer Video: close spin https://youtu.be/S68HV1ksqU4 "Interactive Genealogy Explorer: Visualization of Migration of Ancestors and Relatives." Proceedings of the First Conference on Biographical Data in a Digital World 2015. Amsterdam. CEUR Workshop Proceedings. http://ceur-ws.org/Vol-1399/paper15.pdf