1. Thomas C. Piechota, Anil Acharya, Silvia Albuquerque, Marcelo Reginato / International
Journal of Engineering Research and Applications (IJERA) ISSN: 2248-9622 www.ijera.com
Vol. 2, Issue 6, November- December 2012, pp.359-376
GIS Tools For Assessing Source Water Protection: Las Vegas
Valley Surface Waters
Thomas C. Piechota1, Anil Acharya2, Silvia Albuquerque3, and Marcelo
Reginato4
1
Interim Vice President for Research, Professor, Department of Civil and Environmental Engineering,
University of Nevada Las Vegas
2
Assistant Professor, Department of Civil and Mechanical Engineering, Alabama A and M University,
3
Avaliar
4
CH2MHILL, Southern California Office
Abstract
The 1996 amendment to the Safe 1.0 Introduction
Drinking Water Act of 1974 created the Source The protection of water resources is a
Water Assessment Program (SWAP) with an concern for the health of the public, securing a safe
objective to evaluate potential sources of drinking water supply, and maintaining a strong
contamination to drinking water intakes. The economy. The Safe Drinking Water Act (SDWA) of
major drinking water source for the Las Vegas 1974, amended in 1986 and 1996, is the national law
Valley and Southern Nevada in United States is meant to protect public health by regulating drinking
Lake Mead. This research assesses the water supplies in the United States (USEPA 1999).
vulnerability of the raw water intakes at Lake The 1996 amendment to the SDWA created the
Mead to potential sources of contamination from Source Water Assessment Program (SWAP) with
the Las Vegas Valley (Wash). This is the objective to evaluate potential sources of
accomplished by utilizing Geographic contamination to drinking water intakes (surface and
Information System (GIS) technology in groundwater). This amendment required
implementing prescribed steps as part of the communities to delineate source water protection
Nevada SWAP. GIS tools are used in this analysis areas and provide funding for water system
to identify the watershed boundary and source improvements, operator training, and public
water protection area, visualize watershed information (USEPA 1999). Source water is defined
characteristics and location of contaminants, as all water- from rivers, streams, underground
identify drainage network and flow path, and aquifers, and lakes, which can be used to supply
show the spatial distribution of vulnerability in drinking water needs (USEPA 2001). Since source
the watershed. The vulnerability is assigned water protection is site specific, each state defined
based on four factors: time of travel from its own approach to assess source water under the
potential contamination activities (PCAs) to the SWAP and the assessment plan had to be approved
intake, physical barrier effectiveness of the by the USEPA. By the beginning of 2002, all state
watershed, the risk associated with the PCAs, and proposals had been submitted and approved. Since
evaluation of existing local water quality. The this type of watershed based approach requires
vulnerability analysis shows that the PCAs with geographical analysis, Geographic Information
the highest vulnerability rating include septic System (GIS) technology provides a common
systems, golf courses/parks, storm channels, gas framework for handling spatial data from various
stations, auto repair shops, construction, and the sources, understanding process of source water
wastewater treatment plant discharges. The assessment, and management of potential impacts of
drinking water intake at Lake Mead is at a different activities in the watershed (Tim and
Moderate level of risk for Volatile Organic Mallavaram, 2003). At present, the importance of
Compounds, Synthetic Organic Compounds, GIS technology has increased even more in these
microbiological and radiological contaminants. types of watershed assessments due to availability of
The drinking water intake is at a High level of large volume of digital data, sophistication of geo-
risk for Inorganic Compounds contaminants. processing functions, and the increasing use of real-
However, Las Vegas is protected by high quality time analysis and mapping.
water treatment facilities. Source water The Nevada SWAP document, which was
protection in the Las Vegas Valley is strongly approved by EPA on February 1999, contains
encouraged because of the documented influence guidelines for the preparation of an assessment of
of the Las Vegas Wash on the quality of the water vulnerability of the raw water sources (ground and
at the intake. surface waters) in Nevada. Various steps for
developing the SWAP in Nevada as outlined by the
Keywords: water quality; watershed; State Health Division, Bureau of Health Protection
contamination; risk; vulnerability. Services (1999) incorporates- identification of
359 | P a g e
2. Thomas C. Piechota, Anil Acharya, Silvia Albuquerque, Marcelo Reginato / International
Journal of Engineering Research and Applications (IJERA) ISSN: 2248-9622 www.ijera.com
Vol. 2, Issue 6, November- December 2012, pp.359-376
watershed boundary and source water protection 2.1 GIS Data
area, inventory of potential sources of 2.1.1 Watershed Boundary
contamination, assignment of a level of risk to each The shape files available in GISMO
contaminant source that has a potential to reach the (GISMO, 2002) were utilized to delineate the
drinking water source, determine the vulnerability, watershed boundary and subwatersheds in the Las
and disseminate the final report to the public. GIS Vegas valley (Figure 1). The watershed area is
technology plays an important role in these aspects approximately 1,520 square miles. The U.S
since these tasks can be easily accessed (handled) Geological Survey (USGS) watershed boundary was
through the use of GIS tools. not utilized in this study, since the subwatersheds
Lake Mead is the primary drinking water were not delineated in USGS available data. The
source for the Las Vegas Valley and southern available shapefiles from GISMO also have
Nevada, and supplies approximately 88% of the information related to stormwater drains and
domestic water supply; the remaining 12% is detention basins, which were used to determine the
supplied by the groundwater wells. This research flows paths through the urban areas of the Las Vegas
demonstrates the utility of GIS systems for assessing Valley. The major washes and storm channels in the
potential sources of contamination from the Las watershed drain into the Las Vegas Wash and finally
Vegas Valley to the surface drinking water intake- discharging into Lake Mead towards East as shown
Lake Mead for southern Nevada. GIS technology is in Figure 1.
used in this analysis to assess the vulnerability of
surface water to potential contaminating activities 2.1.2 Soil Data
(PCAs) in the watershed. During the vulnerability The soil characteristics in the Las Vegas
assignment, GIS tools are used to identify the Valley were summarized in the report “Soil Survey
watershed boundary and source water protection of Las Vegas Valley Area Nevada” (USDA 1985).
area, visualize watershed characteristics and location The Soil Conservation Service method based on
of contaminants, identify drainage network and flow infiltration rates (High-Soil A, Low-Soil D) is used
path, and show the spatial distribution of to classify soils (Maidment 1993). The soil
vulnerability in the watershed. characteristics are used for this study to determine
The outline of this paper is as follows. The the ability of a contaminant to migrate downstream
description of the study area and its associated in the watershed. Figure 2 displays the spatial
background materials are provided in Section 2. The distribution of the hydrologic soil groups within the
methodology (procedure) in the SWAP for Las Las Vegas Valley watershed boundary. A large
Vegas Valley surface waters is discussed in Section portion of the watershed (58%) is covered by the soil
3; results are provided in Section 4; and conclusions group D, which has a very slow infiltration rate and
in Section 5. high runoff potential (USDA 1985). These portions
of the watershed are largely in the surrounding
2.0 Study Area mountains. The valley floor of the watershed has soil
The Las Vegas Valley watershed is located type B and C.
in Clark County, Nevada, which is located in the
arid environment of the Mojave Desert. Las Vegas is 2.1.3 Land Use Data
considered as the fastest growing large metropolitan Land use is available from the Clark
region in the U.S. (Gottdienet et al. 1999). County Assessor’s Office as a database file with
Population for the Las Vegas Valley is parcel information, including land use code and
approximately 1.4 million, which represents more parcel number, which can be displayed as a GIS map
than 95% of Clark County’s population and 65% of by linking tables and using Structured Query
the state’s population (U.S. Census Bureau 2000). Language (SQL) queries. There are approximately
The average yearly rainfall in the valley is 4.49 70 different land use codes that can be generalized to
inches, and the dry summers are mainly seven land use categories. Figure 3 displays the
characterized by high temperatures with relatively general land use for the Las Vegas Valley
low humidity values (11 to 34%) (WRCC 2002). watershed. Based on the Clark County Assessor’s
Most of the storm drains and channels within the Office parcel data (2001), the major land uses were
valley are either dry or low flows; however, some categorized into seven types: undeveloped (1267 sq.
washes that used to be ephemeral have become miles, 85%), roads and highways (71 sq. miles, 4%),
perennial streams. The majority of the data related to commercial (27 sq. miles, 1.5%), industrial (17 sq.
the Las Vegas watersheds and Clark County can be miles, 1%), residential (107 sq. miles, 5.7%),
obtained from the Clark County GIS Management park/golf courses (17 sq. miles, 1.1%), and public
Office (GISMO) land (18 sq. miles, 1.1%). The critical areas for this
(http://gisgate.co.clark.nv.us/gismo.htm). source water assessment study are located in the
central and southeast portion of the watershed,
which are highly developed.
360 | P a g e
3. Thomas C. Piechota, Anil Acharya, Silvia Albuquerque, Marcelo Reginato / International
Journal of Engineering Research and Applications (IJERA) ISSN: 2248-9622 www.ijera.com
Vol. 2, Issue 6, November- December 2012, pp.359-376
2.2 Drinking Water Source 3.1 Delineation of Source Water Protection
The Colorado River, diverted at Lake Mead Areas
is the main source of water for Southern Nevada. As The SWAP requires the delineation of a
shown in Figure 4, the major inflows into Lake protection zone for the water source, that is, a zone
Mead are the Colorado River (97%), Virgin River must be defined around the Lake Mead raw water
(1.4%), Muddy River (0.1%), and Las Vegas Wash intake. The USEPA report “State Methods for
(1.5%) (SNWA 2002; Roefer et al. 1996). Although Delineating Source Water Protection Areas for
the Las Vegas Wash represents only 1.5%, it is the Surface Water Supplied Sources of Drinking Water”
most likely drainage to impact the drinking water (USEPA 1997b) summarizes the methods used to
intake due to the proximity of its outlet to the delineate source water protection areas. The main
drinking water intake. The Las Vegas Wash outlet is methods are using the topographic boundary,
approximately seven miles upstream from the defined setback/buffer zones, or the time of travel
drinking water intake; other rivers are more than 40 (TOT). The time of travel method was not used here
miles from the intake (SNWA 2002a). The Wash to delineate the source water protection zones, but it
contains urban runoff, groundwater discharges, dry was used to identify the response time for hazardous
and wet weather runoff, and treated domestic and spills. A minimum water source protection zone
industrial wastewater effluent from three municipal delineation outlined by USEPA (1997a) is to make
wastewater treatment plants (WWTPs). The the protection zones at least 200 feet wide around
discharges from the three WWTPs are responsible water bodies, and for it to extend at least 10 miles
for almost all the flow of the wash (Stave 2001). upstream from intake points.
Drinking water for the Las Vegas Valley In the case of the intake at Lake Mead,
and Southern Nevada is withdrawn from three raw most potential contaminating activities are located
water intakes at Lake Mead, all located at Saddle west of the intake in the urban Las Vegas areas. Ten
Island in Boulder Basin. Thus, Lake Mead acts as a miles would be the point approximately two (2)
source of drinking water as well as the discharge miles from where the Las Vegas Wash, the major
body for treated wastewater effluent. The Saddle drainage channel for the entire Las Vegas Valley,
Island intake is responsible for approximately 88% enters into Lake Mead. This distance does not
of the Las Vegas drinking water (SNWA 2002a); extend to the urban areas of Las Vegas, which are
hence, this intake is an important water supply for potential sources of contamination. Therefore, in this
thousands of inhabitants in Southern Nevada. assessment the source water protection area was
Various studies have indicated the influence of Las extended further upstream (> 10 miles) to the limits
Vegas wash discharges into the intake (LaBounty of the dry weather flows in storm water channels
and Horn 1997; Boralessa and Batista 2000; Du from the Las Vegas urban area. The rationale is that
2002). In addition to nutrients, there is potentially a water present in these channels can transport
myriad of organic, inorganic, and microbiological contaminants downstream to Lake Mead, via the Las
contaminants in the Las Vegas Wash (Sartoris and Vegas. In the State of Nevada SWAP (BHPS 1999)
Hoffman 1971; Deacon 1976; Baker et al. 1977; two zones of protection are designated –Zone A
Baker and Paulson 1980; Dan Szumski and extends 500 ft around water bodies, and Zone B
Associates 1991; Beavans et al.1996; Goldstein et extends 3000 ft from the boundaries of Zone A. For
al.1996; Roline and Sartoris 1996; Covay and Beck this case, the extent of dry weather flows was used
2001; Piechota et al. 2002; Rosenblatt and Amy as a basis for delineating source water protection
2002). This points towards to the importance of Zones. After defining the extent of dry weather
making source water assessment for surface waters flows through fieldwork, an ArcView script was
draining to Lake Mead and the water intake at used to select the channels downstream from the
Saddle Island. extent of dry weather flows. After establishing the
limits of the source water protection area, the buffer
3.0 Methodology zones were identified using ArcView GIS Buffer
The methodology for the source water Wizard tool. The delineation of these buffer zones
assessment consists of four main steps: (1) was performed using ArcMap Geo Processing
identification of the source water protection area; (2) Wizard.
identification of the potential contaminating
activities in the source water protection area; (3) 3.2 Identification of Potential Contamination
performing a vulnerability assessment for each According to Nevada’s SWAP, all possible
potential contaminating activity and risk that they contaminants within source water protection Zone A
pose to the drinking water source; and (4) informing should be inventoried for future risk analysis and
the water purveyors and public of the assessment susceptibility of source water contamination (BHPS
results. Following is a detailed description of each 1999). Field investigations were conducted within
step. the established water source protection area to
identify potential contaminating activities (PCAs)
(Table 1) that could reach the raw water intake. A
361 | P a g e
4. Thomas C. Piechota, Anil Acharya, Silvia Albuquerque, Marcelo Reginato / International
Journal of Engineering Research and Applications (IJERA) ISSN: 2248-9622 www.ijera.com
Vol. 2, Issue 6, November- December 2012, pp.359-376
Global Position System (GPS) Trimble Geoexplorer 3.3.1 PBE (Physical Barrier Effectiveness) is a
3 was used to mark the exact location of each measure of how well geological, hydrogeological,
contamination source. The information collected in and physical characteristics of the watershed act as a
the field includes the survey date, facility barrier to prevent downstream migration of
description, contaminant code, facility address, contaminants (or the susceptibility of the watershed)
picture, and geographic coordinates. The GPS data (CDHS 1999).
was then downloaded to a computer, the differential The main parameters used to compute the
correction was executed, photographs were PBE are the type of drinking water source, travel
transferred to the computer, and the database tables time, general topography, general geology, soil type,
and shapefiles containing the field points were vegetation cover, mean precipitation, and amount of
updated. This type of data gathered from GPS can be groundwater recharge. In this study, the following
fused easily within GIS for analysis purpose. GIS values were assigned to the different PBE levels:
coverage obtained from GISMO (2002) and the Low =5; Moderate = 3; High 1.
Clark County Health District was used to identify
the location of septic tanks in the source water 3.3.2 Risk is the risk ranking associated with
protection areas. The data is provided as polygons. each PCA (Table 1). The rankings were assigned in
The XTools Pro 1.0.1 ArcScript was then the Nevada SWAP (“Potential Contaminant Source
downloaded from the ESRI Support Center website Inventory”) based on the potential toxicity
(ESRI) to convert the septic polygons into its associated with the PCA. In assigning the risk
centroids. The output was a point shapefile associated with each activity the following rankings
representing the polygon centroids. were used: High =5; Moderate =3; and Low =1.
A list of National Pollutant Discharge
Elimination System (NPDES) permits in the 3.3.3 TOT (Time of Travel) is the estimated
protection area was also obtained and different time that would take each PCA to reach the water
activities were summarized. Finally, other activities source, in this case, travel time for the contaminant
(e.g., restaurants, residential areas, shopping centers) to reach Lake Mead from the outlet of the Las Vegas
that are noteworthy, but not included in Table 1, Wash. The TOT was computed based on field
were identified. A list of PCAs and the contaminants measurements of the storm channels in the Las
associated with each one are presented in the Nevada Vegas Valley and assumptions of flow in the Las
SWAP. The contaminants of concern in the SWAP Vegas Wash. The distance of each PCA to the
were grouped into five categories drinking water intake was measured in GIS. It was
(http://www.epa.gov/safewater/mcl.html): volatile possible since the exact location of each PCA was
organic compounds (VOCs), synthetic organic recorded by GPS (as discussed earlier). The distance
compounds (SOCs), inorganic compounds (IOCs), was combined with the velocity of the water in the
microbiological compounds (i.e., bacteria, viruses), channels to determine the time of travel. The Las
and radionuclides. These categories were used to Vegas Wash velocity was assumed to be
identify the type of contamination from different approximately 3 ft/sec, based on studies by Baker et
activities in Table 1. al. (1977) and field investigations by UNLV
(Piechota et al, 2003). The TOT were computed
3.3 Vulnerability Analysis for each PCA from the end of Las Vegas Wash to the PCA since it
The vulnerability of each PCA impacting was unclear what the travel time would be once a
the drinking water intake was assigned based on the contaminant enters Boulder Basin/Lake Mead. This
four factors: physical barrier effectiveness (PBE); TOT was plotted in GIS for better visualization.
risk potential (RISK); time of travel (TOT), and Considering that the end of Las Vegas
historical water quality. As outlined in the SWAP Wash is approximately six to seven miles from the
for the State of Nevada (BHPS 1999), the intake, the time it would take a contaminant to travel
vulnerability of each PCA, in quantitative terms, is from the exit of Las Vegas Wash through Boulder
defined as: Basin to the intake would be approximately 3-4
days. Estimation was necessary since there was
Vulnerability = PBE + Risk + TOT + Water limited information on the time of travel in Lake
Quality + Other Relevant Information (1) Mead from the Las Vegas Wash exit to the raw
Each term in the above equation was water intake. The following values were assigned to
assigned a value. The maximum score is 24, which the different TOTs to Lake Mead: 0-6 hours = 9; 6-
represent the highest possibility of a PCA impacting 12 hours = 7; 12-18 hours = 5; 18-24 hours = 3; > 24
the drinking water intake. The spatial distribution of hours = 1.
vulnerability of the intake to each PCA was then
plotted in GIS. Each term in the vulnerability 3.3.4 Water Quality involves evaluating
equation is defined below. historical raw water quality data at the intake to
determine if the source has already been affected by
contaminating activities. The EPA SWAP requires
362 | P a g e
5. Thomas C. Piechota, Anil Acharya, Silvia Albuquerque, Marcelo Reginato / International
Journal of Engineering Research and Applications (IJERA) ISSN: 2248-9622 www.ijera.com
Vol. 2, Issue 6, November- December 2012, pp.359-376
evaluating raw water quality data for all 4.2 Identification of Source Water
contaminants regulated under the SDWA Protection Areas (Zones)
(contaminants with a maximum contamination level As noted earlier, the boundary of Las Vegas
– MCL), contaminants regulated under the surface watershed, storm water channels, and washes were
water treatment rule (SWTR), the microorganism identified at first by using GIS data in GISMO
cryptosporidium, pathogenic viruses and bacteria, (Figure 1). The extent of dry weather flows was
and not federally-regulated contaminants that the identified and the source water protection Zones A
state determines it threatens human health. The and B were delineated as shown in Figure 6. Within
Nevada SWAP has added perchlorate (ClO4-) and these zones, there exists a pathway for the
MTBE (methyl-tert-butyl ether) to their list of contaminant to reach Lake Mead and the drinking
contaminants to be evaluated because these water intake. The source water protection Zones A
contaminants have been found in the surface waters and B represent approximately 0.8% (8,250 acres)
in Nevada. If the water quality data shows the and 3.9% (42,300 acres), with a total of 4.7%
presence of contaminants in a certain category, then (50,550 acres or 79 mi2) of the total Las Vegas
that category of contaminants was given a High Valley watershed (1520 mi2) and are located in
value = 5. If a contaminant is not present, then that highly developed areas.
category of contaminant was given a Low value =0.
4.3 Identification of PCAs
3.4 Community Involvement By compiling available NPDES permits and
Community involvement is a part of the GIS data, a total of 320 PCAs were identified, the
development of the SWAP program and the location of which are shown in Figure 6. The
preparation of the final SWAP document. The public number of contaminants identified in the field within
meetings and presentations conducted for the final the source water protection zones as well as the
SWAP document as outlined in Piechota et al. respective contaminant code and category are
(2003) are as follows: Three SWAP Advisory summarized in Table 2. The most common sources
Committee meetings (Sep 28,29; Nov 19, 20, 1998; of contaminant were found to be septic systems
and Jan 21, 22, 1999), Public Workshops in Carson (tanks) followed by medical institutions and auto
City, Elko and Las Vegas (Dec 10, 15 and 17, 1999), repair shops.
Presentations to Las Vegas Wash Coordination
Committee (April 24, 2001), Lake Mead Water 4.3.1 NPDES Permits
Quality Forum (July 19, 2001), USEPA Region IX, As of February 2003, there were 12
State of Nevada, and Southern Nevada Water permitted discharges within Zone A of the source
System, Carson City (April 24, 2002), Meeting with water protection area, which discharges different
Southern Nevada Water System (Nov 19, 2002). contaminant categories (Figure 7). The discharges
into the Las Vegas Wash included the effluent
4.0 Results discharge from the three WWTPs (NV0020133,
4.1 Summary of Field Investigations of Dry NV0022098, and NV0021261), an effluent
Weather Flows discharge from an ion-exchange facility
The storm water channels were surveyed to (NV0023060), discharge of cooling and scrubbing
determine the extent of dry weather flows in the Las water (NV0000060), and effluent discharge a facility
Vegas Valley for the spring, summer and fall of treating contaminated groundwater (NV0023213).
2001, and the summer of 2002. The extent of dry The other NDPES permitted discharges were to
weather flows for all seasons did not vary tributaries of Las Vegas Wash and in the source
significantly- the furthest extent of dry weather water protection area. These included three facilities
flows for summer 2001 is shown in Figure 5a. The discharging treated groundwater (NV 0022870,
velocity measured during the summer 2001 was used NV0023078, and NV002837), one facility
to determine the time of travel for contaminants in discharging cooling water and storm runoff
storm channels. All velocity measurements were less (NV0000078), one facility discharging untreated
than 1 m/s in the storm channels (Figure 5a). The groundwater (NV0022781), and one facility
plot of extent of dry weather flows against a soil discharging stormwater runoff (NV0020923). All of
map (GISMO 2002) indicated that the dry weather these permitted discharges were included in the PCA
flows cover a considerable part of the alluvium soils, list. The three NPDES discharges, which are located
with the exception of channels located in areas 1, 2 outside the source water protection area, also
and 3 (Figure 5b). Area 1 is a well-developed discharge into the Las Vegas Wash.
commercial area, and areas 2 and 3 are well
developed residential areas that may generate flows 4.3.2 Septic Tank Locations from GIS
from over-irrigation and/or other urban water uses. There were a total of 123 septic systems
that are within Zone A (500 feet buffer) of the
source water protection area. The point locations
shown in Figure 8 represent the centroid of the
363 | P a g e
6. Thomas C. Piechota, Anil Acharya, Silvia Albuquerque, Marcelo Reginato / International
Journal of Engineering Research and Applications (IJERA) ISSN: 2248-9622 www.ijera.com
Vol. 2, Issue 6, November- December 2012, pp.359-376
properties that were identified as having a septic 4.5 Water Quality at the Intake
system. A large portion of the septic systems was The ratings for the water quality portion of
located along Duck Creek in the vicinity of Pecos the vulnerability determination were adopted from
Road and Green Valley Parkway. These were also the final report prepared for the Bureau of Health
the closest septic systems to Las Vegas Wash and Protection Services, State of Nevada (Piechota et al.
the drinking water intake. The other tributaries with 2003). The ratings were assigned based on observed
septic systems include Flamingo Wash and Las records of water quality at the intake, and is one of
Vegas Creek. four variables used to make the final vulnerability
determination for the intake. Based on the report, the
4.3.3 Distance and TOT of each PCA to contaminant levels for VOC, SOC, IOC,
Drinking Water Intake (Lake Mead) microbiological, and Radiological were assigned as
As noted earlier, the source water Low, Low, High, High, and Low respectively. The
protection areas extent up to 35 miles which is detailed analysis for existing local water quality can
beyond the 10 miles required by the USEPA. The be obtained from the same report (Piechota et al.,
distance from the drinking water intake to each PCA 2003).
is shown in Figure 9a. Approximately 33% (107
PCAs) of the PCAs were closer than 20 miles to the 4.6 Land Uses within the Source Water
intake, 7% were within 15 miles, and nine PCAs Protection Areas
were within 10 miles. Approximately half of the The land use data shown in Figure 3 was
PCAs within 20 miles were septic systems. The used to identify land use within the source water
other main PCAs within 20 miles were medical, golf protection zones (A and B). If any part of a parcel
courses/parks, and storm drains. The medical PCAs was within the buffer, the whole parcel area was
include facilities such as hospitals and physician taken into account. Therefore, boundary parcels have
offices. The three WWTPs were all within 15 miles some of their area outside Zone B. Figure 10
of the intake. This distance was used with the presents the land uses within the source water
velocities to determine the time of travel for each protection zones. A large portion (45%) of the land
PCA from its source (Las Vegas Wash) to the source use within the source water protection zones was
water (Lake Mead). undeveloped, provided almost all undeveloped
Figure 9b summarizes the TOT for all the regions were in Zone B towards the Lake Las Vegas
PCAs. The TOT in Lake Mead is uncertain and and Lake Mead. In relation, approximately 83% of
depends on the particular contaminant of concern. the entire watershed is undeveloped. The next
The velocities in Las Vegas Wash are the highest of highest land uses within the source water protection
all the channels in the watershed due to the effluent zones were residential (22.8%), highways (13.3%),
from the WWTPs during dry weather conditions. commercial (7.2%), industrial (4.2%), park/golf
The PCAs that are located closest to Las Vegas courses (3.9%), and public land (3.6%). This
Wash will have the lowest TOT. Approximately suggests that any control of pollutants from these
22% (70 PCAs) of the PCAs reach Lake Mead in 12 areas will have a high impact on the protection of the
hours or less. The main activities with TOT less than drinking water intake.
12 hours to the intake were medical, septic systems,
stormwater drains, and golf course/parks. The 4.7 Vulnerability Analysis for each
effluent from the three WWTPs reaches Lake Mead Contaminant Category
in less than 12 hours. Contaminant sources located The vulnerability of each category of
close to a water intake would pose higher risk than contaminant in relation to the drinking water intake
those located further upstream because the time for was determined by combining the information
response would be longer for the latter. discussed in the above sections. A maximum
vulnerability score of 24 represents a PCA that has a
4.4 Physical Barrier Effectiveness (PBE) for High Risk rating (5), a Low PBE rating (5), a TOT
the Watershed less than six hours (9), and a High Water Quality
The PBE for the watershed was Low, which rating (5). A minimum vulnerability score of 3
means that the watershed and climate conditions of represents a PCA that has a Low Risk rating (1), a
the watershed do not act as an effective barrier for High PBE rating (1), a TOT greater than 24 hours,
preventing downstream migration of contaminants and a Low Water Quality rating (0). Within the
(Piechota et al. 2003). The single criterion that range of vulnerability scores (3 to 24), ratings were
forces the rating to be low is the influence of established based on statistics of all the possible
groundwater. Many of the tributaries for Las Vegas combinations of vulnerability scores. The ratings are
Wash are influenced by shallow groundwater flow. as follows:
All of these tributaries were included in the source High = vulnerability score in the upper 10%
water protection areas. A Low PBE rating receives a of the possible scores (> 19).
score of 5 to be used in the vulnerability assessment Low = vulnerability score in the lower 10%
for each PCA. of the possible scores (< 8).
364 | P a g e
7. Thomas C. Piechota, Anil Acharya, Silvia Albuquerque, Marcelo Reginato / International
Journal of Engineering Research and Applications (IJERA) ISSN: 2248-9622 www.ijera.com
Vol. 2, Issue 6, November- December 2012, pp.359-376
Moderate = vulnerability scores between 8 contamination is to call attention to those PCAs and
and 19. contaminate categories that pose the greatest risk to
A summary of the vulnerability of the the water source. The vulnerability analysis shows
drinking water intake to different contaminant that the PCAs with the highest vulnerability rating
categories is presented in Table 3. As an example, include septic systems, golf courses/parks, storm
the spatial distribution of the vulnerability of IOC channels, gas stations, auto repair shops,
contaminant is shown in Figure 11. The vulnerability construction, and the wastewater treatment plant
scores for each category were calculated based on discharges. The drinking water intake is at a
the average score of each PCA associated with the Moderate level of risk for VOC, SOC,
different contaminant categories. For instance, microbiological and radiological contaminants, and
VOCs were associated with 121 PCAs and the at a High level of risk for IOC contaminants. Further
average vulnerability score was 13. Based on the this study illustrates the applications of GIS in
vulnerability calculations, none of the contaminant developing a SWAP for a surface water intake in
categories have a Low vulnerability rating (< 8) due Lake Mead. The GIS tools were applied from the
to the High rating assigned to the PBE term in the identification of potential contaminant sources to
vulnerability equation. The drinking water source is identification of overall susceptibility of the raw
an open reservoir and is influenced by groundwater. water intake: for example, management of large data
For VOCs and SOCs, the majority of the sets, field data compilation, watershed delineation,
individual PCAs have a vulnerability score between source water protection zones designation, geo-
11 and 17, which corresponds to a Moderate rating. processing, and mapping the risk associated with
The average vulnerability score for all PCAs with each potential contaminant source. Source water
VOCs and SOCs was 13 and 15 respectively. protection in the Las Vegas Valley is strongly
Therefore, the vulnerability of the drinking water encouraged because of the documented influence of
intake prior to treatment to VOCs and SOCs is the Las Vegas Wash on the quality of the water at
Moderate. It is noteworthy that a Moderate rating is the intake.
assigned even though no MCL violations were noted
in the record for VOCs and SOCs and the water Acknowledgements
quality rating in Section 4.5 was Low. This occurs This research is supported through research
since the other factors (TOT, PBE and Risk) were contracts with the Nevada Division of
rated High, and this warrants an overall vulnerability Environmental Protection, State of Nevada Bureau
rating of Moderate. of Health Protection Services, and the University of
For the IOC category, the majority of the Nevada, Las Vegas. Views presented here do not
PCAs have a High rating due to the water quality necessarily represent those of the sponsoring
term (see Section 4.5) in the vulnerability equation. agencies.
A total of 173 PCAs were identified among which
almost 120 PCAs show higher vulnerability and 50 References
PCAs show moderate vulnerability. Therefore, the 1. Baker. J. R. and L. P. Paulson. (1980).
vulnerability of the drinking water intake to IOCs is “Influence of the Las Vegas Wash Intrusion
High. Of the PCAs with a High vulnerability score on Nutrient Distribution and Phytoplankton
(> 19), septic systems were the major activities Growth in Las Vegas Bay, Lake Mead.” In:
followed by golf courses, parks and storm water Proceedings of Symposium on surface
drains. For the Microbiological category, a total of Water I. Impoundment. American Society
196 PCAs were identified. More than half of the of Civil Engineers, Minneapolis, MN, June
PCAs (120) have a High rating and almost 75 PCAs 2-5; P. 1638-1646.
show moderate rating. The overall average of the 2. Baker, J.R., Deacon, J.E., Burke, T.A.,
PCAs was a vulnerability score of 18 (See Table 3), Egdorf, S.S., Paulson, L.J., Tew, R.W.
which corresponds to a Moderate vulnerability of the (1977). “Limnological Aspects of Lake
drinking water prior to treatment. Similar to the IOC Mead, Nevada-Arizona”. A report prepared
category, septic systems were the major activity and submitted to the Bureau of
associated with the PCAs with a High vulnerability Reclamation, Lower Colorado region,
score. The Radiological category has only one PCA Boulder City, Nevada, June 1977.
and a Moderate vulnerability rating since the score 3. Beavans, H.E., Goodbread, S.L., Miesner,
was 19. J.F., Watkins, S.A., Gross, T.S., Denslow,
N.D.,
7.0 Conclusions 4. Schieb, T. (1996). “Synthetic organic
As a preliminary assessment, the SWAP’s compounds and carp endocrinology and
goal was to identify contaminating activities and histology in Las Vegas Wash and Calville
assign a potential risk to these activities. The Bays of Lake Mead, Nevada, 1992-1995.”
objective of determining the vulnerability of the U.S. Geological survey Water Resources
water intake at Lake Mead to specific sources of Investigation Report 96-4266, 12p.
365 | P a g e
8. Thomas C. Piechota, Anil Acharya, Silvia Albuquerque, Marcelo Reginato / International
Journal of Engineering Research and Applications (IJERA) ISSN: 2248-9622 www.ijera.com
Vol. 2, Issue 6, November- December 2012, pp.359-376
5. Boralessa, R. and Batista, J.R. (2000). S.S., Griffiths, S.D., Bryant,
“Historical Perchlorate levels in the Las A.J., Reich, R.R. and Herwaldt, B. L.
Vegas Wash and Lake Mead.” Proceedings (1996). “Cryptosporidiosis: An
of the 2000 American Water Works outbreak associated with drinking water
Association (AWWA), Inorganic despite state-of-the-art water treatment.”
Contaminants Workshop, Albuquerque, Annals of Internal Medicine, 124:459-468.
NM, February 27-29, 2000. 22. Maidment, D., 1993. Handbook of
6. Boralessa, M. (2001). Transport of Hydrology, United States of America:
Perchlorate in the Las Vegas Wash and McGraw-Hill, Inc.
Lake Mead. M.S. 23. Piechota, T., Batista, J., Reginato, M. and
7. Thesis, Department of Civil and Albuquerque S. (2003). “Source Water
Environmental Engineering, University of Assessment for the Las Vegas Valley
Nevada Las Vegas, Las Vegas, NV. Surface Waters”. Final Report for the State
8. Bureau of Health Protection of Nevada, Bureau of Health
Services (BHPS), State of Nevada. (1999). Protection Services, Carson City, Nevada,
“State of Nevada Source Water Assessment June 2003.
Program (SWAP)”. 24. Piechota, T., James, D., Batista, J., Amy, P.,
9. California Department of Health Services Du, M., Harbour, S., Reginato, M.,
(CDHS). (1999). “Drinking Water Source Rosenblatt, A. and Brown, C. (2002).
Assessment and Protection Program”. “Microbiological, Limnological, and
Division of Drinking Water and Nutrient Evaluations of the Las
Environmental Management. Access Vegas Wash/Bay System”. Final Report for
http://www.cdph.ca.gov/certlic/drinkingwat Nevada Division of Environmental
er/pages/dwsap.aspx. Protection, Feb 2002, 170 p.
10. Clark County Regional Flood Control 25. Roefer, P. A., Monscvitz, J.T., Rexing, D.
District (CCRFCD) (2002). Access J. (1996). “The Las Vegas
http://www.ccrfcd.org/ Cryptosporidiosis Outbreak”. Journal of the
11. Colorado River Water Users Association American Water Works Association, 88 (9):
(CRWUA) (2002). Access 95-106.
http://crwua.mwd.dst.ca.us/ 26. Roline, R.A., and Sartoris, J.J. (1996). “Las
12. Covay, K. J., and Beck, D. A. (2001). Vegas Wash Water Quality Monitoring
“Sediment-Deposition Rates and Organic Program: 1995 Report of
Compounds in Findings”. Tech. Mem. No. 8220-96-13,
13. Bottom Sediment at Four Sites in Lake Bureau of Reclamation, Technical
Mead, Nevada, May 1998”. U.S. Services Control, 11p.
Geological Survey, Open File Report 01- 27. Rosenblatt, A. L., and Amy, P. S. May.
282, Carson City, Nevada. (2002). “Antibiotic resistance of the Las
14. Dan Szumski & Associates (1991). “Lake Vegas Wash enterococci: A public
Mead Eutrophication Model Development health issue?”. 2002 Annual meeting of the
and Provisional Calibration”. Clark County American Society for Microbiology,
Sanitation District, Las Vegas, Nevada. Abstract Q-377.
15. Deacon, J.E. (1976). “Lake Mead 28. Sartoris, J.J., and Hoffman, D.A. (1971).
monitoring program”. Final Report to Clark “Measurement of Currents in Lake Mead
Co. Sanitation with the Deep Water Isotopic Current
16. District No. 1, Waste Treatment Physical Analyzer (DWICA)”. U.S. Department of
Development Section. 182 p.p. the Interior, Bureau of Reclamation,
17. Du, X. (2002). “Algal Growth Potential and Oct 1971, REC-ERC-71-38.
Nutrient Limitation in the Las Vegas Bay, 29. Southern Nevada Water Authority (SNWA)
Lake (2002a). “Water Resources Plan”. Access at
18. Mead, Nevada”. M.S. Thesis, Department www.snwa.com.
of Civil and Environmental Engineering, 30. SNWA (2002b). “Arsenic Input to Lake
University of Nevada Las Vegas, Las Mead from the Las Vegas Wash, Colorado,
Vegas, NV. Muddy and Virgin Rivers”. Internal
19. Geographic Information System Memorandum from Steve Acheampong
Management Office (GISMO) (2002). (Hydrologist II) to Kay Brothers
Access (Director of SNWA Resources), March 13,
20. http://www.co.clark.nv.us/ceit/gismo/gismo 2002.
.htm 31. Stave, A.K. (2001). “Dynamics of wetland
21. Goldstein, S. T., Juranek, D. D., Ravenholt, Development and Resource Management in
O., Hightower, A. W., Martin, J.L., Mesnik, Las Vegas Wash, Nevada”. Journal of
366 | P a g e
9. Thomas C. Piechota, Anil Acharya, Silvia Albuquerque, Marcelo Reginato / International
Journal of Engineering Research and Applications (IJERA) ISSN: 2248-9622 www.ijera.com
Vol. 2, Issue 6, November- December 2012, pp.359-376
the American Water Resources Association, for Surface Water Supplied Sources
37(5):1369-1379. of Drinking Water”. U.S. Environmental
32. Tim, U.S. and S. Mallavaram (2003). Protection Agency.
“Application of GIS Technology in 37. USEPA (1999). “Understanding the Safe
Watershed based Management and Drinking Water Act”. EPA 816-F-04-030,
Decision Making”. AWRA, Watershed June 2004. Access at
Update, 1(5):1:6. http://www.epa.gov/ogwdw/sdwa/pdfs/fs_3
33. U.S. Census (2000). Access at 0ann_sdwa_web.pdf
http://www.census.gov/ 38. USEPA (2001). “What is Source Water?”
34. U. S. Department of Agriculture (USDA) Access at
(1985). Soil Conservation Service. Soil http://www.epa.gov/safewater/prot
Survey of Las Vegas Valley Area, ect/swbasics.html#Anchor-What-49575
Nevada. 39. Western Regional Climate Center (WRCC)
35. U.S. Environmental Protection Agency (2002). Access at
(USEPA). (1997a). “State Source Water 40.
Assessment and Protection Programs http://www.wrcc.dri.edu/cgi-
Final Guidance”. Fact Sheet, August 1997. bin/clilcd.pl?nv23169
36. USEPA (1997b). “State Methods for
Delineating Source Water Protection Areas
List of Figures
Figure1 Overview of the Las Vegas Valley watershed, sub-watershed boundaries, and the proximity to Lake
Mead and the drinking water intake point.
367 | P a g e
10. Thomas C. Piechota, Anil Acharya, Silvia Albuquerque, Marcelo Reginato / International
Journal of Engineering Research and Applications (IJERA) ISSN: 2248-9622 www.ijera.com
Vol. 2, Issue 6, November- December 2012, pp.359-376
Figure 2. Hydrologic soil groups for the Las Vegas Valley based on data from Clark County GIS Management
Office and the U.S. Department of Agriculture (USDA 1985)
368 | P a g e
11. Thomas C. Piechota, Anil Acharya, Silvia Albuquerque, Marcelo Reginato / International
Journal of Engineering Research and Applications (IJERA) ISSN: 2248-9622 www.ijera.com
Vol. 2, Issue 6, November- December 2012, pp.359-376
Figure 3. Overview of land use for the Las Vegas Valley compiled from Clark County Assessor’s Office data
(2001).
369 | P a g e
12. Thomas C. Piechota, Anil Acharya, Silvia Albuquerque, Marcelo Reginato / International
Journal of Engineering Research and Applications (IJERA) ISSN: 2248-9622 www.ijera.com
Vol. 2, Issue 6, November- December 2012, pp.359-376
Figure 4.Overview of Lake Mead and the various basins. Inset figure displays the key water quality stations
used in this study, the drinking water intake at Saddle Island and the wastewater treatment plants (WWTP)
along the Las Vegas Wash.
Figure 5. (a) Extent of dry weather flows for summer 2001 and flow velocities (m/s) measurements for the dry
weather flows in the Las Vegas Valley (b) Alluvium soils and dry weather flows in the Las Vegas Valley.
370 | P a g e
13. Thomas C. Piechota, Anil Acharya, Silvia Albuquerque, Marcelo Reginato / International
Journal of Engineering Research and Applications (IJERA) ISSN: 2248-9622 www.ijera.com
Vol. 2, Issue 6, November- December 2012, pp.359-376
Figure 6. Source water Protection Zones A and B for the Las Vegas Valley watershed. It also
shows the location of Potential Contamination Activities (PCAs) and other sources not included
in the list (Table 1).
Figure 6.Source water Protection Zones A and B for the Las Vegas Valley watershed. It also shows the location
of Potential Contamination Activities (PCAs) and other sources not included in the list (Table 1).
Figure 7. Location of National Pollutant Discharge Elimination System (NPDES) permits in the Las
Vegas Valley.
371 | P a g e
14. Thomas C. Piechota, Anil Acharya, Silvia Albuquerque, Marcelo Reginato / International
Journal of Engineering Research and Applications (IJERA) ISSN: 2248-9622 www.ijera.com
Vol. 2, Issue 6, November- December 2012, pp.359-376
Figure 8. Septic tank locations within the source water protection area (Zone A) of the Las Vegas Valley.
372 | P a g e
15. Thomas C. Piechota, Anil Acharya, Silvia Albuquerque, Marcelo Reginato / International
Journal of Engineering Research and Applications (IJERA) ISSN: 2248-9622 www.ijera.com
Vol. 2, Issue 6, November- December 2012, pp.359-376
Figure 9. (a) Distance of each Potential Contamination Activity (PCA) from the drinking water intake (b) Time
of travel (TOT) of each PCA to Lake Mead / Las Vegas Bay.
Figure 10. Land use within source water protection Zones A and B for the Las Vegas Valley extension of dry
weather flows.
373 | P a g e
16. Thomas C. Piechota, Anil Acharya, Silvia Albuquerque, Marcelo Reginato / International
Journal of Engineering Research and Applications (IJERA) ISSN: 2248-9622 www.ijera.com
Vol. 2, Issue 6, November- December 2012, pp.359-376
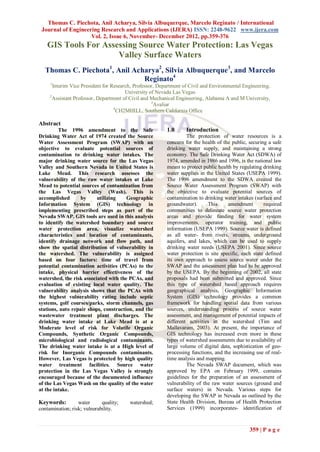
Types of PCAs with Vulnerability Greater than 19 (High)
100
80
Number of PCAs
60
40
20
0
ns
s
s
s
ols
rt.
ns
he
si n
ie
io
rT
tio
po
er
ut
as
ba
te
rs
ta
ti t
ss
rW
wa
nu
ns
rS
ion
ce
lI
Ca
te
fe
nt
&
s,
na
as
ns
te
ks
em
io
W
re
ra
ar
at
st
rT
,p
s&
s&
uc
Sy
es
we
in
Ed
on
ic
rs
ra
Se
pt
go
ou
rD
Se
La
C
te
olf
e
wa
ag
G
m
pt
or
Se
Type
St
Figure 11.Vulnerability of inorganic compounds (IOC) to the drinking water intake. The bar graph represents
the number and type of PCAs for IOC with vulnerability greater than 19 (High).
374 | P a g e
17. Thomas C. Piechota, Anil Acharya, Silvia Albuquerque, Marcelo Reginato / International
Journal of Engineering Research and Applications (IJERA) ISSN: 2248-9622 www.ijera.com
Vol. 2, Issue 6, November- December 2012, pp.359-376
List of Tables
Table 1 Potential contamination sources (Categories – A=VOC, B=SOC, C=IOC, D=microbiological,
E=radionuclides)
Risk Risk
Code Contaminant Category Ranking Code Contaminant Category Ranking
1 Animal burial areas C, D High 28 Educational institutions B, C Moderate
2 Animal feedlots B, C, D High 29 Medical institutions D Low
3 Chemical Application B, C High 30 Research laboratories A, B, C, D High
Chemical mixing & storage
4 areas A, B, C High 31 Aboveground storage tanks A High
5 Irrigated fields B Moderate 32 Underground storage tanks A High
Irrigation ditches C High 33 Public storage A Low
6 Manure spreading & pits A, C Moderate 34 Radioactive materials storage E High
7 Unsealed irrigation wells A, C High 35 Dumps and landfills A,B,C,D,E High
8 Chemical manufacturers, A, B, C High 36 Municipal incinerators B, C, D Moderate
warehousing/distribution Recycling & reduction
activities 37 facilities C High
9 Electroplaters & fabricators C High 38 Scrap & junkyards A, C High
10 Electrical products and C High 39 Septage lagoons, wastewater B, C, D High
manufacturing treatment plants
Machine & metalworking
11 shops A High 40 Sewer transfer stations B, C, D High
12 Manufacturing sites A, B, C High 41 Airports A High
Petroleum products
13 production, A High 42 Asphalt plants A High
storage & distribution center 43 Boat yards/Marinas A High
14 Dry cleaning establishments A High 44 Cemeteries D Moderate
15 Furniture & wood stripper & A High 45 Construction areas A Moderate
refinishers 46 Dry wells A, D High
16 Jewelry & metal plating C High 47 Fuel storage systems A High
Golf courses, parks &
17 Laundromats Low 48 nurseries B, C High
18 Paint shops A High 49 Mining A, C High
Photography establishments
19 & 50 Pipelines A High
printers 51 Railroad tracks, yards & A, B, C, D High
20 Auto repair shops A High maintenance
Surface water
21 Car washes A, C, D Moderate 52 impoundments, D High
22 Gas Stations A High streams / ditches
Road deicing operations: Stormwater drains &
23 storage C Moderate 53 retention A, B, C, D High
& application areas basins
24 Road maintenance depots A, C High 54 Unplugged abandoned well A, B, C, D High
Household hazardous High -
25 products A, B, C Moderate 55 Well: operating Low
A, B, C,
26 Private wells D Moderate 56 Other
27 Septic systems, cesspools B, C, D High
Note: Table adopted from BHPS (1999).VOC- Volatile Organic Compounds; SOC- Synthetic Organic
Compounds; IOC- Inorganic Compounds.
375 | P a g e
18. Thomas C. Piechota, Anil Acharya, Silvia Albuquerque, Marcelo Reginato / International
Journal of Engineering Research and Applications (IJERA) ISSN: 2248-9622 www.ijera.com
Vol. 2, Issue 6, November- December 2012, pp.359-376
Table 2 Summary of the different contaminant sources within the source water protection
Zone A (includes all field investigations, GIS data, and NPDES permits)
Number of Number of
sites within sites within
buffer zone Code Contaminant buffer zone Code Contaminant
123 27 Septic Systems, 6 45 Construction areas
cesspools
49 29 Medical Institutions 5 43 Boat yards / Marinas
40 20 Auto Repair Shops 4 17 Laundromats
19 22 Gas Stations 4 19 Photography
establishments & printers
10 14 Dry Cleaning 4 28 Educational Institutions
Establishments
10 21 Car Washes 3 8 Chemical manufacturers /
warehouse / distrbution
activities
10 33 Public storage 3 30 Research laboratories
10 48 Golf courses, parks & 2 11 Machine and
nurseries metalworking shops
8 39 Septage Laggons, 1 15 Furniture & wood stripper
Wastewater Treatment refinishers
Plants
8 53 Stormwater drains &
retention basins 1 40 Sewer Transfer Stations
1 56 Other
Table 3 Summary of the number of PCAs for contaminant categories and the final vulnerability ratings based on
PBE, TOT, Risk, and Water Quality. (Low = 3-7, Moderate = 8-19, and High = 20-24)
Contaminant Category Number of PCAs Maximum Minimum Average Rating
VOC 121 19 7 13 Moderate
SOC 158 19 11 15 Moderate
IOC 173 24 14 20 High
Microbiological 196 24 12 18 Moderate
Radiological 1 19 19 19 Moderate
376 | P a g e