More than Just Lines on a Map: Best Practices for U.S Bike Routes
GVM Market Commentary 20110516
1. Managed Volatility Strategy
Commentary
May 16, 2011
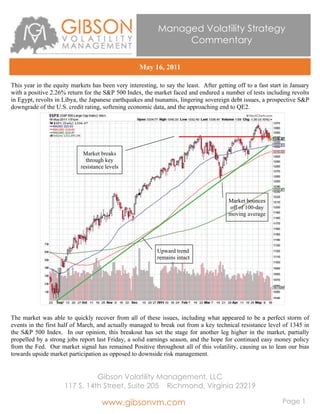
This year in the equity markets has been very interesting, to say the least. After getting off to a fast start in January
with a positive 2.26% return for the S&P 500 Index, the market faced and endured a number of tests including revolts
in Egypt, revolts in Libya, the Japanese earthquakes and tsunamis, lingering sovereign debt issues, a prospective S&P
downgrade of the U.S. credit rating, softening economic data, and the approaching end to QE2.
Market breaks
through key
resistance levels
Market bounces
off of 100-day
moving average
Upward trend
remains intact
The market was able to quickly recover from all of these issues, including what appeared to be a perfect storm of
events in the first half of March, and actually managed to break out from a key technical resistance level of 1345 in
the S&P 500 Index. In our opinion, this breakout has set the stage for another leg higher in the market, partially
propelled by a strong jobs report last Friday, a solid earnings season, and the hope for continued easy money policy
from the Fed. Our market signal has remained Positive throughout all of this volatility, causing us to lean our bias
towards upside market participation as opposed to downside risk management.
Gibson Volatility Management, LLC
117 S. 14th Street, Suite 205 Richmond, Virginia 23219
www.gibsonvm.com Page 1
2. GVM Managed Volatility Strategy
Commentary: May 16, 2011
The next few months could look very similar to the past three, where the market moves swiftly in both directions, but
where the overall point to point move over that time period may not be significant. Investors will continue to digest a
number of positive and negative factors.
Positive Factors Negative Factors
Strong technical trends Risk of inflation
Accommodative Federal Reserve policy Seasonal cyclicality (“sell in May and go away”)
Strong earnings Impact of commodity selloff on hedge funds
Companies flush with cash on their balance sheets Lack of resolution on budget deficit and debt ceiling
Significant investor cash yet to enter the market The unanticipated market shock event
I will touch on a few of these factors as they could prove to be big market movers. There has obviously been
significant chatter about QE2 coming to an end in June and the potential impact that could have on the market. It is
interesting to see interest rates moving down fairly sharply despite the prospect of such a big buyer of Treasuries (the
Fed) coming out of the market soon. Couple that with the recent weakening in some economic data and a continued
weak job market, I start to wonder if the markets aren’t already starting to build in assumptions of QE3, or maybe
even just a watered-down “QE 2.5”. Talk of another QE is definitely out there, and there clearly is no consensus on
the issue as opposed to QE2, which was well telegraphed. One guess that I heard recently was that the Fed could look
to restructure their balance sheet by selling away some of the toxic assets that they accumulated in 2008, using those
profits and cash to continue bond purchases.
I think that the steep selloff in commodities and rally in the dollar is worth watching as it relates to hedge funds. The
short dollar/long commodities trade has been a very popular trade for a number of managers. These funds, which
employ leverage to enhance returns, have been able to ramp up their leverage levels pretty significantly given the low
volatility in the market (lower market volatility improves value-at-risk calculations which allows for more leverage).
A quick decline in these asset values combined with a jump in volatility could force a quick deleveraging for these
funds, and an easy source of liquidity for them could be equities that are sitting on nice recent gains. The potential
impact of this risk factor is highly dependent on 1) whether or not commodity and currency prices stabilize and 2) the
size of the exposures that these managers may have and the amount of leverage applied to those positions.
While inflows into equity funds have improved, there is still a lot of cash sitting on the sidelines that is held by
skeptical/nervous investors. In a market top, I would expect to see a last rush of investors getting in to avoid missing
more upside. While we saw signs of this in the commodity markets, it does not appear to be happening in equities.
Finally, the biggest risk could be something lurking out there that we cannot anticipate. The frequency of these
market shock events has certainly increased in recent years. However, until the negative factors take hold of the
market, we believe that it will continue to be “risk on” for professional managers and large investors that will look to
buy the market on dips.
Page 2
3. GVM Managed Volatility Strategy
Commentary: May 16, 2011
Market Volatility Trends
The CBOE Volatility Index (“the VIX”) is an index created to measure the expected 30-day volatility in the S&P 500 Index. It is
calculated by looking at the “implied volatility” of the S&P 500 Index options. This implied volatility moves up when there are
significant buyers of option contracts and goes down when there are significant sellers of option contracts. In the options world,
this buying and selling of option contracts is primarily based on traders opinions of where volatility will go in the future. For
example, if the options market is pricing in a volatility assumption of 20% (the VIX is priced at 20.00), but a trader thinks that
volatility will rise over the next 30-60 days, they might aggressively buy various options contracts hoping that the implied
volatility of the options and the VIX will spike, thus increasing the value of their option positions. Traders that think the market
will become less volatile may do the opposite, selling options contracts, trying to profit from a drop in implied volatility.
For a long time, the VIX was widely regarded as a contrarian indicator. Market volatility tends to increase more quickly in a
down move than in an up move. In a rapidly falling market, traders step in to buy downside put options hoping that market
volatility will spike and that these put options could help offset other losses they may have. As the market accelerates to the
downside, this put buying intensifies, sending option implied volatilities and the VIX sharply higher. If panic sets into the
market, this put buying hits extreme levels sending the VIX to extreme high levels. This is considered by many to be a sign of
capitulation and a signal to sell the market. The chart below shows how the VIX spiked dramatically at the market bottom in
March of 2009.
Many traders view a low VIX as a sign of market complacency as market participants are increasingly betting that volatility will
remain low, and thus sell options which keeps downward pressure on the VIX. I still believe that the VIX is a very useful
indicator to gauge expectations of volatility in the market but the influx of volatility-based products in the market has diminished
the reliability of the index as a stand-alone indicator to buy or sell. I especially believe that in today’s marketplace, the VIX can
remain well below average for a significant period of time in periods of supportive monetary policy. I am more inclined to look
for swift or extreme spikes in the VIX to help support other factors that point to oversold conditions and a buying opportunity.
Page 3
4. GVM Managed Volatility Strategy
Commentary: May 16, 2011
While the absolute level of the VIX may not be a key factor in our overall strategy, it is critical for us to fully understand the
volatility structure of the options market since we utilize conservative option strategies as our primary driver of alpha in our
strategy. Here are some of our general thoughts on volatility assumptions in the market today:
Outside of the recent spike in the VIX above 30 (near the peak of fear relating to the Japanese nuclear disaster),
market volatility expectations remain near 3-year lows
The options market is pricing in expectations that volatility in the market will rise over the coming months, indicated
by higher implied volatility in months with longer-term expirations compared to those with near-term expirations
There is a meaningful option “skew” in the market where the implied volatilities of above market call options is
much lower than that of below market put options. This is a result of heavy selling of above market calls and heavy
buying of below market puts. So, while the market volatility is low, traders are clearly willing to take risk off of the
table.
Due to relatively low implied volatility of above market calls, selling those call options has become much less
attractive given the risk that the market could continue its move higher causing call sellers to miss upside potential.
Conversely, even though downside put options are relatively more expensive than upside calls, they still offer
attractive value by historical standards.
Page 4
5. GVM Managed Volatility Strategy
Commentary: May 16, 2011
Final Thoughts
We believe that the next 3-6 months could be met with alternating sharp rallies and sharp declines and will be highly sensitive to
any meaningful economic, earnings and political news. While our signal remains positive and our bias will be market upside
participation, we will be on a close watch for key technical breakdowns in the market and will be responsive to systemic risk
factors that might impact the market. The concern is that a meaningful market breakdown could cause the market to finally
“revert to the mean” and send it back down to test the 200-day moving average, which is currently at 1230 for the S&P 500
Index (see below). The market last touched the 200-day moving average in September of 2010 after breaking through it to the
upside. While a fall to those levels may sound painful, it might actually prove to be healthy for the market. Plus, we have the
tools at our disposal to try to mitigate that potential risk should it surface. For now, we remain generally positive about the trend
and action in the market, but will be quick to react should risk increase in the market.
Shawn Gibson
President and Portfolio Manager
Page 4
6. GVM Managed Volatility Strategy
Commentary: May 16, 2011
Important Disclosures
The market commentary is provided by Shawn Gibson and are based on his views as of 05.12.2011. Charts are provided by
StockCharts.com and CBOE.com.
Investment advisory services are offered through Gibson Volatility Management, LLC (“GVM”). Securities and other
investments held in investment management or investment advisory accounts at Gibson Volatility Management are not insured
by the FDIC or any other government agency, and are subject to investment risk, including possible loss of principal invested.
This commentary is intended to provide a general overview of GVM’s views on the market and is not a complete description of
the characteristics and risks of call and put options. This information is for illustrative purposes only and should not be
considered investment advice or recommendation, or a reflection or projection of actual program process, returns and results.
The upside potential of call writing is limited to the strike price of the option plus the premium received. Investors writing calls
relinquish all appreciation potential above the call strike until the position is closed. The risk management benefits of call
writing are limited to the premium received and should not be considered an effective risk management strategy. The purchase
of put options requires a premium payment which may be significant in certain market environments. The protection offered by
puts is limited to the strike price of the put options, and investors are still at risk above the put strike. Any use of call spreads or
put spreads may further change the risk/return profile of call writing and put purchases. Investors using options may still have
significant market risk in their underlying portfolio, and should have the financial ability and willingness to accept such risks.
Use of option strategies may have unfavorable tax consequences.
The success of the strategies utilized by GVM is dependent on a number of factors including the correlation between a portfolio
and the indices underlying the index options utilized by GVM, if applicable. Tracking error between the investment portfolio and
the indices could cause the program to be unsuccessful.
Options are not suitable for all investors. Please ensure that you have read and understand the current Options Clearing
Corporation (OCC) risk disclosure document before entering into any options transactions. This document can be accessed at
the following web address: http://optionsclearing.com/about/publications/character-risks.jsp.
The S&P 500 Index is a free-float capitalization-weighted index of 500 large-cap common stocks actively traded in the United
States. The CBOE Volatility Index is an index designed to measure expected volatility in the S&P 500 Index over the next 30
days.
Gibson Volatility Management, LLC
117 S. 14th Street, Suite 205 Richmond, Virginia 23219
phone (804) 269-7721 e-mail chris@gibsonvm.com
www.gibsonvm.com Page 5